

A finance manager runs invoice processing through an AI Builder model trained to extract vendor, amount, and GL account from scanned receipts. The model reaches 94 percent accuracy in testing. On day one of production, it auto-posts a $50,000 invoice with the wrong GL account, costing two hours of detective work to fix. By day three, five more misclassifications land in the general ledger. The automation is disabled, invoices return to manual entry, and the project sponsor asks why the “accurate” model is still making costly mistakes.
The gap between testing accuracy and production safety isn’t a technology failure. It is a failure to account for what an accuracy metric actually tells you. An AI Builder model reporting 94 percent accuracy means one in roughly seventeen predictions will be wrong. In a finance system processing hundreds of transactions daily, “one in seventeen” is not acceptable for automated posting without human review. The difference between “generally accurate” and “safe to automate without oversight” requires a different measurement: confidence scoring and an intelligent routing system that uses it.
AI Builder provides confidence scores for most prediction tasks, but using them effectively means understanding what they measure, when to trust them, and how to handle predictions the model makes with low confidence. This is not a checkbox feature; it is the foundation for building automation that decision-makers can actually rely on.
What Confidence Scores Actually Measure
AI Builder returns a confidence value between zero and one for each prediction, representing the model’s statistical certainty about that specific output. This is not accuracy. Accuracy measures model performance across the entire test dataset. Confidence measures the model’s internal uncertainty about a single prediction.
A confidence score of 0.95 does not mean “95 percent likely to be correct.” It means the model’s learned patterns suggest this particular prediction is reliable according to its internal probability distribution. In practice, a prediction with confidence 0.95 is more likely to be correct than one with confidence 0.70, but the exact correlation between confidence and correctness depends on the specific model, the data it was trained on, and how representative production data is compared to training data.
This distinction matters because it changes how you use confidence as a decision signal. If you treat 0.95 as “definitely correct,” you will deploy the same ratio of errors as the model’s test accuracy (roughly one in seventeen). If you treat 0.95 as “probably correct compared to 0.70, but still worth a second look,” you can build a routing system that catches most of the risky predictions before they enter your core system.
Setting Confidence Thresholds
The first production decision is where to draw the threshold. Below a certain confidence value, the prediction goes to human review. Above it, the prediction enters automated processing. This threshold is not universal; it depends on the cost of a wrong decision, the volume of predictions, and the effort required for human review.
For invoice GL account classification, assume the model produces 200 invoices weekly. A wrong classification triggers a reconciliation loop and audit trail entry. The cost of each error includes accounting time, potential audit complexity, and systems rework. In this scenario, a threshold of 0.85 might be reasonable: predictions below 0.85 (roughly 10 percent to 15 percent of volume) go to a human queue for quick spot-check. Predictions above 0.85 (85 percent to 90 percent of volume) post automatically.
The threshold should shift based on downstream impact. For automated categorization of customer service tickets routed to a bot, a lower threshold (0.70 or 0.75) is acceptable because the cost of a misrouting is low and the human agent catches it immediately. For automated loan denial decisions, a much higher threshold (0.95 or 0.98) makes sense, even if it means a larger manual review queue, because the business and compliance cost of an incorrect decision is high.
Setting the threshold requires pilot data. Before full production, run the model on a representative sample of recent work and examine the distribution of confidence scores and their relationship to correctness. Plot confidence against error rate. Often you will find that confidence correlates imperfectly with accuracy, and you can identify a sensible threshold that balances automation volume and error risk.
Building Confidence-Aware Routing
AI Builder rarely runs in isolation. The typical pattern is: AI Builder predicts, Power Automate routes based on the prediction and its confidence score, and either a downstream system consumes the result or a human queue surfaces it for review.
In Power Automate, fetch the confidence value from the AI Builder action result. Most AI Builder prediction actions return not just the predicted value but also a confidence value. Check your specific model’s return schema; the confidence field might be named confidence, confidence_score, or included in a nested object depending on the prediction type. Extract it and pass it to a branching decision.
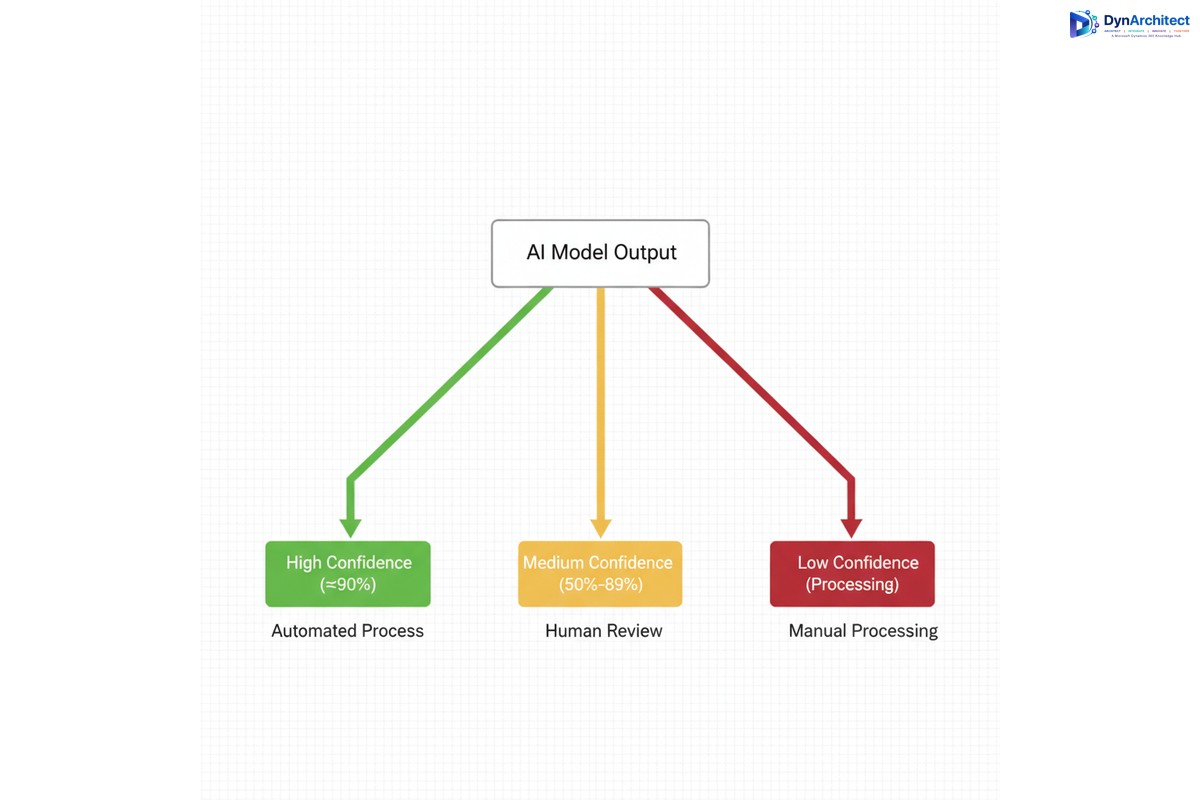
A three-branch routing pattern works well. If confidence is above the high threshold (0.90), route to automatic processing. If confidence is between thresholds (0.70 to 0.90), route to a human review queue with the prediction pre-populated and confidence displayed so the reviewer knows the model’s own uncertainty level. If confidence is below the low threshold (0.70), surface it as a flag case requiring full manual processing without the model’s suggestion, since a very low confidence prediction adds noise rather than help.
Within the human review queue, confidence becomes a sorting signal. Cases with confidence 0.88 should be reviewed before cases with confidence 0.72. The reviewer can quickly spot-check high-confidence cases and will catch more errors per hour on the lower-confidence cases that truly need scrutiny.
Handling Distribution Shift
Confidence scoring works well when production data matches the data the model was trained on. It breaks down when production introduces new patterns, edge cases, or systematic differences. A model trained on 2024 invoices will assign lower confidence to invoices with a new vendor format, or with line items in a currency not present in training data. A model trained on US customer data will assign lower confidence to customers from a region poorly represented in training.
This phenomenon is called distribution shift. When it occurs, confidence scores become less predictive of correctness. A prediction with confidence 0.85 that would normally be correct 85 percent of the time might only be correct 70 percent of the time if production data has drifted significantly.
Monitoring for distribution shift requires tracking two things: the overall distribution of confidence scores week to week, and the error rate within each confidence band. If the average confidence drops from 0.82 to 0.74 over a month, suspect distribution shift. If errors within the 0.80 to 0.90 band spike from two percent to eight percent, confirm it.
When distribution shift is detected, retrain the model on recent production data, or apply transfer learning to adapt the existing model to the new patterns. This is not a one-time task; models decay over time, and quarterly retraining cycles are standard practice for models in production.
Audit, Compliance, and Decision Logging
Finance and compliance teams require a complete audit trail for every automated decision. Confidence scores are part of that trail. For each automated transaction, log not just the decision and the predicted value, but also the confidence score at the time the decision was made. If the transaction is later questioned, an audit shows both what the model predicted and how confident it was.
In many organizations, automated decisions below a regulatory threshold (perhaps any transaction over a certain amount, or any customer marked for special review) automatically escalate to a human approval step regardless of confidence. This is appropriate. Automation should accelerate routine decisions, not replace governance.
Document your confidence thresholds as part of your automation governance. Record the date the threshold was set, the reasoning behind it, and any changes. If an error occurs, this documentation becomes part of the root cause analysis. It demonstrates that the automation was designed with business intent, not implemented carelessly.
Monitoring and Iterative Improvement
After the first month of production, analyze the correlation between confidence and actual outcome. If predictions with confidence above 0.85 are wrong just two percent of the time while predictions with confidence 0.70 to 0.85 are wrong thirty percent of the time, your threshold is well-calibrated. If predictions above 0.85 are wrong ten percent of the time, your threshold is too aggressive and you need to raise it to 0.92 or 0.95.
Set up dashboards that track confidence distribution, error rates by confidence band, and the volume of cases routed to each path. Alert if the error rate in the automated path exceeds a threshold (perhaps 5 percent). Alert if average confidence trends downward, signaling model decay.
Use this monitoring data to refine your model quarterly. Collect the cases that were routed to human review, particularly those where the human disagreed with the model prediction. Use disagreement cases as negative examples to retrain the model, improving its calibration.
Conclusion
Confidence scoring transforms AI Builder from a tool that makes predictions to a tool that makes predictions and quantifies its own uncertainty. Using confidence well means treating it not as a precision guarantee but as a sorting mechanism that reduces risk by routing uncertain predictions to humans who can make the final call. This shifts the conversation from “is this model accurate enough?” to “how do we use this model’s accuracy in a system that cannot tolerate errors?” The second question is the one that actually gets projects to production and keeps them there without creating extra work downstream. Routeget Technologies helps organizations build exactly this kind of safeguarded automation, where AI is an accelerant for human decision-making, not a replacement for accountability.
#AIBuilderConfidence #AIAutomation #FinanceAutomation #AIMLModeling #DynamicsAI