
Building Real-Time Notification Architecture for Dynamics 365 Sales: Webhook Integration with Azure Service Bus and Power Automate

Dynamics 365 Sales implementations often face a common technical challenge: sales teams need immediate notification when critical events occur—an opportunity moves to a new stage, a lead score exceeds a threshold, a competitor activity is logged—but achieving reliable, scalable real-time notifications requires thoughtful architecture beyond what Power Automate alone provides out of the box.

The straightforward approach of triggering Power Automate cloud flows directly from Dynamics 365 actions looks simple until volumes grow. A single when-a-record-is-created trigger can queue hundreds of flows daily. If downstream notification systems are temporarily unavailable, Power Automate queues fill, flows throttle, and notifications arrive hours late or fail silently. The team ends up adding monitoring, retry logic, and dead-letter queueing to patch the gaps.

A more resilient pattern moves event processing to an asynchronous message queue. Dynamics 365 emits events as webhook payloads; Azure Service Bus handles queueing and delivery guarantees; Power Automate consumes messages at a rate it can handle. This decoupling absorbs traffic spikes, guarantees delivery, and gives operations clear visibility into what succeeded and what needs manual intervention.

Webhook Event Flow Architecture

Dynamics 365 webhooks fire synchronously when table rows change. Each webhook registration defines an event (Create, Update, Delete), a target table (Opportunity, Lead, Contact), and a callback URL. When the event occurs, Dynamics 365 constructs a JSON payload containing the entity ID, logical name, and operation type, then POSTs it to the registered endpoint within 2 seconds.

The webhook payload structure is minimal: a 40-character GUID entity ID, the logical name of the table (e.g., “opportunity”), the operation type (1 for Create, 2 for Update, 3 for Delete, 4 for SetState), and a CorrelationId for trace correlation. Attributes are not included in the webhook payload by default; you fetch them afterward if needed.

For a real-time notification system, this webhook becomes the trigger. Rather than calling downstream services directly from the webhook handler, the webhook handler parses the payload and places a message on an Azure Service Bus topic or queue. This intermediate step is critical: it ensures the webhook handler completes quickly (Service Bus acknowledges the message in milliseconds), freeing the webhook thread before downstream systems respond.

Azure Service Bus Integration

Azure Service Bus provides two patterns: queues for point-to-point messaging and topics with subscriptions for publish-subscribe. For notifications, a topic is appropriate: multiple downstream subscribers (sales team Slack, CRM dashboard, email notification service) each receive the same notification event without the webhook handler needing to know about each one.

The integration flow looks like: (1) Webhook receives Dynamics 365 event payload. (2) Webhook code parses the payload, extracts the entity ID and operation, constructs a message. (3) Code pushes the message to Azure Service Bus topic. (4) Service Bus persists the message and routes it to all active subscriptions. (5) Power Automate flow receives the message and triggers downstream actions (Slack notification, email, webhook to external system).

Service Bus guarantees at-least-once delivery: if a subscriber fails to acknowledge the message, Service Bus retains it and redelivers after a configurable timeout. This means your notification flows must be idempotent: if the same notification arrives twice due to a retry, the downstream system should handle it gracefully.

Power Automate as Consumer

Power Automate’s Service Bus connector provides two trigger types: “When one or more messages arrive in a queue” and “When a message arrives in a topic subscription.” The subscription trigger is what you need.

A typical flow structure: Trigger on Service Bus message, parse JSON, apply condition based on operation type, fetch full record from Dynamics 365, compose notification, post to Slack, complete message. The 30-second polling interval introduces up to 30 seconds latency from event to notification. For critical, low-volume events, this is acceptable. For high-volume events, consider reducing the polling interval to 10 seconds or increasing the messages per poll limit to 20, though this increases Power Automate licensing cost.

Handling Failures and Retries

Service Bus retries failed messages automatically. If a Power Automate flow fails (e.g., network timeout to Slack), the flow execution fails, but the Service Bus message is not acknowledged. After a configurable interval (default 60 seconds), Service Bus redelivers the message. After a maximum retry count (default 10), Service Bus moves the message to a dead-letter queue where operations can inspect and debug it.

In your Power Automate flow, add explicit retry logic using the Retry policy action. For the Slack notification step, configure retry with exponential backoff. Document your dead-letter queue monitoring: set up an alert in Azure Monitor that triggers an email to your ops team whenever a message enters the dead-letter queue. Dead-letter messages indicate configuration errors or repeated downstream failures that require investigation.

Performance Scaling Considerations

At 1,000 events per day, a single webhook and single Service Bus subscription handle the load easily. At 10,000 events per day, consider whether Power Automate’s 30-second polling introduces unacceptable latency. If so, scale to multiple subscriptions: route different event types to separate topics and subscriptions, so notifications are processed in parallel.

Each Power Automate flow instance consumes one run against your licensing limit. A high-volume event system (10,000+ events daily) can consume 300-500 runs per month just for webhook consumption. Size your Power Platform licensing accordingly, or move high-volume consumers to dedicated Azure Functions instead of Power Automate, reserving Power Automate for human-facing notifications and CRM updates.

For Dynamics 365 webhooks themselves, Microsoft throttles webhook retries: if a webhook endpoint returns errors on 10 consecutive attempts, Dynamics 365 disables the webhook registration. Monitor webhook health via the Plugin Trace Log: exceptions during webhook execution are logged there. Set up alerts in your monitoring system to catch disabled webhooks within hours, not days.

Implementation Checklist

Dynamics 365 webhook registration (table: Opportunity, event: Create, callback URL). Webhook handler application (Node.js, Python, or .NET) with Service Bus client library, running in Azure App Service or Azure Functions. Azure Service Bus topic and subscription. Power Automate flow with Service Bus trigger, Dynamics 365 connector to fetch full record, and notification action. Monitoring for Service Bus dead-letter queues, Power Automate flow failures, webhook disabled events. Documentation of event payload schema, supported operations, expected latency, and troubleshooting runbooks.

When Real-Time Isn’t Required

Not every Dynamics 365 event needs real-time notification. Daily digest emails of all opportunities created are often more useful than instant notifications for every single event. Batch-oriented Power Automate flows (scheduled to run nightly, querying for records created in the last 24 hours) consume fewer licensing runs and are easier to monitor. Real-time architecture is justified when business decisions depend on immediate awareness.

Conclusion

Building a real-time notification architecture for Dynamics 365 Sales is now a straightforward technical undertaking: webhooks push events to Azure Service Bus; Power Automate pulls from the queue; notifications reach the team on their preferred channels. The architecture scales to thousands of events per day, handles failures gracefully, and gives operations visibility into event flow. For organizations that need their sales teams to act within minutes of opportunity changes or lead scoring events, this pattern delivers the technical foundation to make that possible.


#DynamicsSalesArchitecture #WebhookIntegration #RealTimeNotifications #AzureServiceBus #PowerAutomatePatterns #D365Development #CRMIntegration

Implementing Robust Error Handling in Power Automate: Patterns for Enterprise Deployments

One of the most insidious threats to enterprise automation is the silent failure—a workflow that appears to complete successfully but delivers corrupted data, skipped steps, or incomplete transactions. In Power Automate, uncaught errors compound this risk when operations fail without proper logging or recovery mechanisms. Implementing robust error handling isn’t just best practice; it’s essential infrastructure for reliable cloud automation.

Enterprise deployments demand structured, predictable error handling patterns that prevent cascading failures, enable rapid diagnosis, and allow graceful degradation when failures occur. This article explores the patterns and techniques that separate production-grade flows from prototype implementations.

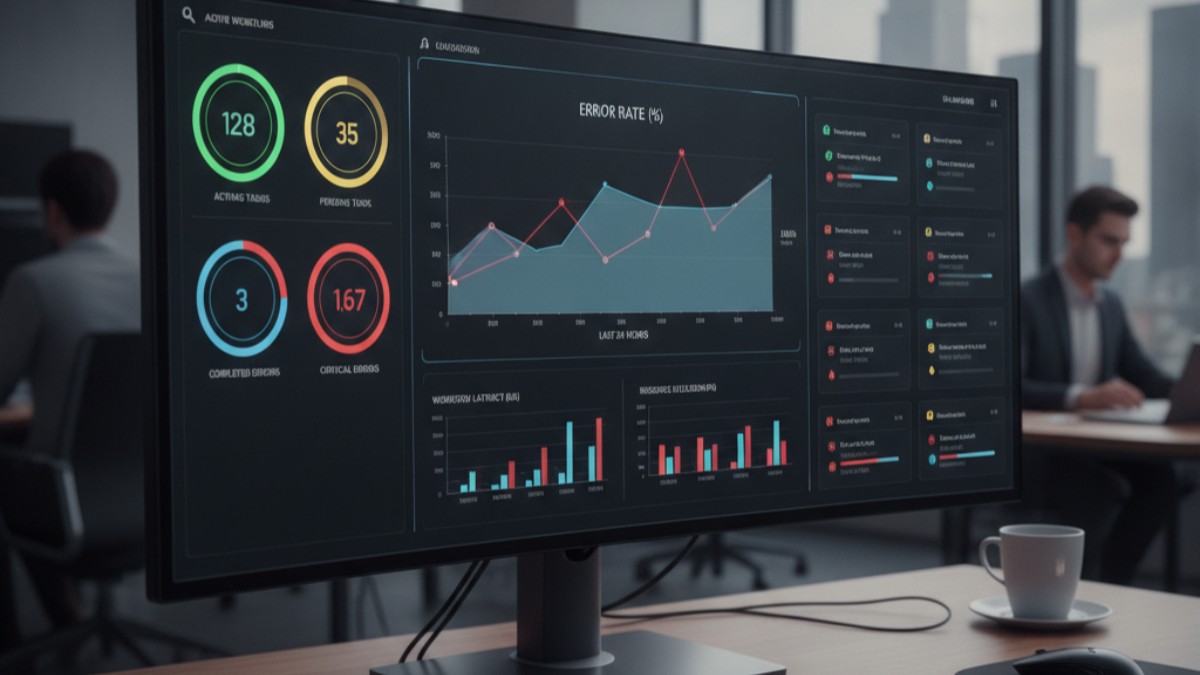
Professional dashboard showing real-time monitoring and error tracking for cloud automation workflows with status indicators and error rate graphs
Real-time error monitoring and tracking dashboard

One of the most insidious threats to enterprise automation is the silent failure—a workflow that appears to complete successfully but delivers corrupted data, skipped steps, or incomplete transactions. In Power Automate, uncaught errors compound this risk when operations fail without proper logging or recovery mechanisms. Implementing robust error handling isn’t just best practice; it’s essential infrastructure for reliable cloud automation.

Enterprise deployments demand structured, predictable error handling patterns that prevent cascading failures, enable rapid diagnosis, and allow graceful degradation when failures occur. This article explores the patterns and techniques that separate production-grade flows from prototype implementations.

Detecting and Classifying Errors

The foundation of error handling is visibility. Power Automate provides multiple error detection mechanisms, each suited to different scenarios:

Action-level error handling: Using “Configure run after” settings on each action lets you specify which states trigger conditional logic. You can configure actions to run on success, failure, timeout, or skip conditions. This approach is granular but can create complex conditional branches if overused.

Scope-based error handling: Wrapping related actions in a Scope action creates a logical transaction boundary. If any action within the scope fails, the entire scope transitions to a failed state. You can then configure error handling that applies to the entire scope rather than individual actions.

Try-catch patterns: Though Power Automate lacks explicit try-catch syntax, you can implement equivalent logic using scopes with nested conditional actions. A scope attempts operations; a parallel action monitors for failures and executes recovery logic.

Classification is equally important. Not all errors are equal. Transient network timeouts warrant automatic retry; authentication failures typically don’t. Data validation errors signal bugs in upstream systems and require investigation. By classifying errors according to their root cause and severity, you can implement proportionate responses.

Implementing Retry Logic

Retry logic is your first defense against transient failures. Power Automate HTTP actions support built-in retry policies with exponential backoff. For other action types, you implement retry using loops and counters:

Create a boolean variable “RetryNeeded” initialized to true, and a counter “Retries” initialized to 0. Wrap your operation in a Do-Until loop that continues while “RetryNeeded” is true and “Retries” is less than your maximum (typically 3-5 for transient failures). On success, set “RetryNeeded” to false. On failure, check the error type; if transient, increment “Retries” and let the loop continue. If permanent, set “RetryNeeded” to false and handle the error.

Exponential backoff is crucial: waiting 1 second, then 2, then 4, then 8 between retries reduces load on failing systems and increases success rates for temporary outages. Implement this using a Delay action whose duration scales with the retry count.

Always set a maximum retry count. Infinite retry loops mask underlying problems and consume flow runs unnecessarily. Three to five attempts generally balances resilience against resource consumption.

Structured Logging and Diagnostics

When errors occur, you need complete context: what was the input? What action failed? What was the error message? What was the state of related systems? Without this information, diagnosing failures in production consumes hours of investigation.

Implement structured logging by writing a standardized error record to a central log table immediately upon detecting failure. Include: timestamp (utcNow()), flow name and run ID (workflow().id and workflow().run.identity.id), action name, error message, error code, relevant data inputs, and severity level (critical, high, medium, low).

Store logs in a dedicated SharePoint list, a SQL database, or an Azure Table. Avoid relying solely on Power Automate’s run history UI; it’s designed for troubleshooting individual runs, not systematic analysis. A structured log enables you to identify patterns—which actions fail most often? Which error codes indicate configuration problems? Which failures correlate with specific input patterns?

Graceful Degradation and Fallbacks

Not every error requires stopping the entire workflow. Enterprise systems often tolerate partial failures if they degrade gracefully. An approvals workflow might succeed even if email notification fails. A data synchronization might proceed with historical data if the real-time source is unavailable.

Implement graceful degradation by identifying non-critical operations and wrapping them in error handlers that log the failure but allow the flow to continue. Use a “success” variable that starts true; non-critical action failures set it to false and log the error, but don’t stop execution. Upon completion, log the overall status as “partial success with warnings” rather than complete failure.

Fallback operations provide alternative paths when primary operations fail. If updating a primary database fails, write to an archive table. If sending to a preferred service fails, queue the work for later retry via a secondary system. If a required approval fails to complete, escalate to a manager rather than blocking indefinitely.

Monitoring and Alerting

Enterprise data center with server racks and network connections representing cloud infrastructure and automation systems

Structured logging is only valuable if someone monitors it. Configure automated alerts on your error log: if the error rate exceeds threshold, if a critical action fails repeatedly, or if specific error types appear. Use Power Automate itself to trigger alerts: a scheduled flow that queries your error log every hour and sends a summary to operational teams.

Alert fatigue is a real risk. Don’t alert on every error; many transient failures self-resolve. Alert on error rates exceeding baseline, on repeated failures from specific flows, and on critical errors. Include enough context in alerts that your team can begin investigation without accessing five different systems.

Dashboards that visualize error trends complement point-in-time alerts. A simple Power BI dashboard connected to your error log reveals which flows are deteriorating, which errors are emerging, and when flows became unreliable. This enables proactive maintenance before failures cascade.

Testing Error Paths

Errors happen in production, not in development. But you can test error handling by deliberately injecting failures. Create test flows that call your production flows with intentionally malformed inputs. Trigger HTTP actions against unreachable endpoints. Simulate database connection timeouts. Verify that errors log correctly and that alerts fire.

Version your error handling logic independently of feature logic. If you change retry counts, backoff intervals, or alert thresholds, test those changes in a lower environment first. A misconfigured retry loop that retries indefinitely is worse than no retry at all.

Enterprise Patterns in Practice

Real deployments combine these patterns. A robust data synchronization flow typically includes: scope-based error handling for logical transaction boundaries, retry logic with exponential backoff for transient failures, structured logging to every action, graceful degradation for non-critical operations, and monitoring that alerts on repeated failures.

A typical flow structure looks like: attempt primary operation in a scope; if scope fails, check error type; if transient, execute retry loop; if permanent, log and execute fallback operation or escalation; always log completion status (success, partial success, or failure).

The investment in error handling infrastructure pays dividends. Flows that handle errors gracefully recover automatically from transient outages without requiring manual intervention. Structured logs enable rapid diagnosis when problems do occur. Monitoring systems catch degradation before it becomes critical. Your team moves from reactive firefighting to proactive stability management.

About Routeget

Routeget specializes in enterprise automation architecture, helping organizations design and implement robust cloud workflows. Our expertise spans Power Automate, Logic Apps, and multi-cloud orchestration patterns. We help enterprises move from prototype implementations to production-grade systems that scale reliably.

Tags: #PowerAutomateErrorHandling #Dynamics365Development #CloudFlowPatterns #ErrorHandlingStrategy #PowerAutomatePatterns