
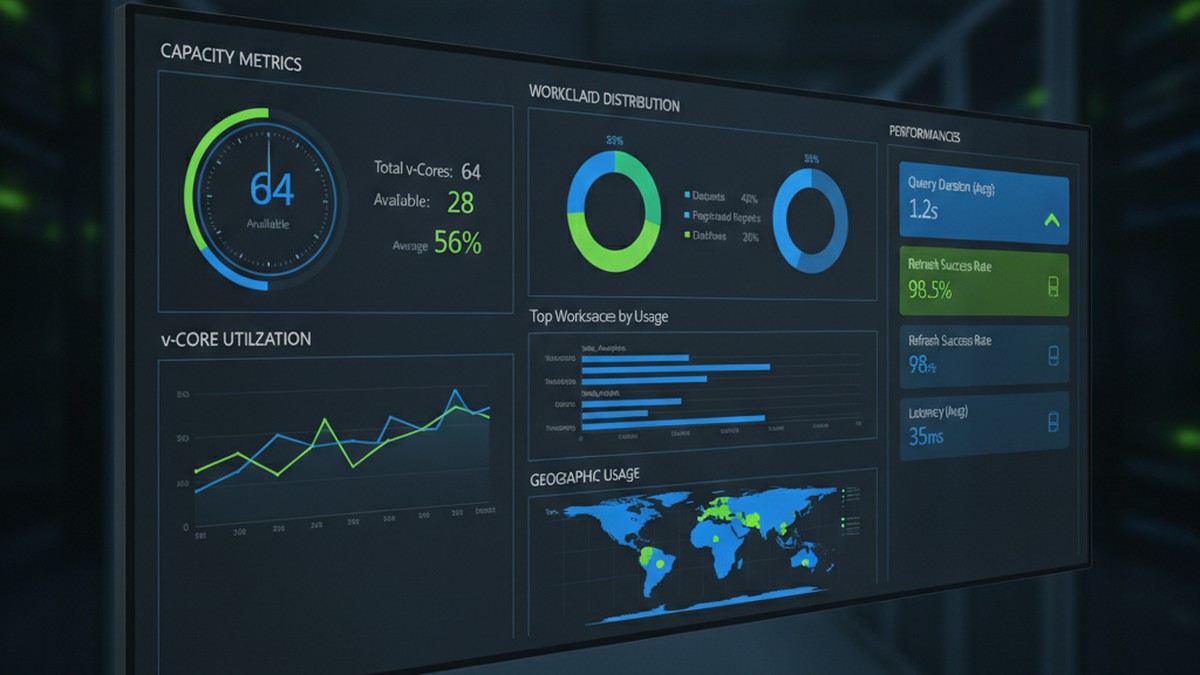
Most organizations deploying Power BI Premium start with a single capacity and assume the cloud handles the complexity. Within months, they encounter the same problem: reports that were responsive at launch now run slowly, refresh jobs fail intermittently, and the monthly capacity bill climbs without corresponding value. The issue is rarely that Premium itself is insufficient; it is that few teams understand how Premium actually allocates compute, how to monitor that allocation in real time, and how to design workloads that fit the capacity constraints.
This is a technical guide for BI architects, developers, and capacity administrators who need to build production Power BI environments that deliver consistent performance and predictable costs. We will work through capacity planning, workload isolation, query optimization, and the operational patterns that prevent Premium environments from becoming expensive, unreliable systems.
Understanding Power BI Premium Capacity Architecture
Power BI Premium provides a dedicated cloud resource that isolates your organization’s workloads from the multi-tenant shared capacity used by Pro license users. That isolation is the primary value, but it also introduces responsibility: you now own the capacity planning, performance tuning, and cost management that shared capacity users delegate to Microsoft.
A Premium capacity is measured in compute units called virtual cores, or v-cores, priced in tiers from 1 core upward. Each v-core provides a fixed compute budget allocated across query execution, data refresh, and paginated reporting. The budget refreshes hourly. When workloads exceed that budget, Premium applies throttling: queries slow, refreshes delay or fail, and users experience degradation until the current hour’s budget resets.
This is not a failure mode; it is intentional. The throttling is meant to protect the capacity from runaway queries and ensure consistent service levels across all workloads sharing the same capacity. The problem occurs when capacity is undersized relative to the workload, or when workloads are poorly designed and consume disproportionate resources relative to their value.
Capacity Sizing and Workload Assessment
Build an honest inventory of what will run on the capacity. Most organizations plan around a single “average” workload size, then are shocked when peak usage overwhelms that estimate. A realistic approach profiles three scenarios: peak refresh, peak query, and a mixture of both.
Refresh costs depend on semantic model size, refresh frequency, and incremental refresh strategy. A 10 GB model refreshed hourly demands very different compute than a 1 GB model refreshed daily. Measure actual memory consumption and query duration during a test refresh, then multiply by expected concurrency during peak hours.
Query costs are driven by semantic model size, query complexity, and concurrent users. A simple filtered report consumes far less capacity than complex matrix visuals with millions of cross-filtered cells. DirectQuery and real-time data are more expensive than import mode. The capacity is effectively governed by the least-optimized workload; a single slow dashboard can trigger throttling affecting all operations.
Instrument capacity usage with Power BI’s Metrics app or Admin API, measure actual consumption over a production month, and size to the 95th percentile of observed usage, not the average. Most organizations reduce capacity cost by 20 to 40 percent by simply understanding what they actually use.
Workload Isolation and Semantic Model Design
Premium capacity provides a feature called “workload isolation” that allows you to assign different workloads to separate compute pools with independent resource budgets. The most common pattern is to separate refresh workloads from query workloads, or to isolate a single expensive application from the rest of the organization’s reports.
At a technical level, workload isolation is effective because refresh and query operations compete for the same compute and memory on a shared capacity. During peak refresh hours, query performance degrades because the refresh jobs are consuming available vcore budgets. By isolating refresh into a dedicated workload with its own budget, you guarantee that queries will never starve, and vice versa.
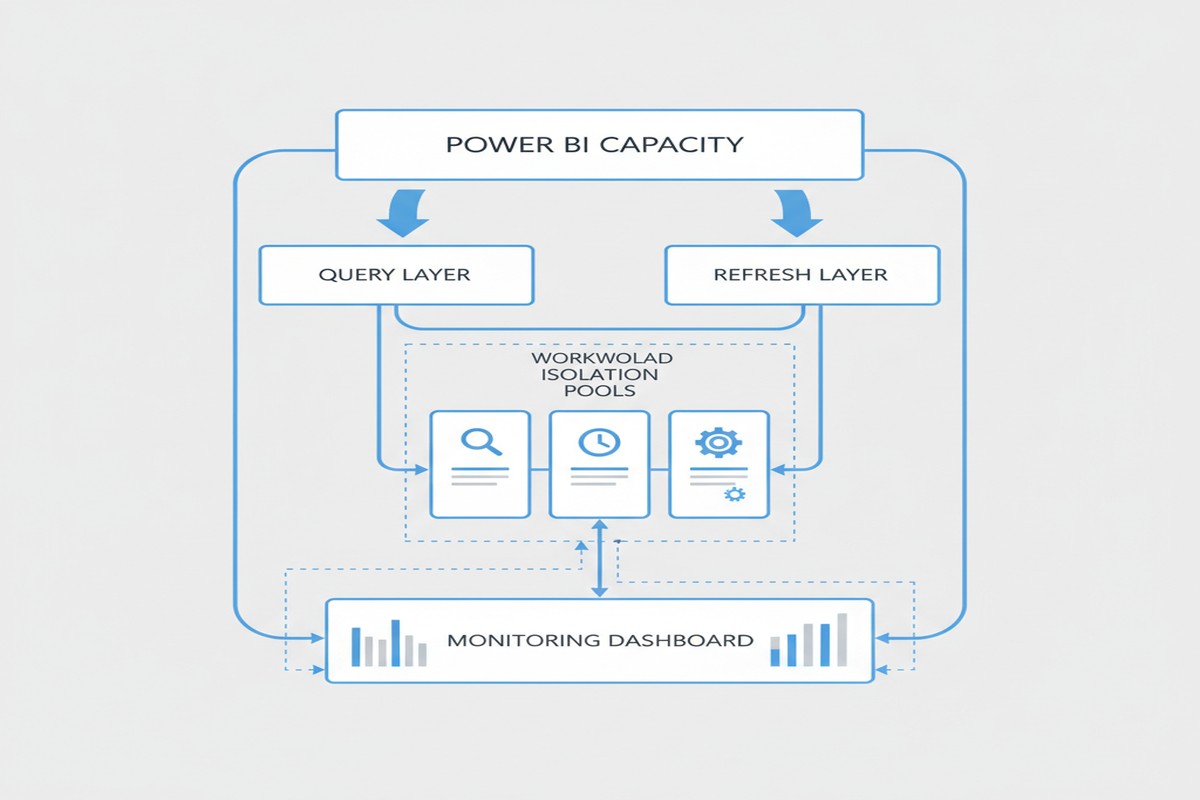
The decision to isolate workloads depends on whether the cost of isolation (you lose some capacity efficiency by dedicating separate resource pools) is outweighed by the benefit (guaranteed performance for critical queries or refreshes). For most organizations, a single isolated refresh workload is sufficient. Rarely do you need more than two or three workload isolations.
Semantic model design influences capacity efficiency dramatically. A single large model shared across many reports is more efficient than many small, redundant models duplicating the same dimensions and facts. However, large models are harder to maintain, permission, and optimize. Most organizations converge on a “hub-and-spoke” design: a small number of enterprise semantic models (3 to 6) owned by a central BI team, serving as the foundation for business-unit-specific reports and dashboards.
Query Optimization and Real-Time Analysis
Two mechanisms significantly impact capacity consumption: query folding in Power Query and relationship optimization in the semantic model.
Query folding pushes filter and aggregation operations down to the data source rather than pulling all data into Power BI for in-memory filtering. A properly folded query reduces data movement and memory consumption by orders of magnitude. The tradeoff is complexity: folded queries must be executable by the source system, ruling out some Python/R transformations.
For large data volumes or high refresh frequencies, investing in query folding often yields the highest return, reducing refresh time from hours to minutes and freeing up capacity for other workloads.
Relationship optimization includes careful cardinality settings, appropriate many-to-many relationships, and explicit measure branching. A model with thousands of ambiguous relationships forces Power BI to perform expensive relationship resolution on every query. Clean data models with clear relationships and explicit measures are far more efficient.
For real-time scenarios, DirectQuery and Push Datasets lower capacity consumption. DirectQuery queries the source directly but adds latency; the source must respond in hundreds of milliseconds. Push Datasets allow external systems to push data at API speeds, avoiding refresh windows entirely. Both require careful architecture to avoid swamping the data source.
Operational Monitoring and Cost Governance
Premium capacity consumption is measured via the Power BI Admin portal’s Metrics app and the Power BI API, which exposes activity logs and CPU/memory consumption by operation. The Admin API enables custom monitoring dashboards and automated alerting when thresholds are breached.
A mature Premium environment includes automated monitoring for capacity utilization trends, workloads consuming abnormal resources, failed refresh operations, and per-workload cost attribution enabling chargeback.
Governance practices include: quarterly capacity review boards, documented naming standards for models and reports, capacity impact assessment before onboarding new workloads, and performance SLAs backed by monitoring.
Organizations that skip this governance layer often find their Premium environment becomes a black box: costs rise unpredictably and performance degrades without clear cause. Operational tooling and governance practices pay for themselves many times over.
Common Pitfalls and Practical Next Steps
The most common mistakes are: sizing capacity based on theoretical maximum load rather than measured reality, allowing unoptimized queries and large unfolded data imports to run without constraint, mixing enterprise semantic models with personal workloads on the same capacity, and ignoring refresh scheduling and allowing refreshes to overlap.
The path forward is straightforward: measure actual consumption with the Metrics app or Admin API over a production month, document the peak periods and peak workloads, assess which workloads could be optimized with query folding or model redesign, and then right-size the capacity and implement workload isolation for any critically important refresh or query workload. Follow up monthly with utilization reviews and alert on workloads that consume anomalously high resources.
For teams implementing Premium for the first time, a pragmatic starting point is often a single 2 or 4 vcore capacity, one workload isolation for refreshes, and a simple monitoring dashboard tracking hourly utilization. From there, optimization and growth are data-driven: measure, identify bottlenecks, optimize, and only increase capacity when the measured peak approaches the capacity ceiling. Organizations that follow this pattern consistently report 30 to 50 percent lower costs than those that simply throw capacity at performance problems without understanding the underlying workload characteristics.
Routeget Technologies has guided dozens of organizations through Premium capacity design and optimization, from initial sizing through multi-capacity deployments with sophisticated governance. If your Premium environment is facing performance challenges or cost surprises, the root cause is almost always visibility and deliberate design, not capacity limitations.
#PowerBIPremium #CapacityManagement #DataLakeArchitecture #QueryOptimization #PowerBIGovernance #EnterpriseBI #DataEngineering
No comment yet, add your voice below!