
Optimizing Query Performance in Business Central: Preventing Reporting Timeouts in Month-End Closing and Financial Analysis

Optimizing Query Performance in Business Central: Preventing Reporting Timeouts in Month-End Closing and Financial Analysis

The month-end close in a mid-market manufacturer typically means dozens of finance teams running overlapping reports, consolidation queries, and analytical dashboards simultaneously. On day 27, when everyone needs complete financial visibility at once, that demand becomes a production crisis. Database queries that complete in milliseconds during off-peak hours suddenly time out. Financial reports that should refresh in seconds hang for five minutes. Reconciliation queries fail halfway through. The finance team cannot complete the close on schedule because the system cannot keep up.

This is the moment when Business Central query performance matters most. And it is also the moment when most implementation teams realize they have not invested in understanding how queries actually execute in Business Central.

Why Business Central Queries Perform Differently Than You Expect

Business Central runs on SQL Server, so many developers assume SQL performance optimization principles apply directly. They do, partially. But Business Central query execution lives behind an abstraction layer. When you filter a page, call a report, or run a query in extension code, you are not writing SQL directly. Business Central translates your ODATA filters, FlowFields, and AL code into SQL queries. What gets sent to the database depends on that translation layer, and the translation is not always optimal.

Consider a simple scenario: you filter a sales invoice list by customer. A developer might write code to filter after fetching all records, thinking the database join is too complex to express. The query returns 50,000 records into memory, then filters them. A trained eye sees immediately that the filter should happen at the database layer, reducing the result set to perhaps 200 records before they ever arrive in Business Central. The performance difference is 250x. This exact mistake occurs thousands of times across Business Central implementations.

The problem compounds in month-end reporting. A typical month-end report might query general ledger transactions (2 million rows in a mature business), post analysis codes (100,000 reference rows), and departments (50 reference rows). If the query is poorly constructed, it performs a full table scan on the transaction table, joins against redundant reference data, and returns far more columns than needed. The query takes 90 seconds. A well-constructed query with proper indexing and column selection completes in three seconds. Month-end close suddenly compresses by two hours per person.

The Core Mechanics: Indexes, Table Buffers, and Filter Placement

Query performance in Business Central comes down to three foundational elements: whether the database has an index that satisfies the query, whether Business Central can use that index efficiently, and whether the query filters early enough to reduce the result set at the database layer.

Indexes are the first lever. Business Central tables ship with a predefined set of indexes optimized for common queries. When you query against an indexed column with a WHERE clause, SQL Server can seek directly to matching rows rather than scanning the entire table. A report that filters general ledger by posting date, cost center, and account number completes in milliseconds if an index exists on those three columns in that order. Without the index, the same query scans 500,000 rows. In a month-end environment running the same 20 reports concurrently, index presence determines whether close finishes in four hours or runs until next morning.

Custom indexes must be added thoughtfully. Too many indexes slow down writes (every INSERT and UPDATE must update every index). Too few indexes mean queries slow down. A mature Business Central implementation typically needs 2-4 additional custom indexes per table to handle reporting and consolidation workloads beyond the standard feature set.

Table buffers are the second lever. When you read a record from a Business Central table, the entire row is buffered into memory. If your code fetches a customer record to read a single field, Business Central still retrieves all columns. Custom fields increase buffer size. A table with 15 custom fields consumes 40 percent more memory per row than the same table with no custom fields. In a query loop reading 50,000 customer records to validate an address field, this overhead multiplies: instead of 10 MB of data, you transfer 14 MB. In a month-end consolidation reading millions of transaction records, the difference is gigabytes.

Column selection at the query stage prevents this waste. Instead of SELECT * FROM GL Entry, use SELECT GL Entry.Entry No., GL Entry.Posting Date, GL Entry.Amount, GL Entry.Global Dimension 1 Code. Only fetch the columns you need. In extension development, the FIELDS clause does this. In report writer, select specific columns in the dataset definition. This discipline alone cuts query time by 20-30 percent in reporting-heavy scenarios.

Filter placement is the third lever. A query that filters 500,000 rows into 10,000 results, then loops through those 10,000 to apply a second filter in code, is sending unnecessary data across the network. The filter should happen at the database layer. Business Central ODATA filters are translated into SQL WHERE clauses. A query that reads GL Entry WHERE Posting Date >= BeginDate AND Posting Date <= EndDate AND Account No. = AccountFilter filters at the database. A query that reads all GL Entries, then filters in code, does not. Proper filter placement combined with proper indexing converts a 60-second query into a 1.5-second query.

Preventing Timeout Failures During Peak Load

SQL Server timeouts are the visible symptom of performance problems during month-end close. The Business Central gateway enforces query timeouts (default 10-15 minutes for reporting queries, shorter for user-facing operations). In a scenario where 30 people simultaneously run the same report against the same month-end data, each person’s query competes for database resources. Queries that complete individually in 40 seconds might timeout in a contention scenario because they wait for lock releases from 29 other queries. A report that completes in 3 seconds completes for all 30 people concurrently.

Prevention requires both query tuning and load awareness. Query tuning uses the mechanics above: proper indexes, column selection, and filter placement. Load awareness means understanding your month-end peak: which reports run, how many users run them, and in what sequence. Some implementations stagger report execution (accounting runs consolidation first, then finance runs analysis). Others use scheduling to run heavy reports outside peak hours.

For query timeouts that persist despite tuning, Business Central extensions can implement result caching. A month-end consolidation report that takes 45 seconds can be run once after the close period closes, cached to a temporary table, and displayed instantly to 50 finance users without re-querying. This pattern trades freshness (the cache is one hour old) for performance (50 users × 45 seconds of database load becomes one execution + 50 × 0.1 second cache reads).

Implementation Pattern: Adding a Performance-Optimized Report

When building new reports for month-end use, follow this pattern: first, identify the data source and filters. A consolidation report might pull GL Entries, filter by posting period and company, and group by cost center. Second, write the query as a specific SELECT statement, not a wild SELECT *. Third, verify an index exists for your primary filter columns in that order. Fourth, fetch the data into a temporary table if the result set exceeds 10,000 rows, then display from the temp table. Fifth, add a cache check: if the report was run in the last hour, display the cached result instead of re-querying.

A report following this pattern completes for month-end close users in seconds rather than minutes, and enables concurrent execution without database contention.

Conclusion

Business Central query performance is not magic. It is a direct result of index design, column selection, and filter placement. Month-end close failures due to timeouts are not inevitable. They are symptoms of queries written without understanding how Business Central translates code into database execution. Implementation teams that invest in understanding these mechanics transform month-end close from a crisis into a managed event. Reporting completes reliably. Concurrent access does not create contention. Finance teams deliver close cycles that compress from 20 days to 12 days not through process optimization, but through technical infrastructure that actually scales to peak demand. That payoff justifies the focus on query performance in every Business Central implementation serving a business that grows.

#BusinessCentralPerformance #QueryOptimization #MonthEndClose #SQLPerformanceTuning #BusinessCentralDevelopment #SolutionArchitecture #DBOptimization #FinancialReporting

Optimizing Power BI Premium Capacity Management: Resource Allocation, Query Performance, and Cost Governance

Power BI Premium capacity management dashboard

Most organizations deploying Power BI Premium start with a single capacity and assume the cloud handles the complexity. Within months, they encounter the same problem: reports that were responsive at launch now run slowly, refresh jobs fail intermittently, and the monthly capacity bill climbs without corresponding value. The issue is rarely that Premium itself is insufficient; it is that few teams understand how Premium actually allocates compute, how to monitor that allocation in real time, and how to design workloads that fit the capacity constraints.

This is a technical guide for BI architects, developers, and capacity administrators who need to build production Power BI environments that deliver consistent performance and predictable costs. We will work through capacity planning, workload isolation, query optimization, and the operational patterns that prevent Premium environments from becoming expensive, unreliable systems.

Understanding Power BI Premium Capacity Architecture

Power BI Premium provides a dedicated cloud resource that isolates your organization’s workloads from the multi-tenant shared capacity used by Pro license users. That isolation is the primary value, but it also introduces responsibility: you now own the capacity planning, performance tuning, and cost management that shared capacity users delegate to Microsoft.

A Premium capacity is measured in compute units called virtual cores, or v-cores, priced in tiers from 1 core upward. Each v-core provides a fixed compute budget allocated across query execution, data refresh, and paginated reporting. The budget refreshes hourly. When workloads exceed that budget, Premium applies throttling: queries slow, refreshes delay or fail, and users experience degradation until the current hour’s budget resets.

This is not a failure mode; it is intentional. The throttling is meant to protect the capacity from runaway queries and ensure consistent service levels across all workloads sharing the same capacity. The problem occurs when capacity is undersized relative to the workload, or when workloads are poorly designed and consume disproportionate resources relative to their value.

Capacity Sizing and Workload Assessment

Build an honest inventory of what will run on the capacity. Most organizations plan around a single “average” workload size, then are shocked when peak usage overwhelms that estimate. A realistic approach profiles three scenarios: peak refresh, peak query, and a mixture of both.

Refresh costs depend on semantic model size, refresh frequency, and incremental refresh strategy. A 10 GB model refreshed hourly demands very different compute than a 1 GB model refreshed daily. Measure actual memory consumption and query duration during a test refresh, then multiply by expected concurrency during peak hours.

Query costs are driven by semantic model size, query complexity, and concurrent users. A simple filtered report consumes far less capacity than complex matrix visuals with millions of cross-filtered cells. DirectQuery and real-time data are more expensive than import mode. The capacity is effectively governed by the least-optimized workload; a single slow dashboard can trigger throttling affecting all operations.

Instrument capacity usage with Power BI’s Metrics app or Admin API, measure actual consumption over a production month, and size to the 95th percentile of observed usage, not the average. Most organizations reduce capacity cost by 20 to 40 percent by simply understanding what they actually use.

Workload Isolation and Semantic Model Design

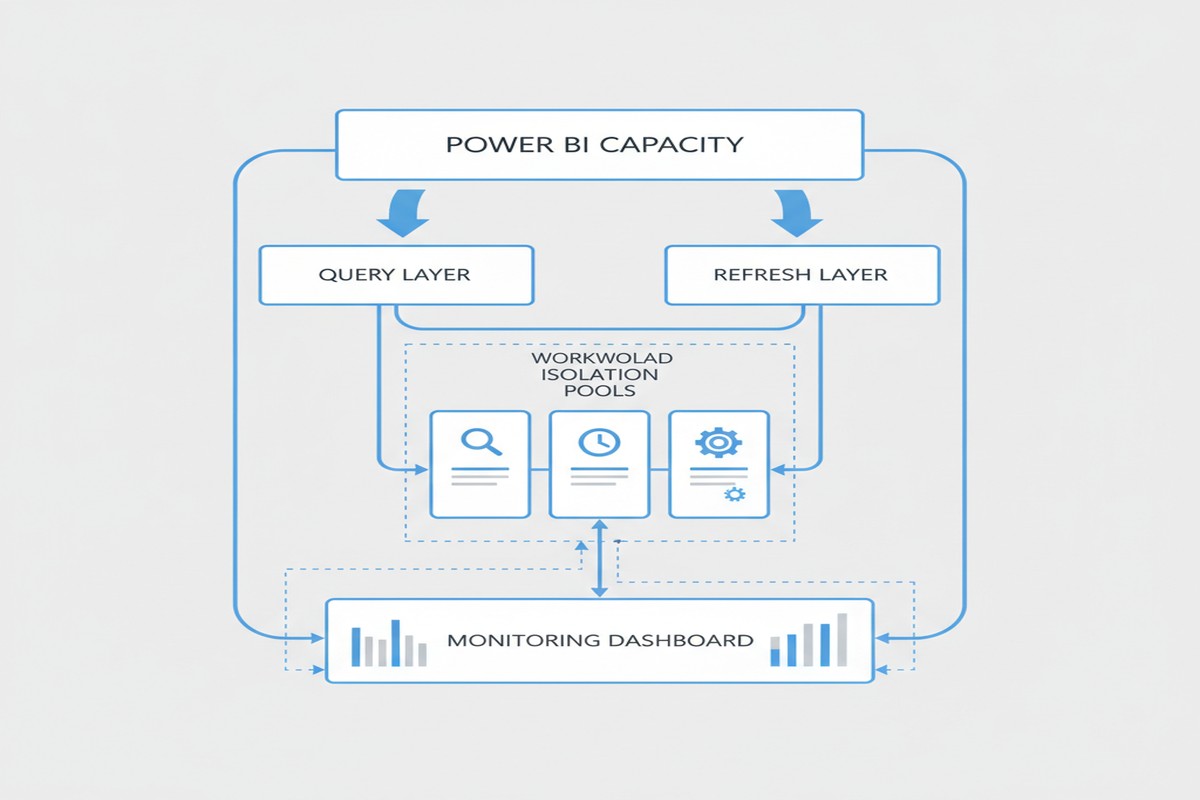
Premium capacity provides a feature called “workload isolation” that allows you to assign different workloads to separate compute pools with independent resource budgets. The most common pattern is to separate refresh workloads from query workloads, or to isolate a single expensive application from the rest of the organization’s reports.

At a technical level, workload isolation is effective because refresh and query operations compete for the same compute and memory on a shared capacity. During peak refresh hours, query performance degrades because the refresh jobs are consuming available vcore budgets. By isolating refresh into a dedicated workload with its own budget, you guarantee that queries will never starve, and vice versa.

Power BI capacity architecture and workload isolation

The decision to isolate workloads depends on whether the cost of isolation (you lose some capacity efficiency by dedicating separate resource pools) is outweighed by the benefit (guaranteed performance for critical queries or refreshes). For most organizations, a single isolated refresh workload is sufficient. Rarely do you need more than two or three workload isolations.

Semantic model design influences capacity efficiency dramatically. A single large model shared across many reports is more efficient than many small, redundant models duplicating the same dimensions and facts. However, large models are harder to maintain, permission, and optimize. Most organizations converge on a “hub-and-spoke” design: a small number of enterprise semantic models (3 to 6) owned by a central BI team, serving as the foundation for business-unit-specific reports and dashboards.

Query Optimization and Real-Time Analysis

Two mechanisms significantly impact capacity consumption: query folding in Power Query and relationship optimization in the semantic model.

Query folding pushes filter and aggregation operations down to the data source rather than pulling all data into Power BI for in-memory filtering. A properly folded query reduces data movement and memory consumption by orders of magnitude. The tradeoff is complexity: folded queries must be executable by the source system, ruling out some Python/R transformations.

For large data volumes or high refresh frequencies, investing in query folding often yields the highest return, reducing refresh time from hours to minutes and freeing up capacity for other workloads.

Relationship optimization includes careful cardinality settings, appropriate many-to-many relationships, and explicit measure branching. A model with thousands of ambiguous relationships forces Power BI to perform expensive relationship resolution on every query. Clean data models with clear relationships and explicit measures are far more efficient.

For real-time scenarios, DirectQuery and Push Datasets lower capacity consumption. DirectQuery queries the source directly but adds latency; the source must respond in hundreds of milliseconds. Push Datasets allow external systems to push data at API speeds, avoiding refresh windows entirely. Both require careful architecture to avoid swamping the data source.

Operational Monitoring and Cost Governance

Premium capacity consumption is measured via the Power BI Admin portal’s Metrics app and the Power BI API, which exposes activity logs and CPU/memory consumption by operation. The Admin API enables custom monitoring dashboards and automated alerting when thresholds are breached.

A mature Premium environment includes automated monitoring for capacity utilization trends, workloads consuming abnormal resources, failed refresh operations, and per-workload cost attribution enabling chargeback.

Governance practices include: quarterly capacity review boards, documented naming standards for models and reports, capacity impact assessment before onboarding new workloads, and performance SLAs backed by monitoring.

Organizations that skip this governance layer often find their Premium environment becomes a black box: costs rise unpredictably and performance degrades without clear cause. Operational tooling and governance practices pay for themselves many times over.

Common Pitfalls and Practical Next Steps

The most common mistakes are: sizing capacity based on theoretical maximum load rather than measured reality, allowing unoptimized queries and large unfolded data imports to run without constraint, mixing enterprise semantic models with personal workloads on the same capacity, and ignoring refresh scheduling and allowing refreshes to overlap.

The path forward is straightforward: measure actual consumption with the Metrics app or Admin API over a production month, document the peak periods and peak workloads, assess which workloads could be optimized with query folding or model redesign, and then right-size the capacity and implement workload isolation for any critically important refresh or query workload. Follow up monthly with utilization reviews and alert on workloads that consume anomalously high resources.

For teams implementing Premium for the first time, a pragmatic starting point is often a single 2 or 4 vcore capacity, one workload isolation for refreshes, and a simple monitoring dashboard tracking hourly utilization. From there, optimization and growth are data-driven: measure, identify bottlenecks, optimize, and only increase capacity when the measured peak approaches the capacity ceiling. Organizations that follow this pattern consistently report 30 to 50 percent lower costs than those that simply throw capacity at performance problems without understanding the underlying workload characteristics.


Routeget Technologies has guided dozens of organizations through Premium capacity design and optimization, from initial sizing through multi-capacity deployments with sophisticated governance. If your Premium environment is facing performance challenges or cost surprises, the root cause is almost always visibility and deliberate design, not capacity limitations.


#PowerBIPremium #CapacityManagement #DataLakeArchitecture #QueryOptimization #PowerBIGovernance #EnterpriseBI #DataEngineering