Optimizing Query Performance in Business Central: Preventing Reporting Timeouts in Month-End Closing and Financial Analysis

Optimizing Query Performance in Business Central: Preventing Reporting Timeouts in Month-End Closing and Financial Analysis

The month-end close in a mid-market manufacturer typically means dozens of finance teams running overlapping reports, consolidation queries, and analytical dashboards simultaneously. On day 27, when everyone needs complete financial visibility at once, that demand becomes a production crisis. Database queries that complete in milliseconds during off-peak hours suddenly time out. Financial reports that should refresh in seconds hang for five minutes. Reconciliation queries fail halfway through. The finance team cannot complete the close on schedule because the system cannot keep up.

This is the moment when Business Central query performance matters most. And it is also the moment when most implementation teams realize they have not invested in understanding how queries actually execute in Business Central.

Why Business Central Queries Perform Differently Than You Expect

Business Central runs on SQL Server, so many developers assume SQL performance optimization principles apply directly. They do, partially. But Business Central query execution lives behind an abstraction layer. When you filter a page, call a report, or run a query in extension code, you are not writing SQL directly. Business Central translates your ODATA filters, FlowFields, and AL code into SQL queries. What gets sent to the database depends on that translation layer, and the translation is not always optimal.

Consider a simple scenario: you filter a sales invoice list by customer. A developer might write code to filter after fetching all records, thinking the database join is too complex to express. The query returns 50,000 records into memory, then filters them. A trained eye sees immediately that the filter should happen at the database layer, reducing the result set to perhaps 200 records before they ever arrive in Business Central. The performance difference is 250x. This exact mistake occurs thousands of times across Business Central implementations.

The problem compounds in month-end reporting. A typical month-end report might query general ledger transactions (2 million rows in a mature business), post analysis codes (100,000 reference rows), and departments (50 reference rows). If the query is poorly constructed, it performs a full table scan on the transaction table, joins against redundant reference data, and returns far more columns than needed. The query takes 90 seconds. A well-constructed query with proper indexing and column selection completes in three seconds. Month-end close suddenly compresses by two hours per person.

The Core Mechanics: Indexes, Table Buffers, and Filter Placement

Query performance in Business Central comes down to three foundational elements: whether the database has an index that satisfies the query, whether Business Central can use that index efficiently, and whether the query filters early enough to reduce the result set at the database layer.

Indexes are the first lever. Business Central tables ship with a predefined set of indexes optimized for common queries. When you query against an indexed column with a WHERE clause, SQL Server can seek directly to matching rows rather than scanning the entire table. A report that filters general ledger by posting date, cost center, and account number completes in milliseconds if an index exists on those three columns in that order. Without the index, the same query scans 500,000 rows. In a month-end environment running the same 20 reports concurrently, index presence determines whether close finishes in four hours or runs until next morning.

Custom indexes must be added thoughtfully. Too many indexes slow down writes (every INSERT and UPDATE must update every index). Too few indexes mean queries slow down. A mature Business Central implementation typically needs 2-4 additional custom indexes per table to handle reporting and consolidation workloads beyond the standard feature set.

Table buffers are the second lever. When you read a record from a Business Central table, the entire row is buffered into memory. If your code fetches a customer record to read a single field, Business Central still retrieves all columns. Custom fields increase buffer size. A table with 15 custom fields consumes 40 percent more memory per row than the same table with no custom fields. In a query loop reading 50,000 customer records to validate an address field, this overhead multiplies: instead of 10 MB of data, you transfer 14 MB. In a month-end consolidation reading millions of transaction records, the difference is gigabytes.

Column selection at the query stage prevents this waste. Instead of SELECT * FROM GL Entry, use SELECT GL Entry.Entry No., GL Entry.Posting Date, GL Entry.Amount, GL Entry.Global Dimension 1 Code. Only fetch the columns you need. In extension development, the FIELDS clause does this. In report writer, select specific columns in the dataset definition. This discipline alone cuts query time by 20-30 percent in reporting-heavy scenarios.

Filter placement is the third lever. A query that filters 500,000 rows into 10,000 results, then loops through those 10,000 to apply a second filter in code, is sending unnecessary data across the network. The filter should happen at the database layer. Business Central ODATA filters are translated into SQL WHERE clauses. A query that reads GL Entry WHERE Posting Date >= BeginDate AND Posting Date <= EndDate AND Account No. = AccountFilter filters at the database. A query that reads all GL Entries, then filters in code, does not. Proper filter placement combined with proper indexing converts a 60-second query into a 1.5-second query.

Preventing Timeout Failures During Peak Load

SQL Server timeouts are the visible symptom of performance problems during month-end close. The Business Central gateway enforces query timeouts (default 10-15 minutes for reporting queries, shorter for user-facing operations). In a scenario where 30 people simultaneously run the same report against the same month-end data, each person’s query competes for database resources. Queries that complete individually in 40 seconds might timeout in a contention scenario because they wait for lock releases from 29 other queries. A report that completes in 3 seconds completes for all 30 people concurrently.

Prevention requires both query tuning and load awareness. Query tuning uses the mechanics above: proper indexes, column selection, and filter placement. Load awareness means understanding your month-end peak: which reports run, how many users run them, and in what sequence. Some implementations stagger report execution (accounting runs consolidation first, then finance runs analysis). Others use scheduling to run heavy reports outside peak hours.

For query timeouts that persist despite tuning, Business Central extensions can implement result caching. A month-end consolidation report that takes 45 seconds can be run once after the close period closes, cached to a temporary table, and displayed instantly to 50 finance users without re-querying. This pattern trades freshness (the cache is one hour old) for performance (50 users × 45 seconds of database load becomes one execution + 50 × 0.1 second cache reads).

Implementation Pattern: Adding a Performance-Optimized Report

When building new reports for month-end use, follow this pattern: first, identify the data source and filters. A consolidation report might pull GL Entries, filter by posting period and company, and group by cost center. Second, write the query as a specific SELECT statement, not a wild SELECT *. Third, verify an index exists for your primary filter columns in that order. Fourth, fetch the data into a temporary table if the result set exceeds 10,000 rows, then display from the temp table. Fifth, add a cache check: if the report was run in the last hour, display the cached result instead of re-querying.

A report following this pattern completes for month-end close users in seconds rather than minutes, and enables concurrent execution without database contention.

Conclusion

Business Central query performance is not magic. It is a direct result of index design, column selection, and filter placement. Month-end close failures due to timeouts are not inevitable. They are symptoms of queries written without understanding how Business Central translates code into database execution. Implementation teams that invest in understanding these mechanics transform month-end close from a crisis into a managed event. Reporting completes reliably. Concurrent access does not create contention. Finance teams deliver close cycles that compress from 20 days to 12 days not through process optimization, but through technical infrastructure that actually scales to peak demand. That payoff justifies the focus on query performance in every Business Central implementation serving a business that grows.

#BusinessCentralPerformance #QueryOptimization #MonthEndClose #SQLPerformanceTuning #BusinessCentralDevelopment #SolutionArchitecture #DBOptimization #FinancialReporting

Embedded Power BI Dashboards: How Finance Leaders Cut Reporting Overhead While Accelerating Month-End Close

Embedded Power BI Dashboards: How Finance Leaders Cut Reporting Overhead While Accelerating Month-End Close

Finance leadership today faces a classic constraint: stakeholders demand more visibility, faster. They want to see cash positions, budget variance, and revenue forecasts updated daily, not monthly. They want drill-down capability on expense categories without submitting a request to the finance team and waiting for an analyst to build a pivot table in Excel. They want stakeholder-specific views that show what matters to each leader, not generic standardized reports that require interpretation. Meanwhile, the finance team is already stretched. Month-end close still takes two to three weeks even with modern ERP systems. The reporting burden makes it worse. Building custom reports for every leader’s ad-hoc question pulls analysts away from close activities, reconciliation, and forecast refinement. More reporting requests mean slower close, which means later decision-making, which cascades through the entire organization as downstream teams wait for quarterly numbers to plan operations and adjust spend.

The traditional response has been to hire more analysts. But analysts are expensive, hard to find, and they spend 60% of their time on report maintenance and one-off requests rather than on analysis that drives business decisions. The real solution is embedding analytics directly into the applications and workflows where finance leaders actually work: not a separate analytics portal they have to log into and navigate, but real-time dashboards built into their daily tools, dashboards that self-serve without handoffs to the finance team.

Power BI embedded analytics, paired with Dynamics 365 Finance, solves this problem at scale. Embedding Power BI dashboards directly into finance applications reduces the reporting overhead on the finance team, accelerates decision-making by putting data in leaders’ hands immediately, and compresses month-end close cycles by automating report production and eliminating manual consolidation.

Why Traditional Reporting Breaks At Scale

Most organizations handle financial reporting as a batch process built around the month-end close. Throughout the month, finance teams collect data, reconcile accounts, and close subledgers. On the last day of the month, reporting begins. Consolidated financial statements are produced (usually manually or with macro-heavy Excel workbooks). Variance reports are built comparing actual to budget. Divisional reports are rolled up. By month-end close day plus five to seven days, the first version of financial results is delivered. Any corrections or recalculations can push that to two weeks or more.

During that window, executives are waiting. Operations teams cannot finalize their monthly spend analysis. Finance business partners cannot answer the CEO’s questions about Q3 close timing or year-end forecast precision. Board-level reporting cannot be completed. The entire organization is in a holding pattern while the finance team manually produces reports.

The problem multiplies with each new stakeholder or report request. Every executive wants a customized view. Every division wants its own reporting dashboard. Every business partner wants to drill into the numbers. The finance team becomes a custom reporting factory, producing one-off reports on demand, maintaining hundreds of Excel files, and spending hours on report refreshes and error correction instead of on financial analysis and close process improvement.

The Embedded Analytics Advantage

Power BI embedded analytics changes this structure. Instead of producing reports on demand, you build the data model once: connect Power BI to your Dynamics 365 Finance database, define the key financial dimensions (cost center, department, business unit), and create visualizations of the metrics that matter (revenue, spend, headcount, margin). Those visualizations live in Power BI. Then you embed them directly into Dynamics 365 Finance workspaces, SharePoint sites, or custom applications where finance teams and business partners spend their time daily. The result is real-time visibility without handoffs.

When an executive logs into Dynamics 365 Finance or opens their finance workbench, they see embedded dashboards showing cash position, revenue trends, expense variance, and budget status updated hourly, not monthly. When a business partner needs to understand why Q3 spending was 15% over budget, they can click into the embedded dashboard, filter by cost center, and see the breakdown in seconds. No request to the finance team. No waiting for an analyst to build a report. The analytics answer the question immediately.

For month-end close, embedded analytics compresses the cycle dramatically. Instead of closing the month manually and then producing reports, you close the month in your ERP, and financial dashboards update automatically. Consolidation reports that once required manual Excel work are now automated queries against the consolidated data model. Variance analysis that required comparing separate actuals and budget spreadsheets is now a single interactive dashboard. Closing time drops from 15-21 days to 8-10 days for many organizations.

Real Business Impact: A Working Example

Consider a mid-market manufacturing company with 12 divisions, each with its own PCONTENT_PLACEHOLDERL and spending pattern. Historically, close took 18 days. Days 1-10 were subledger close and reconciliation across divisions. Days 11-15 were consolidation and financial statement production. Days 16-18 were divisional reporting and variance analysis. By day 18, results were available, but the revenue and expense details needed for business partner decisions (pricing adjustments, spending reductions, staffing plans) were still stuck in divisional Excel files, requiring manual aggregation.

After implementing embedded Power BI, close structure changed. Subledger close still takes 10 days (that is systems integration and reconciliation, hard to accelerate further). But consolidation dropped from 5 days to 1 day because consolidation formulas were automated in the data model. Divisional reporting, which historically took 3-5 days (building separate Excel files for each division, reviewing for errors, reconciling to consolidated totals), now takes 2 hours because divisional dashboards update from the consolidated data model automatically. The result: 12-day close instead of 18. For the CFO, that means board-ready numbers on day 12 instead of day 18. For business partners, it means drill-down insight into their division’s performance available the same day close finishes, rather than waiting another week for divisional reports to be reviewed and validated.

Cost savings are equally tangible. Two FTEs in the reporting group were allocated to ongoing report maintenance and variance analysis. With embedded analytics, they shifted to analytics and forecasting work, high-value activity the organization was previously skipping because reporting overhead consumed all available capacity. Headcount did not increase, but analysis capability did.

Implementation Approach and Considerations

Embedded Power BI works best when you start with Dynamics 365 Finance as the source system. Data models should follow financial dimensions: legal entity, cost center, account, project, customer. Relationships between these dimensions let you drill from consolidated view down to transaction detail. Filter security built into Power BI ensures each leader sees only the divisions and cost centers they are accountable for.

The first phase typically focuses on month-end and close reporting: variance analysis, expense breakdown, budget tracking, revenue trends. These are the highest-value reports, the ones that currently consume the most finance team time. After phase one, the model expands to operational reporting: headcount tracking, project profitability, customer profitability, cash flow forecasting.

One critical success factor: data governance. Embedded analytics expose financial data directly to users without the filter of a formal report. That means the underlying data must be clean, reconciled, and trustworthy. If a user sees two different revenue numbers depending on which dashboard they are looking at, embedded analytics loses credibility quickly. Before embedding, invest in data quality validation and reconciliation automation in Dynamics 365 Finance itself. Poor data upstream shows up immediately in downstream analytics.

Another consideration: adoption. Embedding dashboards is not the same as ensuring they are used. Teams accustomed to receiving reports on their schedule may need coaching to self-serve analytics. Start with finance teams and business partners most motivated to shift from pull-based reporting to push-based insights. Demonstrate value in their workflows. As adoption spreads and teams see the benefit (faster close, better decision-making, fewer hours spent on report requests), adoption accelerates organically.

The Financial Impact: Time and Cost

A typical organization with 10-30 finance staff, closing 100M-500M in annual revenue, can expect two concrete outcomes from embedded Power BI analytics. First, close cycle compression of 25-40% (5-7 days saved in a 15-21 day close). Second, 1-2 FTE equivalent of reporting overhead eliminated, capability redirected to forecasting, analysis, and process improvement. For a mid-market organization, that is 100K-150K in freed capacity and 5-7 days of earlier financial close, both with meaningful business impact.

The investment required is modest by comparison. A Power BI embedded analytics project typically costs 60K-120K depending on complexity and data model size, delivered over 4-6 months. ROI is positive within the first year for most organizations through close-time savings and freed analyst capacity, with benefits growing as adoption spreads and the data model expands beyond financial close to operational analytics.

For finance leaders evaluating whether embedded analytics is worth the investment, the question is not whether you can afford it. The question is whether you can afford not to. Month-end close is a bottleneck that propagates across the organization. Every day shaved from close means decisions get made faster, plans get finalized faster, and the business moves with better precision. Embedded analytics is the mechanism that makes that acceleration possible without adding headcount.

Routeget Technologies helps organizations architect and implement embedded Power BI solutions within Dynamics 365 Finance, compressing close cycles and enabling finance leaders to operate with real-time visibility into financial performance and spend dynamics.


#PowerBIEmbedded #FinancialReporting #DashboardAnalytics #MonthEndClose #FinanceAnalytics #DataVisualization

Business Central’s Multi-Entity Consolidation: Automating Intercompany Eliminations and Accelerating Month-End Close Cycles

For finance leaders managing consolidated operations across multiple subsidiaries or business units, month-end close becomes exponentially more complex. Intercompany transactions multiply, elimination entries compound, and the coordination overhead among regional accounting teams can extend close cycles by days or even weeks. Business Central’s consolidation capabilities address this directly, turning what is traditionally a manual, error-prone process into a structured, repeatable workflow that reduces timeline pressure and audit risk.

The consolidation challenge in multi-entity environments stems from a fundamental accounting requirement: intercompany transactions must be eliminated from consolidated financial statements to avoid double-counting revenue, expenses, and balances. When subsidiary companies sell to each other, make loans, or share service costs, those internal transfers appear in each entity’s books but must net to zero at the consolidated level. Organizations relying on spreadsheets or manual journal entry processes spend days tracking down which transactions crossed between entities, calculating elimination amounts, and coordinating with multiple accounting teams to ensure each entity’s close is complete before consolidation can begin.

Business Central’s built-in consolidation engine simplifies this by allowing organizations to define intercompany relationships and elimination rules once, then apply them systematically across all monthly close cycles. The result is not just faster close timelines, but higher accuracy and auditability, since every elimination step is documented within the system rather than buried in email chains or spreadsheets.

Setting Up Multi-Entity Relationships

The foundation of Business Central consolidation is the ability to identify which company units participate in consolidation and how they relate to each other. In Business Central, each entity is typically a separate company database, though some organizations implement consolidation across multiple business units within a single company using dimension-based structures. The consolidation process begins by designating one company as the parent and establishing relationships with subsidiaries or operating units. This relationship structure becomes the roadmap for both data collection and elimination logic.

Business Central allows you to define these relationships through the Consolidation Setup and Elimination Rules interfaces. You specify which companies feed data into the consolidated view, whether transactions between those entities should be fully or proportionally eliminated, and what account mappings apply. For organizations with joint ventures or partially-owned entities, this flexibility matters: you can configure proportional consolidation so that an 80 percent-owned subsidiary contributes only its 80 percent portion of assets and liabilities to the consolidated balance sheet, while the minority interest appears as a separate line item.

The account mapping layer is critical because consolidated financial statements often require accounts from subsidiary companies to be remapped or reclassified before they roll up to the parent consolidated general ledger. Business Central’s mapping rules allow you to specify that subsidiary Account 1234 (Local Intercompany Revenue) should consolidate as Account 5001 (Consolidated Service Revenue) in the parent, which streamlines both data integrity and reporting consistency. Many organizations spend weeks manually reformatting subsidiary trial balances to fit corporate reporting structures, but Business Central eliminates that step by automating the mapping during consolidation.

Automating Intercompany Elimination Entries

The heart of the consolidation process is the elimination of intercompany balances. When subsidiary A sells goods to subsidiary B, both companies record transactions: subsidiary A books revenue and receivables; subsidiary B books an expense and payables. At consolidation, these must be eliminated so the consolidated income statement doesn’t overstate revenue or expenses, and so the consolidated balance sheet doesn’t carry duplicate receivables and payables for the same transaction.

Business Central automates this by allowing you to define elimination rules based on account pairs and dimensions. You can specify, for example, that any balance in Account 1200 (Intercompany Receivables) in the subsidiary should be eliminated against a matching balance in Account 2200 (Intercompany Payables) in the parent, or vice versa. The system can also handle more complex scenarios: if subsidiaries buy and sell from each other in a triangular relationship, you define rules that capture each pair of transactions and eliminate them systematically.

The elimination engine runs during the consolidation process, creating elimination entries that net intercompany balances. These entries are recorded within Business Central itself rather than exported to Excel or a separate consolidation tool, which means finance leaders can trace the elimination history, adjust individual eliminations if needed, and generate audit reports showing exactly which transactions were eliminated and why. For organizations that previously managed eliminations through manual spreadsheet reconciliation, this shift to system-based tracking eliminates one of the largest sources of month-end errors and audit concerns.

Consolidation Workflows and Timeline Acceleration

One of the most tangible benefits of Business Central consolidation is the ability to run a structured, repeatable close workflow. Instead of waiting for all subsidiaries to report their closes before beginning manual elimination work, the consolidation process can begin as soon as preliminary subsidiary data is available. Many organizations configure a two-phase close: in Phase One, subsidiaries submit preliminary closes and Business Central generates initial consolidation numbers and preliminary elimination reports. Finance teams review these and request adjustments if needed. In Phase Two, after final subsidiary closes are confirmed, the consolidation is rerun, and the consolidated financials are locked.

This two-phase approach compresses the overall timeline because you identify and resolve intercompany issues earlier rather than discovering them only after the subsidiary closes are supposedly final. It also gives finance leaders visibility into consolidated results days earlier, allowing them to brief the CFO or investor relations team on preliminary numbers while detailed reconciliation continues in the background. Organizations with complex consolidations frequently report that this visibility window alone justifies the consolidation system investment, as it reduces the stress of final-day scrambles to complete consolidated reporting.

Data Integrity and Audit Trail

A secondary but equally important benefit is the audit trail. Regulatory bodies and auditors expect to see documented evidence of how intercompany transactions were identified and eliminated. Spreadsheet-based consolidation processes generate no audit trail; changes are invisible, and it’s difficult to prove that eliminations were appropriate and complete. Business Central’s consolidation functionality records each elimination entry, the rule that triggered it, and the date and user who approved the consolidation run. This documentation directly supports financial audits and regulatory compliance, and it eliminates the common scenario where auditors request detail on a consolidation elimination, and the finance team must scramble to reconstruct the logic from scattered emails or deleted spreadsheet versions.

Implementation Considerations and Best Practices

Organizations moving to Business Central consolidation should anticipate a few practical decisions. First, does your consolidation structure map neatly to Business Central’s company model, or will you need to use dimensions or manual adjustments to capture some relationships? Second, do you have intercompany pricing disputes or approval workflows that must occur before eliminations are finalized? Third, what reporting format do regulators or corporate require, and does Business Central’s consolidation output generate the required schedules natively or with manual tailoring?

Most organizations find that consolidation savings justify a focused implementation effort. A three-subsidiary consolidation that previously took 8 to 10 days typically compresses to 4 to 5 days; larger multi-subsidiary operations see proportionally larger gains, especially as the consolidation becomes routine and refinements are made over the first two to three cycles. Performance improves even further when you build business logic that prevents intercompany transactions from being recorded incorrectly in the first place, such as using intercompany purchase/sales order workflows with built-in validation that ensures subsidiary A’s order to subsidiary B matches subsidiary B’s receipt and supplier invoice.

Practical Path Forward

For finance leaders evaluating Business Central or preparing for a consolidation implementation, the starting point is a clear map of your intercompany relationships and current elimination volumes. Work with your implementation partner to quantify the current cost of manual consolidation: time spent, error correction, audit workload, and management time resolving reconciliation issues. Model how Business Central’s consolidation features reduce that cost. Most implementations recover their investment within the first year through close timeline reduction and reduced month-end overtime. Beyond the first year, the ongoing benefit is consistent month-end cycles and improved visibility to consolidated results early in the close window, enabling faster strategic decision-making at the board and investor-communication level.


About Routeget Technologies: Routeget Technologies specializes in Dynamics 365 and Microsoft Power Platform implementations for mid-market and enterprise organizations. Our finance operations consultants have guided multi-subsidiary consolidation implementations across diverse industries, and we understand both the technical configuration and the change management required to shift from manual to system-driven month-end close processes.

#BusinessCentralConsolidation #MonthEndClose #IntercompanyElimination #FinanceOperations #MultiEntityAccounting #FinancialConsolidation

Dynamics 365 Finance Month-End Close: Why Manual Review Processes Eat Three Weeks of Your Finance Team’s Time

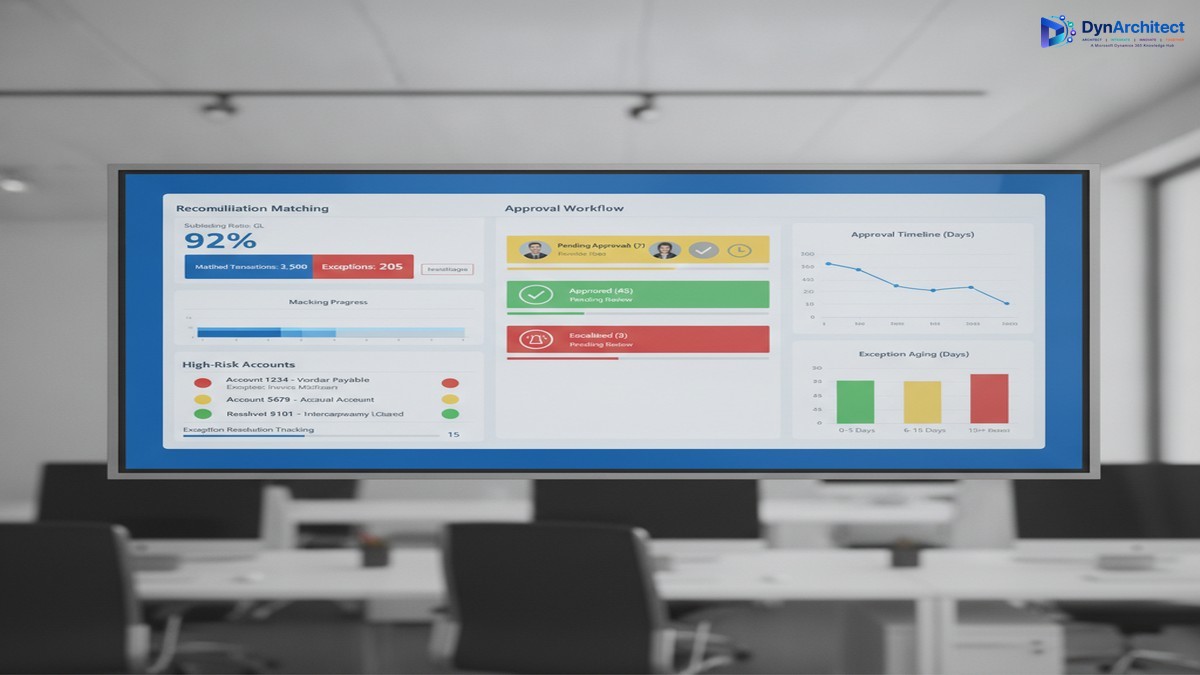
Dynamics 365 Finance month-end close dashboard with reconciliation and approval workflows

Your CFO expects the month-end close to take five business days. Your finance team knows it will take at least three weeks, if nothing breaks. Neither estimate is wrong, but the gap between them exposes a concrete operational problem that Dynamics 365 Finance can address—if you design the close process deliberately rather than simply importing Excel workflows into a new system.

The root cause isn’t Dynamics 365 Finance’s fault. It’s that most organizations have never mapped the actual work their finance team performs during month-end close, and they transfer that unmapped work directly into D365 Finance, where the same manual reviews and exception-handling steps consume the same time, just now in a new interface. This article walks through the hidden work that extends close cycles and the specific D365 Finance capabilities that can compress it without sacrificing control.

The Hidden Work in Month-End Close

Finance teams perform three categories of work during month-end close: transactional, reconciliation, and review and approval. The first category moves quickly in Dynamics 365 Finance because transactional posting, reversal, and period closing are automated. The second category, reconciliation, is where most organizations find that D365 Finance has given them new tools but not a fundamentally different process. The third category, review and approval, is where the real bottleneck sits.

Reconciliation requires matching subledger balances to the general ledger and resolving differences. In Excel, this meant exporting general ledger data to a spreadsheet, exporting subledger data to another spreadsheet, and then manually or with crude formulas, finding and categorizing exceptions. In Dynamics 365 Finance, you have automated reconciliation matching, but it still requires manual exception review if a transaction doesn’t auto-match due to timing, rounding, or data misalignment. Many organizations don’t implement the reconciliation matching engine at all, and instead build custom reconciliation reports that they then export and manually review in Excel. That defeats the purpose. Organizations that do implement reconciliation matching still need a process to review and approve the remaining exceptions. If your exception resolution process is ad-hoc (email threads, informal approvals, updates made directly to the database by whoever has time), month-end close becomes a game of whack-a-mole where resolving one exception creates new work elsewhere.

The review and approval stage is where time collapses. At this stage, the close is technically complete from a system perspective—all journal entries have posted, all subledgers have been reconciled, and all accounts have been reviewed—but finance leadership has not yet signed off. This is where your CFO’s five-day close hits the wall. The approval process usually means compiling reports, distributing them via email, waiting for responses, and manually tracking who has signed off and who is still reviewing. If a reviewer finds an error, the journal entry gets reversed, the approver list gets longer, and the cycle starts again. If multiple reviewers work simultaneously without a structured change-control process, they may unknowingly create conflicting updates.

Dynamics 365 Finance month-end close dashboard with reconciliation and approval workflows

Why Dynamics 365 Finance’s Tools Don’t Automatically Solve This

Dynamics 365 Finance has features that address each of these stages. It has reconciliation matching for subledger-to-GL matching. It has a journal approval workflow that routes entries to approvers. It has role-based security so that only authorized users can post to specific accounts or cost centers. But implementing these features doesn’t automatically translate to a faster close if the underlying process is not designed first.

The most common implementation pattern is this: the team implements D365 Finance features directly as they exist, with minimal process redesign. The reconciliation matching engine gets enabled but with no workflow for resolving exceptions. The journal approval workflow gets configured but with a long approval chain that mirrors the existing email-based approval process—five to ten approvers in sequence, each seeing the full entry list and taking days to respond. The role-based security gets configured but not used strategically to separate data entry from approval, so reviewers still spend time wading through draft entries they didn’t create.

The result is that Dynamics 365 Finance executes the existing process more efficiently at the transactional level but doesn’t reduce the actual elapsed time, because the transactional work was never the bottleneck. The bottleneck is the manual review and approval stage.

Structural Changes That Compress the Close Without Cutting Corners

Three structural changes to your close process, combined with deliberate use of D365 Finance features, can reduce elapsed close time from three weeks to ten to twelve business days while improving control and auditability.

The first change is to separate data entry from approval. Assign data entry (journal posting, subledger reconciliation, exception resolution) to one team and approval to another team that has not touched the data being approved. This isn’t a new idea, but Dynamics 365 Finance makes it operationally feasible. Your reconciliation team can mark exceptions as resolved in the reconciliation matching workspace, but the approval team (the controller, the finance director, or a designated approval group) can see which exceptions were resolved and review them before the general ledger is locked. By structuring permissions so that data entry users cannot post approved entries directly, and approval users see only high-level summaries plus exceptions, you cut the time approvers spend searching for relevant data. A 30-minute approval review of 500 transactions becomes a 10-minute review of 12 exceptions.

The second change is to compress the approval chain. Instead of sequential approval (entry review by the subledger owner, then the cost center manager, then the controller, then the finance director), design approval stages in parallel when possible and in short sequence when approval must be serial. Most organizations can reduce approval stages from five to three without sacrificing control. The subledger owner approves their subledger reconciliation in the reconciliation workspace. The controller approves all entries and reconciliation exceptions at once, using a dashboard that shows high-risk accounts and exceptions flagged by the reconciliation matching engine. The CFO reviews a summary and sign-off letter rather than individual entries. This parallel-where-possible, serial-only-where-necessary structure typically reduces approval cycle time from eight to ten days to two to four days.

The third change is to automate exception escalation. If an exception is not resolved within a specific time window (for example, three days after period end), Dynamics 365 Finance can send an automated alert to the responsible approver. This prevents exceptions from sitting in a queue and blocking closure. The escalation alert also creates an audit trail—it records when the exception was identified, when the alert was sent, and when it was finally resolved. This audit trail is exactly what your auditors want to see, and it removes the need for a manual exception log that has historically been built in Excel and updated sporadically.

The Realistic Implementation Timeline

These changes require careful process design before the configuration work begins. A typical implementation that adds close-process automation to an existing D365 Finance deployment takes three to four months. The first month is spent mapping current close processes, identifying where exceptions occur most often, and defining the data risk thresholds that trigger approval. The second month is spent building the reconciliation matching rules, configuring the approval workflow, and setting up the exception escalation alerts. The third month is spent running parallel close cycles (the old manual process running alongside the new D365 Finance process) so your finance team can validate that nothing is being missed. The month-end close itself becomes faster immediately, but the real efficiency gain comes in the fourth and fifth close cycles, after your team is comfortable with the new workflow.

The cost of this implementation is not primarily in configuration—it’s in the time your finance team spends away from month-end close activities while the process is being redesigned and validated. Expect to allocate one senior accountant and one finance operations person for two to three months. Expect also that your close process will feel slower for the first month or two after go-live, because your team is learning new workflows and validating that every exception has been captured and resolved. This is normal, and it is not a sign that the implementation has failed.

Making the Business Case to Leadership

The case for process redesign around month-end close is straightforward for a CFO: it frees up your most experienced team members from manual review work so they can focus on analysis, forecasting, and planning. It compresses the time it takes to close the books, which gives leadership three extra weeks per quarter to make decisions based on actual financial results rather than waiting for the close to complete. It creates an audit trail for month-end close activities, which strengthens your internal control environment and simplifies external audits. It reduces the error rate in close processes because exception resolution is now tracked and validated rather than handled ad-hoc.

The cost is three to four months of implementation effort plus the finance team’s time during the redesign phase. The benefit is a close process that runs three to four days faster and a finance team that spends ten to twelve fewer days per month on manual reconciliation and approval work. Over the course of a year, that’s enough time for your finance team to take on strategic work that they couldn’t fit before.

Month-end close doesn’t have to be a three-week sprint every month. It can be a structured, partially automated process that your finance team completes in two to three weeks while also having time to analyze variances and support the business. The tooling exists in Dynamics 365 Finance. The missing piece is usually a deliberate process design that aligns the close workflow with your organization’s risk tolerance and approval structure.


About Routeget Technologies: Routeget Technologies helps mid-market and enterprise organizations streamline financial operations with Dynamics 365 Finance. If your finance team’s close process is consistently running longer than expected, contact us for a process assessment that identifies where Dynamics 365 Finance can reduce manual work without cutting corners on control.

#DynamicsFinance #MonthEndClose #FinanceTransformation #FinanceOperations #CFOStrategy #DynamicsImplementation

Configuring Financial Report Packages for Month-End Distribution in Business Central

Finance controller reviewing a bundled financial report dashboard during month-end close

A controller at a mid-market manufacturer spends the first three days of every close cycle doing something that has nothing to do with accounting: assembling a stack of PDFs. The profit and loss statement goes to the executive team. The balance sheet and a G/L detail extract go to the audit committee. A budget variance report goes to department heads, each filtered to their own cost center. In Business Central, every one of those documents has lived as its own Financial Report, generated and distributed on its own schedule, which means close week turns into a sequence of separate print jobs, separate emails, and separate chances to send the wrong version to the wrong list.

That specific problem, bundling several financial statements into one coherent, schedulable output, is what Financial Report Packages address in Business Central 2026 release wave 2. The feature landed in the update 29.0 public preview in September 2026, and it is worth understanding now, while it is still confined to sandbox environments, so that the rollout plan for general availability in October is already written by the time the feature reaches production.

Finance controller reviewing a bundled financial report dashboard during month-end close

What changed, and what didn’t, in wave 1

It helps to be precise about what already existed before this. Business Central 2026 release wave 1 (BC28) gave Financial Reports scheduling for the first time. Before BC28, a Financial Report could only be printed on demand; there was no way to have it generate and land in an inbox automatically. Wave 1 fixed that at the level of a single report: from the Financial Reports page or the Financial Report Card, the Schedules action let you configure a code, a description, an “Export to PDF” or “Send Email” option, a list of recipients pulled from User Setup email addresses, a Next Run Date/Time, and a Recurrence Run Date Formula. Each scheduled run created a Financial Report Export Job entry in Job Queue Entries, and you could stack multiple schedules against the same report if different audiences needed it at different cadences.

That was genuine progress, but it left the packaging problem untouched. A controller with five statements to distribute still needed five schedules, five separate emails landing in five separate messages, and no guarantee they arrived in a sequence or format anyone downstream found usable. Wave 1 solved recurrence. It didn’t solve composition.

How Financial Report Packages work

Financial Report Packages, new in the 29.0 preview, introduce a container object that sits above individual Financial Reports rather than replacing them. You reach it either through Tell Me by searching “Financial Report Packages” or via a Packages action on the Financial Reports page itself. Creating a package starts with a header record (the Financial Report Package table, internally table ID 8371) where you set a name and description, the same way you would name any reusable configuration object in Business Central.

The substance of the package lives in its lines, stored in the Fin. Report Package Report table (ID 8372). Each line points to an existing Financial Report, and this is where the design gets genuinely useful for anyone who has fought with one-size-fits-all reporting: every line can carry its own custom filters and its own date formula, independent of the other reports in the same package. A P&L line might use a “-CM” to “CM” formula to lock onto the current month, while a companion cash flow line in the same package uses a trailing twelve-month range. You’re not forcing every statement in the bundle onto identical dimensions or identical periods just because they’re shipping together.

Once the lines are configured, two actions do the actual work. Print generates the combined output immediately, useful for testing a package before you trust it to run unattended, or for the occasional ad hoc request from a board member who wants “everything” right now. Schedules is where the recurring value shows up: you can set multiple schedules per package, each with its own Next Run Date/Time and Recurrence Run Date Formula, and each capable of emailing multiple recipients whose addresses come from their User Setup records. Every run is tracked in a log, so when someone asks whether the March package actually went out, there’s a record rather than a guess.

The output itself still surfaces through the Report Inbox, the existing Business Central page that lists reports generated by scheduling rather than by the Print action, and that also supports pushing files to OneDrive or sharing them with a link. Packages don’t bypass that infrastructure; they feed it a combined file instead of a single-report one.

Close-up of a laptop showing a bundled financial report configuration next to printed statements during month-end close

Setting this up without recreating the wave 1 mess

The mistake to avoid is treating a package as a folder you drop existing schedules into. It isn’t. If you already built individual report schedules under the wave 1 model, plan to retire the redundant ones once a package covers the same distribution, or you’ll end up with both the old single-report emails and the new bundled PDF landing in the same inboxes, which is a worse experience than the one you started with.

Design packages around who receives them, not around how the reports happen to be organized in the Financial Reports list. An executive package might combine the P&L and a cash position summary. An audit-committee package might combine the balance sheet with a G/L detail extract and nothing else, since that audience doesn’t want departmental variance noise mixed in. A department-head package might need per-line filters set to each recipient’s cost center dimension, which is exactly what the line-level custom filters are built to handle. Because each line’s filter and date formula are independent, you can serve genuinely different audiences from the same underlying report definitions without maintaining duplicate report objects just to vary the scope.

One prerequisite is easy to miss until it breaks a scheduled run: every recipient needs a valid email address on their User Setup record. If it’s missing, the system doesn’t fail silently; it throws an explicit error stating the User Setup does not exist, which is at least diagnosable, but it’s worth confirming recipient setup as a checklist item before you go live with any package schedule rather than discovering the gap on the first missed delivery.

Why this matters more than it looks like it should

The same 29.0 preview also introduced G/L account usage tracing for financial report authors, letting you identify uncategorized accounts and preview a report’s calculations before publishing changes to its definition. That capability matters more once packages exist than it did when every report shipped alone. A calculation error or an uncategorized account sitting quietly in one standalone report is a problem for one audience. The same error sitting inside a package that bundles three statements into a single PDF for the executive team turns one mistake into a credibility problem across every report in the bundle, delivered in one shot. If you’re adopting packages, adopt the account tracing discipline alongside them, particularly for any report line feeding a package that goes to leadership.

It’s also worth being honest about timing. Everything described here is currently a preview feature, available only in Business Central online sandbox environments as of the September 2026 update, with Microsoft’s own documentation cautioning that preview features aren’t intended for production use and may carry restricted functionality until general availability, expected in October 2026. That’s a reasonable amount of time to build and test packages against a real close cycle in a sandbox before betting a live month-end on them. Treat October as the date you flip the switch in production, not the date you start figuring out how packages should be structured.

For an organization that has been assembling a five-document close package by hand every month, that lead time is the useful part. There’s no reason to wait for general availability to define which reports belong in which package, which filters each line needs, and which schedules match your actual close calendar. Doing that groundwork in the sandbox now means the October rollout is a configuration change, not a redesign, and Routeget Technologies typically structures exactly this kind of preview-to-production pilot as a parallel run: the new package alongside the existing manual process for one full close cycle, so any gap surfaces before it reaches an executive inbox.


#BusinessCentral #FinancialReportPackages #MonthEndClose #ERPReporting #FinanceAutomation