Real-Time Financial Dashboarding: Replacing Static Reports with Live Power BI Analytics in Dynamics 365 Finance

Most finance teams still operate on reports published monthly or quarterly. The CFO gets a dashboard refreshed on the first of the month, shows variance analysis in a board meeting two weeks later, and by then the underlying reality has shifted. If you are a finance leader managing a mid-to-large organization on Dynamics 365 Finance, this delay represents a real cost: slower decisions on cost control, less visibility into P&L movement, slower response to market changes. The constraint is not missing data—Dynamics 365 Finance captures GL transactions, invoices, and cash positions continuously. The constraint is getting that data into a usable analytical layer fast enough that it actually informs decisions while they still matter.

Real-time Power BI dashboards embedded directly into Dynamics 365 Finance change this equation. Instead of waiting for a report run and a refresh schedule, finance teams can see actual GL balances, AP aging, revenue recognition status, and cash forecasts as they shift through the day. This shift from static-report thinking to live-analytics thinking is not just a technical change; it affects how finance teams prioritize work, how fast they react to spending or revenue surprises, and ultimately how much visibility the CFO has into the business between board meetings.

Why Static Reports No Longer Fit Finance Operations

For the past decade, the finance reporting cycle has been predictable: month-end close, GL reconciliation, report generation, variance analysis. This cycle made sense when data moved slowly and finance leadership made quarterly decisions. But most organizations now operate on shorter cycles. Weekly cash positions matter. Daily AP aging matters. Real-time cost overruns matter. A financial controller managing a manufacturing operation needs visibility into material costs and inventory turns as they happen, not as a summary in next month’s report.

Static reports have another hidden cost: they are expensive to maintain and easy to misalign. A report that runs monthly is updated infrequently. If the GL structure changes, account mappings shift, or the business adds a new division, the report can fall behind quickly. Teams end up building spreadsheets alongside reports, creating dual sources of truth. Power BI, by contrast, connects directly to the Dynamics 365 Finance data model, so it automatically reflects current GL structures, current divisions, and current transaction data.

How Power BI Embeds Real-Time Visibility into Dynamics 365 Finance

Embedding Power BI visuals directly inside Dynamics 365 Finance means finance users stay in the application they already use, without jumping to a separate analytics tool. A CFO reviewing the GL summary page can see a live P&L chart refreshed every few minutes. An AP manager can see aging curves update as new invoices post. A treasury team can monitor cash forecasts that incorporate real-time bank feeds and outstanding commitments.

The technical bridge is the Dynamics 365 Finance data model itself—tables like GeneralJournalEntry, VendorInvoiceJournal, and CustInvoiceJournal flow into Power BI via Dataverse or direct SQL connections (depending on your cloud architecture). Once Power BI connects, the refresh cadence can be as fast as the business needs: hourly updates for cash positions, intraday for P&L variance, real-time for transaction counts and exception tracking.

For a CFO, this means three practical shifts. First, the decision context is current. If a division’s costs are running 15 percent over budget this month, you see it on day 10, not day 35 when the full report closes. Second, drilling down is immediate. A dashboard showing revenue variance doesn’t require a follow-up email to accounting asking for detail; the CFO clicks on the variance and sees the underlying transactions. Third, exceptions bubble up visually. A Power BI dashboard can highlight AP invoices that have aged beyond terms, GL items that are outside historical range, or cash positions that trigger borrowing needs—raising flags that static reports miss because those reports are not built with exception logic.

Real-World Implementation Pattern

A typical implementation starts narrow. Finance teams select one high-impact reporting area—often P&L and cash flow—and build a Power BI workspace that pulls from Dynamics 365 Finance in real time. The workspace includes a main dashboard for CFO review (top-level P&L, cash position, variance to budget), plus detailed pages for cost center managers (expense detail by department), treasury (cash forecast and liquidity), and audit (GL activity and reconciliation status).

Adoption often includes a refresh pattern: the main dashboard updates hourly, detail pages update on-demand (when a manager opens them). This balance respects system performance while giving leadership current data. As the team becomes comfortable, additional areas follow—supply chain cost analytics, project profitability, tax provision tracking. Each addition reuses the same Power BI-to-Dynamics 365 Finance bridge, so incremental cost is low.

A key implementation detail is security. Power BI’s row-level security (RLS) rules can enforce that a cost center manager sees only their own department’s data, and that audit staff see transactions tagged for their audit scope. This means the same dashboard can serve different roles without creating multiple versions.

When to Prioritize Real-Time Analytics

Real-time Power BI dashboards are not universal replacements for static reports. Regulatory compliance reports often need to be frozen at month-end and archived as signed documents, not updated live. But operational dashboards—cash flow, expense tracking, revenue recognition, headcount burn, project margin—nearly always benefit from real-time refresh.

A good starting signal is this: if your CFO regularly asks for “numbers as of today” in the middle of the month, or if cost control decisions are delayed because report data is stale, real-time Power BI embedded in Dynamics 365 Finance is likely a strong priority. Similarly, if your organization is moving toward shorter planning cycles (rolling forecasts, weekly cash planning, daily spend reviews), the static month-end report cycle falls further behind.

The business case is straightforward. Most implementations cost between 30 and 60 days of implementation effort, assuming a solid Dynamics 365 Finance foundation and basic Power BI skills in-house or via a partner. The payoff is faster decisions, fewer duplicate spreadsheets, less rework when GL structures change, and visibility that actually informs strategy rather than summarizing it after the fact.

Getting Started

If you are a CFO or finance leader evaluating this approach, the first step is inventory: which reports do you actually use, and which ones do you need to be current? Many organizations publish dozens of reports but rely operationally on a handful of core dashboards. Focusing real-time Power BI on those core dashboards delivers 80 percent of the value with 20 percent of the effort.

The second step is to confirm your Dynamics 365 Finance data architecture is clean enough to support analytics. If GL accounts are poorly structured, if cost centers are inconsistent, or if data quality issues are rampant, Power BI will amplify those problems. A small data cleansing effort upfront pays dividends: clear account hierarchies, consistent cost center mapping, standardized transaction descriptions all make the Power BI experience more trustworthy and useful.

The third step is to pilot with a single dashboard and a small user group, then expand. This approach surfaces integration issues, data quality gaps, and adoption friction in a manageable scope before rolling out across the finance organization. Teams that rush to “all reports in Power BI immediately” often create dashboards that sit unused because they don’t match how the team actually works.

Conclusion

The shift from static reports to real-time analytics in Dynamics 365 Finance is fundamentally about giving finance leadership visibility that actually informs decisions. A CFO who can see cash positions, cost variances, and revenue trends in real time can make faster decisions, spot problems before they become crises, and respond to business changes with less delay. Power BI embedded directly in Dynamics 365 Finance bridges the gap between transactional data and actionable insight, without requiring finance users to jump between systems.

For organizations operating in faster decision cycles, this shift is less a nice-to-have and more a competitive necessity. The implementations that succeed do so because they focus on the handful of dashboards that finance actually uses every day, build them on clean data, and embed them where the team already works. The payoff is faster decisions and more current business visibility—the two things most finance leaders say they most wish they had.

At Routeget Technologies, we have implemented real-time Power BI analytics for dozens of organizations moving from static Dynamics 365 Finance reporting to live dashboards. We find that the most successful implementations begin with a clear priority (cash flow, P&L, or expense control), deliver a working dashboard within weeks rather than months, and let adoption drive the next phase. If your finance organization is ready to move from monthly reports to live analytics, we can help navigate the data architecture and Power BI design decisions that make the difference between a dashboard people use and one that sits idle.

#PowerBI #DynamicsFinance #FinanceAnalytics #DashboardDesign #RealTimeReporting #DigitalTransformation #CFOInsight


Cash Flow Forecasting in Dynamics 365 Finance: Why AI Predictions Still Miss Working Capital Reality

Cash flow forecasting dashboard showing projected vs actual data with KPI metrics

Most finance teams have spent years building cash flow forecasts in Excel, stitching together data from bank statements, accounts payable systems, and revenue pipelines into spreadsheets that someone updates manually every month. The work is repetitive, the data silos make it unreliable, and by the time the forecast is finished, half of it is already stale. Dynamics 365 Finance Insights offers an escape from that trap through AI-driven cash flow forecasting that learns from historical cash patterns and generates long-term projections automatically. The pitch is compelling: machines eliminate the tedium, surface patterns humans miss, and free finance teams to focus on strategy instead of spreadsheet mechanics.

But there is a critical gap between what the AI model can do and what finance teams actually need it to do. AI-driven cash flow forecasts excel at identifying mathematical patterns in historical data, yet they struggle with the qualitative, forward-looking factors that actually drive cash flow reality: planned capital investments that haven’t yet hit the books, seasonal customer payment behavior changes, supply chain disruptions that will compress inventory holding periods, or a merger that restructures the entire customer base. A finance controller or CFO who relies solely on the AI forecast without layering in business judgment will often walk into a liquidity surprise.

The real value of Dynamics 365 Finance Insights cash flow forecasting is not replacing human judgment but augmenting it. When finance teams use the AI forecast as a starting point and then overlay business context, decision-making velocity accelerates and accuracy improves dramatically. Getting this right requires understanding what the model can and cannot see, knowing when to trust the forecast and when to override it, and building the right governance layer to validate forecasts before they drive working capital decisions.

The Limits of Pattern Recognition in a Complex Cash Cycle

AI models underlying cash flow forecasting in Dynamics 365 Finance are fundamentally pattern-recognition engines. They ingest historical cash inflows and outflows from your bank accounts, accounts receivable aging, accounts payable schedules, and payroll cycles, then use time-series forecasting to extrapolate what comes next. If your company has ten years of data showing that December customer collections spike by 35 percent and February payment to suppliers compresses payables by 20 days, the model will capture those patterns and encode them into future projections. This works well for recurring, predictable dynamics.

What the model cannot see is anything outside its training window that will reshape cash behavior going forward. If your company just signed a contract to pay a major vendor upfront instead of on net-60 terms, the model knows nothing about it until that transaction flows through the bank. If you are planning to divest a business unit, the cash flow impact of losing that customer’s collections will not appear in the forecast until after the divestment occurs. If a customer base mix shift is underway (moving from long-tail small customers to a few large enterprise accounts), payment velocity and working capital requirements will change, but the model is still extrapolating patterns from a customer composition that no longer matches reality.

These are not failures of the AI model. They are inherent constraints on what backward-looking pattern recognition can accomplish in a forward-looking world. A CFO charting course for a 24-month cash position that blindly follows the AI forecast without accounting for known strategic changes is making a decision on stale information, regardless of how sophisticated the underlying algorithm is.

Cash flow forecasting dashboard showing projected vs actual data with KPI metrics

Where AI Forecasts Add Immediate Value

The practical value of Dynamics 365 Finance Insights cash flow forecasting becomes clear when you deploy it specifically for what it does well: automating the baseline forecast that captures recurring cash patterns. Instead of a finance controller manually updating a spreadsheet with assumptions about seasonal collections patterns, payroll cycles, and vendor payment terms, the AI model learns these patterns and generates updated projections whenever new transactional data arrives. The baseline becomes self-updating, and the finance team shifts focus from mechanical forecasting to exception-based analysis.

Dynamics 365 Finance Insights also surfaces forecast accuracy metrics, showing finance teams how well the model predicted actual cash outcomes over trailing periods. This feedback loop is valuable, because it reveals whether patterns the model identified have remained stable or have shifted. If the model historically predicted collections within plus-or-minus 3 percent but suddenly starts missing by 8 percent, that is a signal that underlying customer payment behavior has changed and warrants investigation.

What-if scenario analysis is another capability that multiplies the value of AI-driven forecasting. Once the baseline forecast is in place, finance teams can create alternate scenarios representing different business conditions (optimistic growth, pessimistic demand, recession response) and overlay them on top of the baseline. This capability let you rapidly explore how cash positions respond to different strategic choices without rebuilding the entire forecast from scratch.

The Three Scenarios Where AI Forecasts Lead Finance Teams Astray

Reliance on AI-only cash forecasting becomes problematic in specific, predictable scenarios that every finance team encounters:

Structural changes to cash flow drivers. When your business model shifts, historical patterns become unreliable. If you transition from on-premises software licensing (lump-sum collections upfront) to a subscription SaaS model (monthly recurring revenue spread over years), the AI model trained on your old licensing pattern will dramatically overforecast near-term collections. The model needs retraining on new data, but that can take months. In the interim, finance teams need human judgment to reframe the forecast against the new revenue model, or they will drastically overestimate liquidity.

One-time events with material cash impact. A large customer prepayment, a debt refinancing, an asset sale, a business combination, or an unexpected insurance recovery all create cash movements the model has no historical precedent for. These events typically require advance knowledge and business context to forecast. If a CFO knows a customer prepayment of $20 million is coming in Q2 but the AI model knows nothing about it, the combined view (baseline forecast plus known one-timers) is far more useful than either alone.

Seasonal and cyclical patterns that have shifted over time. AI models can capture long-term seasonal patterns, but if the magnitude or timing of seasonality has changed, the model can lag in detecting and adapting to that shift. A company that has historically seen strong Q4 collections might have shifted to a more consistent quarterly pattern due to customer base changes. The model will still expect a Q4 spike based on historical data, whereas a finance controller watching year-over-year trends will notice the pattern has evolved and adjust accordingly.

In all three scenarios, the disconnect is the same: the AI model is solving for accuracy on historical patterns, while finance teams are solving for visibility into forward cash positions shaped by strategy, one-off events, and changing market conditions. Neither is wrong. They are just operating on different time horizons and information sets.

Finance team reviewing cash flow forecasts and working capital data on dashboard systems

Building Governance Around AI Forecasts

The path to effective AI-driven cash flow forecasting in Dynamics 365 Finance is not to replace human judgment but to institutionalize how the two interact. This requires a lightweight governance framework that clarifies when the AI forecast is trusted as-is, when it needs overlay, and who is responsible for validating the forecast before it drives working capital decisions.

Start by establishing a forecast validation workflow that requires the finance controller or working capital manager to review and sign off on cash forecasts before they are used for liquidity planning or short-term borrowing decisions. This review should be structured and quick, not bureaucratic. The reviewer should check three things: Does the forecast direction match current business trends? Are known one-time cash events accounted for? Are there any recent structural changes to the business (pricing model shift, customer mix evolution, payment term changes) that the AI model would not yet have learned?

If the answers are yes, the AI forecast can proceed unchanged. If the answers are no, the review process should support rapid overlay of business context. Dynamics 365 Finance Insights allows finance teams to create scenario variants and what-if analyses that can quickly model known events or strategic changes on top of the baseline forecast. This is not rebuilding a forecast in Excel; it is using the system to layer business judgment on top of the AI baseline.

Over time, as the AI model learns from corrected forecasts and forecast validation patterns, the lag between model behavior and business reality should narrow. A finance team might discover that 80 percent of forecasts pass validation without change, while 20 percent require overlay of known one-timers or cyclical pattern adjustments. Documenting those patterns helps you identify where the model needs retraining or where business context should be automatically fed back into the forecasting process.

The Compound Effect of Forecast Discipline

Finance leaders often underestimate the leverage of accurate cash flow forecasting on decision-making velocity. If a CFO has high-confidence visibility into 24-month cash position, working capital decisions that would otherwise require contingency buffers can be optimized. Seasonal borrowing decisions become more predictable. Investment in accounts receivable improvement initiatives can be prioritized based on forecast impact. Strategic decisions about capital allocation, debt paydown, and dividend policies can be made with clearer information about future liquidity.

Conversely, a forecast that the CFO does not trust becomes either a shelf-ware artifact that no one uses, or worse, a forecast that is blindly followed and leads to strategic surprises. Many companies keep a spreadsheet forecast alongside their ERP forecast precisely because they do not trust the system forecast.

The investment in building governance discipline around AI-driven forecasting is usually small relative to its impact. A monthly 30-minute forecast review and validation workflow, combined with clear ownership for feeding business context back into the system, is enough to shift AI forecasts from mathematical curiosities to operational planning tools.

Making the Shift from Manual to Augmented Forecasting

The transition from Excel-based forecasting to AI-driven forecasting in Dynamics 365 Finance requires more than just enabling the feature. It requires reframing how finance teams think about forecasting: not as a document to be produced, but as an ongoing process that blends machine intelligence with human business judgment. The AI model generates the baseline, eliminating the mechanical work. Finance controllers validate and contextualize it, adding business judgment. Together, the two create a forecast that is both statistically grounded and strategically sound.

Organizations that make this transition successfully are usually those that treat the AI forecast as the starting point for a conversation, not the destination. They ask: Where does the forecast seem right, and where does business knowledge suggest it should be adjusted? What events on the horizon will reshape cash patterns that the model does not yet know about? How can we feed that business context back into the system to continuously improve forecast quality?

These questions shift forecasting from a cost center (people spending time in spreadsheets) to a strategic process (finance contributing to working capital optimization and capital allocation decisions). The shift is not automatic. It requires discipline, clear ownership, and a commitment to treating forecasts as living documents that evolve as business conditions change. But the payoff for finance organizations disciplined enough to make the shift is significant: better visibility, faster decision-making, and working capital strategies grounded in both mathematical rigor and business reality.

At Routeget Technologies, we help organizations build governance discipline around financial analytics and forecasting, ensuring that AI-driven insights inform rather than replace strategic decision-making. If you are implementing cash flow forecasting in Dynamics 365 Finance and want to ensure adoption and accuracy, our consulting team can help design the validation workflows and governance structure that turn machine forecasts into actionable business intelligence.

#DynamicsFinance #CashFlowForecasting #FinanceInsights #WorkingCapitalOptimization #CFOStrategy #FinancialPlanning #DynamicsF&O

Intercompany Elimination Automation in Dynamics 365 Finance: The Journal Entry Trap Most Finance Leaders Miss

Finance operations team reviewing intercompany transactions

Opening Hook

You’re three weeks away from quarter-end close. Finance has forty intercompany transactions in the queue: payables between subsidiaries, recharges for shared services, allocation of corporate expenses. Your team has been manually creating elimination entries in Dynamics 365 Finance for two years now, checking each one against the subledger balances to make sure matching transactions offset properly. It works, but it’s a manual gauntlet—and every quarter, at least one entry gets posted twice, or one side doesn’t match the other, forcing a restatement. The real question isn’t whether you can automate it. It’s why you haven’t, and what you’re risking by waiting.

Intercompany elimination automation is one of those finance capabilities that sits between the realm of “obvious good idea” and “surprisingly complicated to implement.” Most organizations running Dynamics 365 Finance intend to automate it. Many skip it because the setup looks straightforward until you actually try to accommodate the real-world variations in how subsidiaries actually transact with each other. The result is that finance teams at medium and large enterprises spend days each close period on what should be a single-click process, and they accept monthly restatements as a cost of doing business.

The problem isn’t the tool. It’s the gap between what the elimination process *should* do and what most companies configure it to do.

Why Elimination Automation Fails in Practice

Intercompany elimination transaction flow diagram

Dynamics 365 Finance includes native intercompany elimination capabilities. You can set up elimination rules, run a batch process, and create the offsetting journal entries automatically. In theory, this solves the manual-entry problem. In practice, most finance teams who build this end up abandoning it or working around it because the actual requirements are messier than the standard feature handles.

The standard elimination process works like this: define a rule (for example, “eliminate all transactions between subsidiary A and subsidiary B”), run the process, and Finance creates an elimination entry that offsets the amounts on both sides. Clean. Logical. Doesn’t work for half your transactions.

Consider what actually happens at close time. You have intercompany payables where subsidiary A owes subsidiary B for consulting services. You have expense allocations where the parent company charged subsidiaries for IT overhead. You have intercompany sales that aren’t yet invoiced, sitting as accrued revenue. You have currency revaluation differences on intercompany balances. You have partial payments that leave hanging balances. You have transactions posted in different legal entities with different chart-of-accounts structures, so the elimination account on one side doesn’t perfectly mirror the elimination account on the other.

Standard elimination rules assume bilateral, matching transactions in symmetrical account hierarchies. Your actual data looks nothing like that. So when you run the elimination batch, you get partial results, exceptions, and holes you have to patch manually. The bottleneck doesn’t disappear; it just shifts from “enter elimination entries” to “fix elimination exceptions.”

Finance leaders often respond to this by either (a) maintaining manual entries anyway because they understand exactly what’s being eliminated, or (b) accepting that some intercompany balances don’t get eliminated and building manual reconciliation into the close checklist. Both options are expensive. Both hide the problem behind process discipline rather than solving it.

The Core Configuration Trap

The most common failure point is account-matching logic. Dynamics 365 Finance’s elimination feature requires you to specify which accounts on one side of the transaction pair with which accounts on the other side. This sounds straightforward: payables account 200100 on the subsidiary pairs with revenue account 400200 on the parent. For a multi-subsidiary enterprise, you end up with dozens of pairing rules, each of which assumes the same chart-of-accounts structure exists in every legal entity.

But most organizations don’t have symmetrical chart-of-accounts structures across subsidiaries. One subsidiary might use a three-digit cost center code as part of its account number; another uses a six-digit project code. One subsidiary’s chart reflects its regulatory requirements; another reflects its parent’s reporting structure. When you try to force a uniform pairing rule across this, the automation fails on the exceptions—and the exceptions are where your intercompany risk actually lives.

The second configuration trap is elimination method selection. Dynamics 365 Finance offers three elimination methods: by elimination account, by elimination rules, and by source dimensions. Many teams choose by elimination account because it sounds simpler: just specify the account number that identifies an elimination entry, and the system will eliminate matching balances. This works if every intercompany transaction is coded to the same elimination account. It fails the moment transactions are coded to different accounts based on business unit or transaction type, which is what most accounting policies actually require.

A third trap, often overlooked during implementation, is timing. The elimination process doesn’t recognize transaction reversals. If subsidiary A reverses an intercompany invoice in one period and reissues it in the next, the elimination logic might net them in one period (correctly) but not eliminate the new entry in the next (incorrectly). If you have accrual entries that roll forward, the system doesn’t know whether an accrual has been settled or not. You end up eliminating transactions that shouldn’t be eliminated, or leaving open balances that should have been cleared.

What Actually Works: The Approach That Finance Leaders Should Use

The finance teams with the most reliable elimination processes don’t rely on the standard feature to do all the work. Instead, they use Dynamics 365 Finance’s elimination tools as a framework, but they layer on additional validation and semi-automation. Here’s the pattern:

First, establish elimination rules that cover your high-volume, repetitive transactions. These are usually the 70 or 80 percent of intercompany activity that follows a consistent pattern: standard intercompany invoicing, allocated expenses, routine recharges. For these, the elimination batch process should work cleanly. Document what these rules eliminate, down to the account level and dimension combinations.

Second, build a separate process for exception handling. Run the elimination batch, but don’t post the results immediately. Export the elimination entries to Excel or a Power BI model, and validate them against your subledger balances before posting. Check that every elimination entry has a matching transaction on both sides of the elimination. Check that no entries are created for reversal transactions or accruals that should roll forward. This step takes time, but it’s a single review pass instead of forty manual entries, so it’s still a win. It also creates an audit trail for your external auditors.

Third, identify which intercompany transactions or balance types require manual elimination because they’re too irregular for the standard process. These might be settlement-in-progress balances, partial intercompany payments, or transactions that cross subsidiaries with fundamentally different chart structures. Document these explicitly. Don’t pretend the automation covers them. Instead, build a checklist that the finance team follows at close time to ensure these balances are explicitly reviewed and eliminated if appropriate.

Fourth, if your organization is running Dynamics 365 Finance with Power Automate or has development resources, invest in a custom validation flow. The flow should read the pending elimination entries, compare them to the underlying subledger transactions, check for matching invoices or supporting documentation, and flag entries that don’t pass basic reasonableness checks. This isn’t fully automatic elimination, but it’s a guardrail that catches the most common errors: duplicated entries, reversed entries posted as new eliminations, and account mismatches that slipped through the configuration.

The Business Case for Getting This Right

Finance organizations that automate 80 percent of intercompany eliminations and tightly control the remaining 20 percent typically see close cycles compress by two to three days. They reduce restatements for intercompany errors to nearly zero. They cut the finance team’s close-period overtime significantly. They have a documented process that external auditors can review with confidence.

But the real benefit is visibility. When intercompany eliminations are systematized, not manual, you actually know which transactions were eliminated and why. You have an audit trail. You can run analytics on intercompany activity and see patterns: which subsidiaries have the most outstanding intercompany balances, which transaction types take longest to settle, where cash is actually stuck in the system. That visibility drives better working capital management and faster cash conversion.

The risk of not doing this isn’t just operational. If your finance team is doing intercompany eliminations manually, you’re relying on individual judgment calls about what to eliminate and what to leave open. That’s fine until someone new joins the team, or someone leaves, and the institutional knowledge walks out the door. You end up with intercompany balances that neither the subsidiary nor the parent fully understands. You run into issues at audit time or during a consolidation review that force a restatement.

Getting Started

If you’re currently doing intercompany eliminations manually in Dynamics 365 Finance, your first step is to stop trying to fully automate them immediately. Instead, audit what you’re actually eliminating each month. Document the transactions, the accounts involved, the business rationale. This gives you the blueprint for what the automation should cover versus what requires manual review.

Build the elimination rules in a test environment first, and run them against three months of historical data. Don’t post the entries. Instead, compare what the system generated against what your finance team actually eliminated in those three months. Identify where the automation missed transactions or created incorrect entries. Fix the configuration. Repeat.

Once the automation covers the repetitive 80 percent cleanly, document what’s left as exception handling. Document the account pairing rules so that whoever is managing the process next year—or five years from now—understands why the automation is configured the way it is.

If you have the resources, layer on a Power BI dashboard or a Power Automate flow that validates elimination entries before posting. Even a simple check that counts invoices on both sides of the elimination catches most errors.

The close process is where finance leaders are usually most stretched during the month. Taking even two days off your close cycle is worth the implementation effort.

About Routeget Technologies

Routeget Technologies has spent years helping mid-market and enterprise finance organizations streamline their period-close processes in Dynamics 365 Finance. Intercompany elimination automation is one of the first things we look at during an implementation review because it’s one of the highest-return-on-effort improvements available. If your current close process is still mostly manual, we can help you audit what’s actually happening, design an elimination configuration that works for your subsidiary structure, and build the validation layer that keeps the automation reliable.


#IntercompanyElimination #DynamicsFinanceOps #FinanceAutomation #PeriodClose #ERPGovernance #FinanceTransformation #DynamicsFinance

AI Builder Document Intelligence: Why Your Finance Team Still Manually Keys 2,000 Invoices a Month

AI Builder Document Intelligence: Why Your Finance Team Still Manually Keys 2,000 Invoices a Month

For most large enterprises running Dynamics 365 Finance, accounts payable looks straightforward on paper: invoices arrive, they get matched to purchase orders, approvals happen, payments post. In practice, the first step is where the actual work lives.

An average mid-market organization processes 2,000 to 5,000 invoices per month across dozens of vendors. Each arrives in a different format, with fields in different positions, sometimes with missing data. A finance team that tries to automate this early usually concludes it is not worth the engineering effort. The result is a process that remains almost entirely manual: an AP clerk opens an email, scans an attachment, reads the invoice line by line, and keys data into the ERP by hand.

The financial impact compounds invisibly. A clerk processes around 30 to 50 invoices per day. That is 8 to 10 minutes per invoice of pure data entry, plus rework for errors. Across 2,500 monthly invoices at an average of 40 minutes per invoice, you have roughly 1,667 labor hours per month, or 8 to 10 full-time equivalent staff just feeding data into your ERP. The opportunity cost is real: those people are doing work machines could do better.

Intelligent document processing has existed for years, but it historically demanded custom machine learning expertise or vendor lock-in to specialized platforms. AI Builder changes that. It is a low-code intelligent document processing engine built directly into the Power Platform and accessible through Microsoft Dataverse. Using AI Builder’s document intelligence model, you can teach a system to extract data from invoices, POs, or receipts, and have that extracted data automatically flow into Finance and Operations as journal entries, vendor invoices, or line items, without custom code or a separate platform.

The catch is that most implementations get the architecture wrong, deploy too early, or do not think through the business case clearly enough to justify the investment.

What AI Builder Document Intelligence Actually Does

AI Builder’s document intelligence model learns patterns from example documents. You supply 5 to 100 sample invoices, mark the specific fields you want extracted (invoice number, date, line item amounts, vendor name, cost center), and AI Builder trains a model. Once trained, it processes new invoices and extracts those fields with a confidence score for each value.

The extraction outputs structured data as JSON, which flows into Power Automate, passes to Dynamics 365 through REST APIs, or writes directly to Dataverse tables. You can build an approval workflow where extracted data is reviewed by humans, corrections are made if confidence scores are low, and once approved, the invoice posts without manual rekeying.

The critical limitation: AI Builder solves data entry, not the entire AP transformation. It does not solve the three-way match or reconciliation of discrepancies between invoice amounts and actual receipts. If invoices regularly have billing errors or missing line items, AI Builder will extract those discrepancies accurately, but human approval workflows are still required to investigate.

AI Builder also assumes reasonably stable vendor populations. If vendors send different invoice formats month to month, or you have 200 vendors across five countries with different field positions, you may need multiple models or a more flexible extraction architecture.

The Actual Implementation Costs

The common mistake is to assume that because AI Builder is “low code,” implementation cost is proportionally low. It is not.

Training a single AI Builder model requires deciding which fields are worth extracting, building a training set, and determining how much format variance the model needs to handle. You cannot build a generic model across all vendors. You have to scope it precisely. Multiple vendor formats require multiple models or accepting lower confidence scores and higher downstream rework.

The real cost sits in the integration layer. You need a Power Automate flow that ingests documents, calls the AI Builder model, handles extracted data, performs validation and enrichment (cost center lookups, amount threshold checks, purchase order verification), and posts data into Dynamics 365 Finance. That flow needs error handling, logging, and exception routing for human review. You also need to decide where documents come from: email, OneDrive, a vendor portal. Each source requires a different ingestion pattern.

A medium-complexity invoice processing automation project involving 5 to 10 major vendors, one AI Builder model, and robust Power Automate orchestration typically runs 6 to 12 weeks, roughly 300 to 600 professional services hours. At 200 USD per hour fully loaded, that is 60,000 to 120,000 USD. AI Builder licensing is usage-based at roughly 0.01 to 0.02 USD per page. An organization processing 2,500 invoices per month with 3 pages each processes 90,000 pages annually, costing 900 to 1,800 USD in consumption.

But labor savings are substantial. Saving 1,667 hours per month at 45 USD per hour fully loaded equals 75,000 USD monthly, or 900,000 USD annually. Even if net savings are 70 percent of that due to exception handling and ongoing overhead, you still have 630,000 USD in annual labor savings against a 120,000 USD implementation cost. Payback happens in 2 to 3 months.

Those numbers are achievable if, and only if, you have a focused vendor population, reasonably consistent invoice formats, and a clear baseline for how much time the manual process actually consumes. Many organizations skip that baseline measurement, build the system anyway, and then cannot measure whether it actually saved time.

Common Failure Modes

The most common failure is misalignment on scope. Finance wants to automate “all invoices.” Engineering builds one model for all vendor formats. The model trains on 50 random invoices from 20 different vendors. When it encounters a new vendor invoice, confidence scores are low, and the entire pile ends up in the exception queue. The fix: scope tightly. Start with 3 to 5 major vendors representing 40 to 60 percent of volume. Get those working first. Add additional vendors only after the core extraction pipeline is mature and stable.

The second failure is underestimating validation and enrichment workload. Once you extract data, you need to validate it. Does the date make sense? Is the vendor in the master list? Is the amount within normal range? If any check fails, the invoice needs review. Without a validation layer, you have not saved labor; you have shifted it from data entry to exception handling.

The third failure is publishing to Dynamics 365 without handling master data dependencies. A vendor invoice requires valid vendor master records, cost centers, and often purchase order references. Incomplete or inconsistent vendor master data means extraction works perfectly but posting fails because the vendor cannot be resolved. This shows up as an AI Builder problem when implementation teams do not plan for data quality prerequisites upfront.

When AI Builder Works

The use cases with clear ROI are relatively specific.

The strongest case is a company with a stable vendor population where the top 10 to 20 vendors represent 70 percent of invoice volume and use consistent invoice formats. Train one or two models for those top vendors, automate their extraction entirely, and you have converted 70 percent of invoice volume from manual to automated. The remaining 30 percent stay manual, but you have cleared the decks of high-volume repetitive work.

The second strong case is an ERP migration where the existing system has data entry backlogs. Using AI Builder to accelerate historical invoice loading during migration can meaningfully shorten timelines. Post-migration, you keep the system running for ongoing automation.

The third case is significant localization requirements, where invoices come from subsidiary companies in multiple countries and languages. AI Builder’s multilingual capabilities handle non-English documents, so you can build a single orchestration layer that routes invoices by language, extracts data consistently, and maps that data to the right cost centers based on geography.

Measuring Before Committing

Before starting, measure three things.

First, measure current invoice processing with precision. How many invoices per month? Average time per invoice from receipt to posting, broken down by task (data entry, validation, research, approval, posting)? Error rate and rework volume? These numbers should come from actual time tracking, not estimates.

Second, identify scope. Which vendors represent the top 50 percent of volume? Are their formats consistent month to month? If you extracted 20 sample invoices from your top 10 vendors, how much variation would you observe in field positions? This informs whether you need one model or multiple models.

Third, confirm you have people and tools in place. AI Builder handles extraction, but you still need a Power Automate designer, a Dynamics 365 developer, and ongoing operational ownership for the flow. If you would need to hire these resources, that cost belongs in the implementation budget.

With those measurements, the business case becomes concrete. You can calculate labor savings per month against implementation cost and decide with confidence whether the project pencils out.

AI Builder document intelligence is not a panacea for AP efficiency, but in focused scope with stable vendor populations and consistent invoice formats, it solves a real problem that costs most large enterprises hundreds of thousands of dollars per year in pure human labor. The implementation requires clarity on scope, attention to data quality, and realistic expectations about exception handling. But for the right use case, the ROI is compelling enough to build into your Dynamics 365 Finance roadmap.


Hashtags: #AIBuilder #DocumentIntelligence #InvoiceProcessing #DynamicsFinance #FinanceAutomation #DynamicsFinanceOps #RPA #PowerPlatform

Dynamics 365 Finance Month-End Close: Why Manual Review Processes Eat Three Weeks of Your Finance Team’s Time

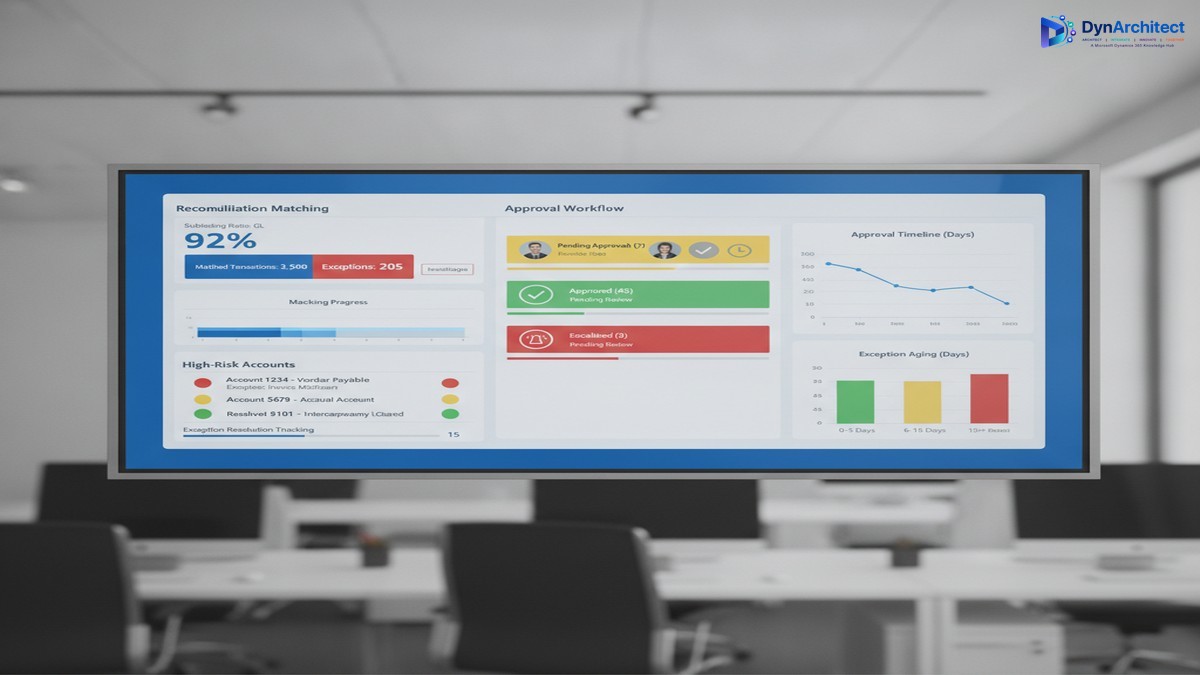
Dynamics 365 Finance month-end close dashboard with reconciliation and approval workflows

Your CFO expects the month-end close to take five business days. Your finance team knows it will take at least three weeks, if nothing breaks. Neither estimate is wrong, but the gap between them exposes a concrete operational problem that Dynamics 365 Finance can address—if you design the close process deliberately rather than simply importing Excel workflows into a new system.

The root cause isn’t Dynamics 365 Finance’s fault. It’s that most organizations have never mapped the actual work their finance team performs during month-end close, and they transfer that unmapped work directly into D365 Finance, where the same manual reviews and exception-handling steps consume the same time, just now in a new interface. This article walks through the hidden work that extends close cycles and the specific D365 Finance capabilities that can compress it without sacrificing control.

The Hidden Work in Month-End Close

Finance teams perform three categories of work during month-end close: transactional, reconciliation, and review and approval. The first category moves quickly in Dynamics 365 Finance because transactional posting, reversal, and period closing are automated. The second category, reconciliation, is where most organizations find that D365 Finance has given them new tools but not a fundamentally different process. The third category, review and approval, is where the real bottleneck sits.

Reconciliation requires matching subledger balances to the general ledger and resolving differences. In Excel, this meant exporting general ledger data to a spreadsheet, exporting subledger data to another spreadsheet, and then manually or with crude formulas, finding and categorizing exceptions. In Dynamics 365 Finance, you have automated reconciliation matching, but it still requires manual exception review if a transaction doesn’t auto-match due to timing, rounding, or data misalignment. Many organizations don’t implement the reconciliation matching engine at all, and instead build custom reconciliation reports that they then export and manually review in Excel. That defeats the purpose. Organizations that do implement reconciliation matching still need a process to review and approve the remaining exceptions. If your exception resolution process is ad-hoc (email threads, informal approvals, updates made directly to the database by whoever has time), month-end close becomes a game of whack-a-mole where resolving one exception creates new work elsewhere.

The review and approval stage is where time collapses. At this stage, the close is technically complete from a system perspective—all journal entries have posted, all subledgers have been reconciled, and all accounts have been reviewed—but finance leadership has not yet signed off. This is where your CFO’s five-day close hits the wall. The approval process usually means compiling reports, distributing them via email, waiting for responses, and manually tracking who has signed off and who is still reviewing. If a reviewer finds an error, the journal entry gets reversed, the approver list gets longer, and the cycle starts again. If multiple reviewers work simultaneously without a structured change-control process, they may unknowingly create conflicting updates.

Dynamics 365 Finance month-end close dashboard with reconciliation and approval workflows

Why Dynamics 365 Finance’s Tools Don’t Automatically Solve This

Dynamics 365 Finance has features that address each of these stages. It has reconciliation matching for subledger-to-GL matching. It has a journal approval workflow that routes entries to approvers. It has role-based security so that only authorized users can post to specific accounts or cost centers. But implementing these features doesn’t automatically translate to a faster close if the underlying process is not designed first.

The most common implementation pattern is this: the team implements D365 Finance features directly as they exist, with minimal process redesign. The reconciliation matching engine gets enabled but with no workflow for resolving exceptions. The journal approval workflow gets configured but with a long approval chain that mirrors the existing email-based approval process—five to ten approvers in sequence, each seeing the full entry list and taking days to respond. The role-based security gets configured but not used strategically to separate data entry from approval, so reviewers still spend time wading through draft entries they didn’t create.

The result is that Dynamics 365 Finance executes the existing process more efficiently at the transactional level but doesn’t reduce the actual elapsed time, because the transactional work was never the bottleneck. The bottleneck is the manual review and approval stage.

Structural Changes That Compress the Close Without Cutting Corners

Three structural changes to your close process, combined with deliberate use of D365 Finance features, can reduce elapsed close time from three weeks to ten to twelve business days while improving control and auditability.

The first change is to separate data entry from approval. Assign data entry (journal posting, subledger reconciliation, exception resolution) to one team and approval to another team that has not touched the data being approved. This isn’t a new idea, but Dynamics 365 Finance makes it operationally feasible. Your reconciliation team can mark exceptions as resolved in the reconciliation matching workspace, but the approval team (the controller, the finance director, or a designated approval group) can see which exceptions were resolved and review them before the general ledger is locked. By structuring permissions so that data entry users cannot post approved entries directly, and approval users see only high-level summaries plus exceptions, you cut the time approvers spend searching for relevant data. A 30-minute approval review of 500 transactions becomes a 10-minute review of 12 exceptions.

The second change is to compress the approval chain. Instead of sequential approval (entry review by the subledger owner, then the cost center manager, then the controller, then the finance director), design approval stages in parallel when possible and in short sequence when approval must be serial. Most organizations can reduce approval stages from five to three without sacrificing control. The subledger owner approves their subledger reconciliation in the reconciliation workspace. The controller approves all entries and reconciliation exceptions at once, using a dashboard that shows high-risk accounts and exceptions flagged by the reconciliation matching engine. The CFO reviews a summary and sign-off letter rather than individual entries. This parallel-where-possible, serial-only-where-necessary structure typically reduces approval cycle time from eight to ten days to two to four days.

The third change is to automate exception escalation. If an exception is not resolved within a specific time window (for example, three days after period end), Dynamics 365 Finance can send an automated alert to the responsible approver. This prevents exceptions from sitting in a queue and blocking closure. The escalation alert also creates an audit trail—it records when the exception was identified, when the alert was sent, and when it was finally resolved. This audit trail is exactly what your auditors want to see, and it removes the need for a manual exception log that has historically been built in Excel and updated sporadically.

The Realistic Implementation Timeline

These changes require careful process design before the configuration work begins. A typical implementation that adds close-process automation to an existing D365 Finance deployment takes three to four months. The first month is spent mapping current close processes, identifying where exceptions occur most often, and defining the data risk thresholds that trigger approval. The second month is spent building the reconciliation matching rules, configuring the approval workflow, and setting up the exception escalation alerts. The third month is spent running parallel close cycles (the old manual process running alongside the new D365 Finance process) so your finance team can validate that nothing is being missed. The month-end close itself becomes faster immediately, but the real efficiency gain comes in the fourth and fifth close cycles, after your team is comfortable with the new workflow.

The cost of this implementation is not primarily in configuration—it’s in the time your finance team spends away from month-end close activities while the process is being redesigned and validated. Expect to allocate one senior accountant and one finance operations person for two to three months. Expect also that your close process will feel slower for the first month or two after go-live, because your team is learning new workflows and validating that every exception has been captured and resolved. This is normal, and it is not a sign that the implementation has failed.

Making the Business Case to Leadership

The case for process redesign around month-end close is straightforward for a CFO: it frees up your most experienced team members from manual review work so they can focus on analysis, forecasting, and planning. It compresses the time it takes to close the books, which gives leadership three extra weeks per quarter to make decisions based on actual financial results rather than waiting for the close to complete. It creates an audit trail for month-end close activities, which strengthens your internal control environment and simplifies external audits. It reduces the error rate in close processes because exception resolution is now tracked and validated rather than handled ad-hoc.

The cost is three to four months of implementation effort plus the finance team’s time during the redesign phase. The benefit is a close process that runs three to four days faster and a finance team that spends ten to twelve fewer days per month on manual reconciliation and approval work. Over the course of a year, that’s enough time for your finance team to take on strategic work that they couldn’t fit before.

Month-end close doesn’t have to be a three-week sprint every month. It can be a structured, partially automated process that your finance team completes in two to three weeks while also having time to analyze variances and support the business. The tooling exists in Dynamics 365 Finance. The missing piece is usually a deliberate process design that aligns the close workflow with your organization’s risk tolerance and approval structure.


About Routeget Technologies: Routeget Technologies helps mid-market and enterprise organizations streamline financial operations with Dynamics 365 Finance. If your finance team’s close process is consistently running longer than expected, contact us for a process assessment that identifies where Dynamics 365 Finance can reduce manual work without cutting corners on control.

#DynamicsFinance #MonthEndClose #FinanceTransformation #FinanceOperations #CFOStrategy #DynamicsImplementation

Power BI Financial Dashboards for Dynamics 365 Finance: Building the Business Case Without Overcommitting Resources

Power BI financial dashboard with budget variance analysis and cash flow metrics

Your Dynamics 365 Finance implementation is live. You saw a beautiful demo six months ago showing real-time cash flow forecasts, interactive budget variance analysis, and executive dashboards that updated daily. The vendor closed by saying, “You can build this in Power BI in a few weeks.”

Now, three months into your Power BI financial analytics initiative, your internal team is debating whether to hire a permanent analytics hire, your costs have tripled, and you’re six weeks behind on the first dashboard. That demo didn’t account for your Chart of Accounts structure complexity, your subsidiaries’ separate accounting policies, or the fact that your finance team still reconciles GL accounts in a spreadsheet no amount of automation can entirely replace.

This gap between demo and reality is not unusual. It is the norm. Finance organizations that understand this gap upfront build realistic programs that deliver value in 18 to 24 months. Those that don’t end up with abandoned dashboards, frustrated finance teams, and justifiably skeptical CFOs.

What Power BI Actually Brings to Finance

Power BI is a visualization and analytics tool. It is not magic, and it is not a substitute for good financial process discipline. What it does extremely well is surface patterns and relationships in data that spreadsheets obscure, refresh reporting faster than month-end manual consolidations, and give finance teams access to their own analysis without waiting for IT to run scripts.

For Dynamics 365 Finance specifically, Power BI connects directly to your financial data through Dataverse, Power BI’s native Dynamics 365 connector, or Azure Synapse Link for larger datasets. This means your dashboards can show live GL balances, budget variances, or cash flow trends without your finance team building and maintaining ETL jobs in Excel. That alone is valuable. It also means your governance and data accuracy problems do not disappear; they become visible much faster.

The Real Cost of Financial Analytics

Most finance organizations underestimate three cost categories when planning Power BI dashboards.

First: Data Preparation and Model Building. Your chart of accounts is not flat. Your GL transactions include reversals, accruals, and period-end corrections. Your budget data lives in multiple systems (ERP, planning tools, legacy spreadsheets). Your actuals do not reconcile automatically to budget because your organization budgets differently than you post GL transactions. Building a semantic model that surfaces truth instead of confusion requires someone (or a team) to understand your financial processes deeply enough to build that logic in Power BI’s data model.

A consultant or senior analyst can build a basic cash flow dashboard in two weeks. Building a GL variance analysis dashboard that your business partner actually trusts because they understand where the numbers came from requires six to eight weeks of data modeling, testing, and refinement. Multiply this by five to ten dashboards, and you are talking about 10 to 15 person-months of skilled analytical work before you have a production-grade Power BI program.

Second: Governance, Security, and Access Control. Power BI’s row-level security (RLS) model is powerful and flexible. It is also complex. If you need controller-level access to consolidated GL but division heads to see only their own GL, and you want budget managers to compare actual to budget within their business unit, you need a well-designed RLS strategy built on top of your Dynamics 365 security roles.

Adding RLS after dashboards are built is expensive. Building it from the start means taking time to model your organizational hierarchy, decide how P&L responsibilities map to GL structures, and test that every user sees exactly what they should. In large organizations, this is not a week-long project. It is often three to six weeks of iterative testing, edge-case resolution, and alignment with your controller’s office.

Third: Change Management and Training. Your finance team has used the same reports for five years. A new dashboard that shows variance differently, calculates metrics in an unfamiliar way, or requires them to self-serve analysis instead of calling the accounting department will be questioned. Finance organizations move slowly because accuracy matters. Spending time to train your finance team, document assumptions in your dashboards, and let them develop confidence in new analytics before expanding access is essential. Organizations that skip this step often see adoption stall after the initial roll-out.

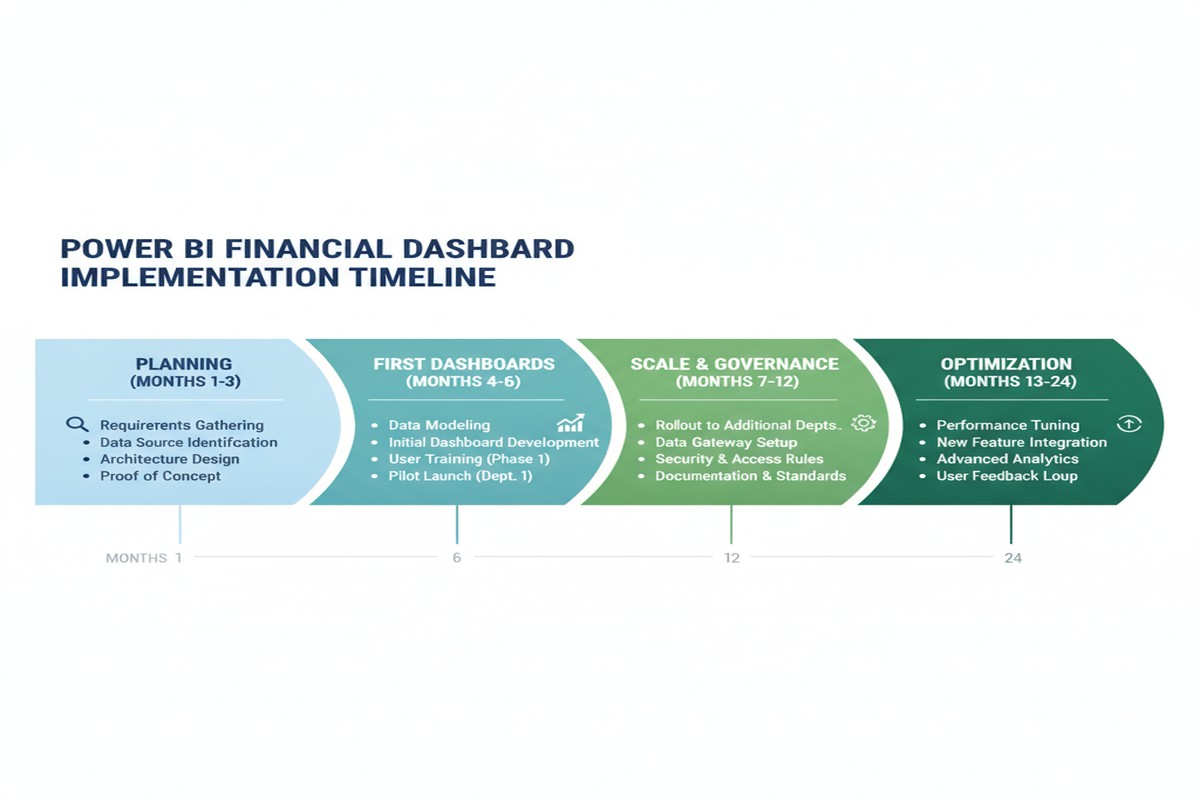
Timeline showing 24-month implementation roadmap for Power BI financial analytics

Timeline Reality for Finance Dashboards

A realistic timeline for a production-grade Power BI financial analytics program looks like this:

Months 1 to 3: Planning, Architecture, and Foundation Building. You define which dashboards matter most. You audit your GL structure and data quality. You design your semantic model. You plan your security model. You do not build dashboards yet. This period is invisible to executives but essential to avoid rebuilding everything later.

Months 4 to 6: First Dashboards and Pilot Testing. You deliver one to two core dashboards (GL overview, budget variance, or cash flow) to a pilot group of power users. You iterate based on their feedback. You refine the data model. You document assumptions. You do not declare victory.

Months 7 to 12: Scale and Governance. You build three to five additional dashboards based on lessons from the pilot. You harden your security model. You establish SLAs for data refresh (daily, hourly). You set up processes for your finance team to request new analysis without recreating dashboards.

Months 13 to 24: Optimization and Organizational Adoption. Your dashboards are live for most of the organization. You optimize performance, add forecasting or predictive capabilities, and integrate with planning tools. Real adoption happens here, not during launch.

Eighteen months is a conservative estimate for a mid-market organization. If you are larger or your GL is more complex, add six months. If you try to compress this to nine months, you will compromise on governance or data quality, and you will pay for it later.

Realistic ROI and Business Case Framework

Financial analytics ROI is real but indirect. You should not expect Power BI alone to reduce headcount. What you should expect is that your finance team spends less time on manual reporting and more time on analysis, and that finance leaders can answer ad hoc questions faster.

For a CFO building a business case, frame the ROI around three levers:

Time Savings. If your month-end close takes ten days and two weeks of follow-up reporting questions, and Power BI cuts that to eight days with faster ad hoc answer time, quantify that. At a typical all-in cost of $200 to $250K annually for a finance analyst, saving 10 to 20 percent of their time across the team is meaningful.

Decision Velocity. Finance leaders who can answer a business partner’s variance question in hours instead of days make better decisions. Quantify this carefully (it is subtle), but it is real. Include it in your business case as a strategic benefit, not just cost savings.

Risk Mitigation. Faster visibility into GL accuracy, budget performance, and cash flow trends reduces surprises at board meetings. This is hard to quantify but worth naming in your business case, especially if you have had historical GL variance issues or cash flow forecasting failures.

Pragmatic Next Steps

Before committing to a large Power BI investment, take these steps:

Start with a pilot. Pick one financial process (GL variance analysis or monthly cash flow forecasting) and build a proof of concept with one to two analysts over 8 to 12 weeks. Spend one week on planning. Spend six weeks on data modeling and development. Spend one week on pilot testing. Use what you learn to scope the larger program.

Assess your data quality. If your GL balances don’t reconcile to your trial balance, or your budget data lives across five systems, fix that first. Power BI will not solve data quality problems; it will highlight them.

Define governance upfront. Decide who owns the semantic model. Decide how often dashboards refresh. Decide how users request new analysis. These decisions are boring but essential.

Budget realistically. A multi-dashboard financial analytics program for a mid-market organization costs between $200K and $500K over 18 to 24 months, including internal team time, consulting, and platform licenses. If your CFO is not comfortable with that range, you are not yet ready for the program.

The Business Case That Actually Works

Power BI for financial analytics delivers real value. The organizations that see that value are those that plan for 18 months, budget realistically, and recognize that the real cost is not the software license or the initial implementation. It is the investment in data quality, governance discipline, and finance team capability that makes analytics actionable.

The demo you saw six months ago was real. You are just building the foundation to support it.


Routeget Technologies helps organizations build data-driven financial organizations through Dynamics 365 Finance implementations and Power BI analytics programs that actually fit your organization’s reality. Reach out to discuss your financial analytics roadmap.

#PowerBIFinance #FinancialAnalytics #DynamicsFinance #BusinessCaseAnalysis #CFOStrategy #FinancialReporting