Multi-Company Consolidation and Intercompany Eliminations in Business Central: Building Predictable Financial Reporting for Multi-Entity Organizations

Multi-company consolidation architecture in Business Central

Most finance leaders in multi-entity organizations face the same uncomfortable question every quarter: when you’ve pushed the consolidation close button, how confident are you that the consolidated revenue number sitting in front of the board actually represents what happened across all your companies? Not the individual piece that’s typically reliable, but the consolidated picture? That’s where consolidation becomes less about compliance and more about survival.

Business Central’s consolidation framework is deceptively straightforward on paper. Transfer general ledger entries from subsidiary companies into a consolidated company, eliminate intercompany transactions, and generate a trial balance. The reality of getting there, especially across multiple environments, different chart of accounts structures, and hundreds of intercompany transactions, is where most implementations hit friction.

The Two Paths to Multi-Entity Financial Reporting

Business Central offers two fundamentally different architectures for consolidation, and choosing between them shapes your entire finance operation.

Native Business Central Consolidation handles multiple subsidiary companies within the same environment. Each subsidiary is a separate legal entity (company), and the consolidated company pulls general ledger entries from all of them into a single trial balance. This works well for organizations with moderate complexity: two to six subsidiaries, similar chart of accounts structures, and predictable intercompany volumes. The native approach requires no additional licensing and runs against your existing Business Central instance.

Cross-Environment Consolidation pulls data across separate Business Central environments, typically when subsidiaries operate independently or have separate implementations. This approach demands Azure app registration and explicit API configuration beyond what most implementations document upfront. It gains you geographic flexibility and organizational autonomy at the cost of architectural complexity that surprises most finance leaders when they discover it.

The decision between these architectures should happen before implementation begins, not halfway through configuration. A CFO running five subsidiaries with different revenue streams should make that choice explicitly based on reporting requirements, not stumble into cross-environment consolidation because someone recommended “a separate environment for that subsidiary.”

Why Intercompany Eliminations Break Without Architecture

Intercompany eliminations are not an accounting problem. They are an architecture problem masquerading as accounting.

A subsidiary books a $500,000 sale to its sister company. The buying subsidiary records a $500,000 purchase from that same sister. The parent company sees $500,000 of revenue and $500,000 of expense moving through its chart of accounts. In a consolidated trial balance, these numbers double-count the same economic transaction, distorting both the consolidated revenue line and gross margin.

Eliminating this intercompany transaction seems straightforward: enter an adjusting entry in the consolidated company’s general journal, reverse out the duplicate revenue and expense, and your consolidated numbers reflect the economic reality of what actually happened outside the company. In practice, this process fails for three reasons that surface repeatedly in multi-entity implementations.

First: Account mapping complexity. When subsidiaries maintain different chart of accounts structures, you cannot simply reverse a $500,000 revenue entry in Subsidiary A against a matching $500,000 purchase entry in Subsidiary B. The account numbers don’t align. You must maintain a separate intercompany chart of accounts and map each subsidiary’s accounts to that shared chart, then map back to the consolidated company’s structure. This creates bidirectional mapping rules that are easy to misconfigure and difficult to audit later.

Second: Dimension fragmentation. Subsidiaries may use different dimensions to slice data. One subsidiary tracks revenue by sales region; another tracks revenue by customer segment. Consolidated reporting demands that these dimensions reconcile or remain separately reportable. Without deliberate dimension strategy upfront, finance teams end up manually reconciling consolidated totals back to subsidiary detail because the consolidated trial balance doesn’t break down by the dimensions that matter to the business.

Third: Timing and currency mismatch. Intercompany eliminations assume the subsidiary’s books match. If the subsidiary records a $500,000 sale in December and the parent records a $500,000 purchase in January, the consolidation period matters. Similarly, when subsidiaries operate in different currencies, the exchange rate used to record the transaction must align with the rate used to record the corresponding entry in the other company, or the elimination fails to net perfectly and leaves a mysterious gain or loss on currency conversion that nobody can explain.

These technical details are finance operations details. They cascade directly into close speed, error rates, and the executive team’s confidence in the numbers.

CFO reviewing consolidated financial statements in Business Central

Practical Path: Right-Sizing the Consolidation Approach

A common failure mode in consolidation implementations is overengineering for tomorrow’s complexity. Organizations build elaborate cross-environment consolidation architectures when today’s requirements could run entirely on native consolidation.

For two to six subsidiaries with predictable intercompany volumes: Start with native Business Central consolidation. It requires no licensing premium, minimizes Azure complexity, and works against your existing environment. The Business Units page becomes your consolidation control center. Test data before running consolidation (the “Test File” or “Test Database” action flags account number and dimension mismatches before they corrupt your close). Generate the Consolidated Trial Balance report (Report 17) and the G/L Consolidation Eliminations report (Report 16) to preview elimination impact before posting adjustments.

For cross-environment requirements or complex subsidiary structures: Allocate implementation time explicitly to Azure app registration, API endpoint configuration, and cross-environment testing. Document which company data moves which direction, which chart of accounts mapping applies at each step, and which dimensions matter to consolidated reporting. This is not something a finance team should discover mid-close.

For intercompany transaction volume above 200 per month: Evaluate ISV extensions like Binary Stream MEM (Multientity Management) or equivalent tools. Native Business Central consolidation handles centralized intercompany payables and receivables adequately, but it is not optimized for mass journal entry processing when intercompany volumes exceed what native functionality was designed for. ISV tools are cost-justified if they reduce manual reconciliation by five to ten hours per close cycle.

Building Eliminations into Your Close Process

Intercompany eliminations work best when they become a defined step in your close calendar, not an afterthought when the numbers don’t match.

Pre-close phase: Publish a “no intercompany transactions after X date” deadline to all subsidiary controllers. Require them to settle open intercompany payables and receivables (the native Business Central Intercompany Transactions module makes this transparent). Running consolidation after that deadline eliminates the problem of transactions in flight.

Consolidation phase: Run the Consolidated Trial Balance report. Compare this to the prior quarter. Material variances should be investigated before finalization. Use the G/L Consolidation Eliminations report to preview the impact of pending adjustments. Only post elimination entries if the consolidated numbers reflect the economic reality the business expects.

Post-close phase: Publish the consolidated trial balance to Finance stakeholders (CFO, Board reporting team, external auditors). Confidence in this number determines trust in all downstream financial statements.

The Bottom Line

Business Central’s consolidation engine solves a real problem: bringing multiple legal entities’ financial data into a single, trusted view. But consolidation success depends entirely on architecture decisions made before implementation starts. Choose between native and cross-environment consolidation explicitly. Map your chart of accounts and dimensions upfront. Define your intercompany elimination rules in writing before you book a single subsidiary transaction.

When you do this work, consolidation becomes predictable. The numbers reconcile. Your close accelerates. The board sees financial statements that actually represent what happened across the organization.

When you don’t, you spend the last three days of every close cycle chasing mysterious variances and rebuilding eliminations by hand.

The difference between those two outcomes isn’t luck. It’s architecture.


About Routeget Technologies: Routeget specializes in Business Central implementations for mid-market organizations with complex multi-entity structures. Our approach begins with consolidation architecture design before any configuration touches the system, ensuring your finance team closes faster with higher accuracy.

#MultiEntityConsolidation #BusinessCentralFinance #ConsolidationAccounting #IntercompanyEliminations #FinanceOperations #CFOStrategy #BusinessCentralCFO


Cash Flow Forecasting in Dynamics 365 Finance: Why AI Predictions Still Miss Working Capital Reality

Cash flow forecasting dashboard showing projected vs actual data with KPI metrics

Most finance teams have spent years building cash flow forecasts in Excel, stitching together data from bank statements, accounts payable systems, and revenue pipelines into spreadsheets that someone updates manually every month. The work is repetitive, the data silos make it unreliable, and by the time the forecast is finished, half of it is already stale. Dynamics 365 Finance Insights offers an escape from that trap through AI-driven cash flow forecasting that learns from historical cash patterns and generates long-term projections automatically. The pitch is compelling: machines eliminate the tedium, surface patterns humans miss, and free finance teams to focus on strategy instead of spreadsheet mechanics.

But there is a critical gap between what the AI model can do and what finance teams actually need it to do. AI-driven cash flow forecasts excel at identifying mathematical patterns in historical data, yet they struggle with the qualitative, forward-looking factors that actually drive cash flow reality: planned capital investments that haven’t yet hit the books, seasonal customer payment behavior changes, supply chain disruptions that will compress inventory holding periods, or a merger that restructures the entire customer base. A finance controller or CFO who relies solely on the AI forecast without layering in business judgment will often walk into a liquidity surprise.

The real value of Dynamics 365 Finance Insights cash flow forecasting is not replacing human judgment but augmenting it. When finance teams use the AI forecast as a starting point and then overlay business context, decision-making velocity accelerates and accuracy improves dramatically. Getting this right requires understanding what the model can and cannot see, knowing when to trust the forecast and when to override it, and building the right governance layer to validate forecasts before they drive working capital decisions.

The Limits of Pattern Recognition in a Complex Cash Cycle

AI models underlying cash flow forecasting in Dynamics 365 Finance are fundamentally pattern-recognition engines. They ingest historical cash inflows and outflows from your bank accounts, accounts receivable aging, accounts payable schedules, and payroll cycles, then use time-series forecasting to extrapolate what comes next. If your company has ten years of data showing that December customer collections spike by 35 percent and February payment to suppliers compresses payables by 20 days, the model will capture those patterns and encode them into future projections. This works well for recurring, predictable dynamics.

What the model cannot see is anything outside its training window that will reshape cash behavior going forward. If your company just signed a contract to pay a major vendor upfront instead of on net-60 terms, the model knows nothing about it until that transaction flows through the bank. If you are planning to divest a business unit, the cash flow impact of losing that customer’s collections will not appear in the forecast until after the divestment occurs. If a customer base mix shift is underway (moving from long-tail small customers to a few large enterprise accounts), payment velocity and working capital requirements will change, but the model is still extrapolating patterns from a customer composition that no longer matches reality.

These are not failures of the AI model. They are inherent constraints on what backward-looking pattern recognition can accomplish in a forward-looking world. A CFO charting course for a 24-month cash position that blindly follows the AI forecast without accounting for known strategic changes is making a decision on stale information, regardless of how sophisticated the underlying algorithm is.

Cash flow forecasting dashboard showing projected vs actual data with KPI metrics

Where AI Forecasts Add Immediate Value

The practical value of Dynamics 365 Finance Insights cash flow forecasting becomes clear when you deploy it specifically for what it does well: automating the baseline forecast that captures recurring cash patterns. Instead of a finance controller manually updating a spreadsheet with assumptions about seasonal collections patterns, payroll cycles, and vendor payment terms, the AI model learns these patterns and generates updated projections whenever new transactional data arrives. The baseline becomes self-updating, and the finance team shifts focus from mechanical forecasting to exception-based analysis.

Dynamics 365 Finance Insights also surfaces forecast accuracy metrics, showing finance teams how well the model predicted actual cash outcomes over trailing periods. This feedback loop is valuable, because it reveals whether patterns the model identified have remained stable or have shifted. If the model historically predicted collections within plus-or-minus 3 percent but suddenly starts missing by 8 percent, that is a signal that underlying customer payment behavior has changed and warrants investigation.

What-if scenario analysis is another capability that multiplies the value of AI-driven forecasting. Once the baseline forecast is in place, finance teams can create alternate scenarios representing different business conditions (optimistic growth, pessimistic demand, recession response) and overlay them on top of the baseline. This capability let you rapidly explore how cash positions respond to different strategic choices without rebuilding the entire forecast from scratch.

The Three Scenarios Where AI Forecasts Lead Finance Teams Astray

Reliance on AI-only cash forecasting becomes problematic in specific, predictable scenarios that every finance team encounters:

Structural changes to cash flow drivers. When your business model shifts, historical patterns become unreliable. If you transition from on-premises software licensing (lump-sum collections upfront) to a subscription SaaS model (monthly recurring revenue spread over years), the AI model trained on your old licensing pattern will dramatically overforecast near-term collections. The model needs retraining on new data, but that can take months. In the interim, finance teams need human judgment to reframe the forecast against the new revenue model, or they will drastically overestimate liquidity.

One-time events with material cash impact. A large customer prepayment, a debt refinancing, an asset sale, a business combination, or an unexpected insurance recovery all create cash movements the model has no historical precedent for. These events typically require advance knowledge and business context to forecast. If a CFO knows a customer prepayment of $20 million is coming in Q2 but the AI model knows nothing about it, the combined view (baseline forecast plus known one-timers) is far more useful than either alone.

Seasonal and cyclical patterns that have shifted over time. AI models can capture long-term seasonal patterns, but if the magnitude or timing of seasonality has changed, the model can lag in detecting and adapting to that shift. A company that has historically seen strong Q4 collections might have shifted to a more consistent quarterly pattern due to customer base changes. The model will still expect a Q4 spike based on historical data, whereas a finance controller watching year-over-year trends will notice the pattern has evolved and adjust accordingly.

In all three scenarios, the disconnect is the same: the AI model is solving for accuracy on historical patterns, while finance teams are solving for visibility into forward cash positions shaped by strategy, one-off events, and changing market conditions. Neither is wrong. They are just operating on different time horizons and information sets.

Finance team reviewing cash flow forecasts and working capital data on dashboard systems

Building Governance Around AI Forecasts

The path to effective AI-driven cash flow forecasting in Dynamics 365 Finance is not to replace human judgment but to institutionalize how the two interact. This requires a lightweight governance framework that clarifies when the AI forecast is trusted as-is, when it needs overlay, and who is responsible for validating the forecast before it drives working capital decisions.

Start by establishing a forecast validation workflow that requires the finance controller or working capital manager to review and sign off on cash forecasts before they are used for liquidity planning or short-term borrowing decisions. This review should be structured and quick, not bureaucratic. The reviewer should check three things: Does the forecast direction match current business trends? Are known one-time cash events accounted for? Are there any recent structural changes to the business (pricing model shift, customer mix evolution, payment term changes) that the AI model would not yet have learned?

If the answers are yes, the AI forecast can proceed unchanged. If the answers are no, the review process should support rapid overlay of business context. Dynamics 365 Finance Insights allows finance teams to create scenario variants and what-if analyses that can quickly model known events or strategic changes on top of the baseline forecast. This is not rebuilding a forecast in Excel; it is using the system to layer business judgment on top of the AI baseline.

Over time, as the AI model learns from corrected forecasts and forecast validation patterns, the lag between model behavior and business reality should narrow. A finance team might discover that 80 percent of forecasts pass validation without change, while 20 percent require overlay of known one-timers or cyclical pattern adjustments. Documenting those patterns helps you identify where the model needs retraining or where business context should be automatically fed back into the forecasting process.

The Compound Effect of Forecast Discipline

Finance leaders often underestimate the leverage of accurate cash flow forecasting on decision-making velocity. If a CFO has high-confidence visibility into 24-month cash position, working capital decisions that would otherwise require contingency buffers can be optimized. Seasonal borrowing decisions become more predictable. Investment in accounts receivable improvement initiatives can be prioritized based on forecast impact. Strategic decisions about capital allocation, debt paydown, and dividend policies can be made with clearer information about future liquidity.

Conversely, a forecast that the CFO does not trust becomes either a shelf-ware artifact that no one uses, or worse, a forecast that is blindly followed and leads to strategic surprises. Many companies keep a spreadsheet forecast alongside their ERP forecast precisely because they do not trust the system forecast.

The investment in building governance discipline around AI-driven forecasting is usually small relative to its impact. A monthly 30-minute forecast review and validation workflow, combined with clear ownership for feeding business context back into the system, is enough to shift AI forecasts from mathematical curiosities to operational planning tools.

Making the Shift from Manual to Augmented Forecasting

The transition from Excel-based forecasting to AI-driven forecasting in Dynamics 365 Finance requires more than just enabling the feature. It requires reframing how finance teams think about forecasting: not as a document to be produced, but as an ongoing process that blends machine intelligence with human business judgment. The AI model generates the baseline, eliminating the mechanical work. Finance controllers validate and contextualize it, adding business judgment. Together, the two create a forecast that is both statistically grounded and strategically sound.

Organizations that make this transition successfully are usually those that treat the AI forecast as the starting point for a conversation, not the destination. They ask: Where does the forecast seem right, and where does business knowledge suggest it should be adjusted? What events on the horizon will reshape cash patterns that the model does not yet know about? How can we feed that business context back into the system to continuously improve forecast quality?

These questions shift forecasting from a cost center (people spending time in spreadsheets) to a strategic process (finance contributing to working capital optimization and capital allocation decisions). The shift is not automatic. It requires discipline, clear ownership, and a commitment to treating forecasts as living documents that evolve as business conditions change. But the payoff for finance organizations disciplined enough to make the shift is significant: better visibility, faster decision-making, and working capital strategies grounded in both mathematical rigor and business reality.

At Routeget Technologies, we help organizations build governance discipline around financial analytics and forecasting, ensuring that AI-driven insights inform rather than replace strategic decision-making. If you are implementing cash flow forecasting in Dynamics 365 Finance and want to ensure adoption and accuracy, our consulting team can help design the validation workflows and governance structure that turn machine forecasts into actionable business intelligence.

#DynamicsFinance #CashFlowForecasting #FinanceInsights #WorkingCapitalOptimization #CFOStrategy #FinancialPlanning #DynamicsF&O

Project Profitability in Dynamics 365 Project Operations: Why Your Project Margins Fail Without Proper Accounting Setup

Dynamics 365 Project Operations financial dashboard showing project profitability metrics

A professional services firm running Dynamics 365 Project Operations pulls its monthly margin report and finds something that doesn’t match reality on the ground. One fixed-price engagement shows a 60 percent margin despite the delivery team saying they’ve been slammed for weeks. Another time-and-materials project shows a loss even though every hour logged was billed. Nobody misused the system. Nobody entered a wrong number. The transactions are all correct, and the margins are still wrong, because project profitability in Dynamics 365 Project Operations is decided by the accounting setup behind those transactions, not by the transactions themselves.

Dynamics 365 Project Operations financial dashboard showing project profitability metrics

Two Price Lists, One Easy Mix-Up

Project Operations resolves cost and revenue through separate price lists, and the distinction matters more than the name suggests. A cost price list resolves the rates used on cost-type estimate and actual transactions, essentially what a resource actually costs the business. A sales price list resolves the rates used on the billed and unbilled sales side, essentially what gets charged to the customer. Each is set to a context, Cost or Sales, and that context governs how the system looks the record up. Set a list to the wrong context and price resolution simply fails to find a rate where one should exist.

Sales price lists carry another constraint cost lists don’t: they’re locked to the currency defined on the list header, while cost price lists can hold role prices in other currencies through user setup overrides. That asymmetry catches multinational firms more often than it should, particularly when a role price gets added to a sales list in the wrong currency and the transaction silently falls back to a default rate instead of erroring out. Sales price lists also have to be explicitly attached, to a customer’s project price list, a project quote, or a project contract, before they apply to anything; a rate sitting correctly configured but never attached to the contract in play won’t be used. Add date ranges into the mix, since price lists apply based on start and end dates, and a gap between two lists means a stretch of transactions with no applicable rate at all.

Where Margin Actually Gets Decided

Price lists set the numbers going into a transaction. What happens to those numbers on the ledger, which is what actually produces a margin figure, is governed by a separate configuration object: the project cost and revenue profile, found under Project management and accounting, Setup, Posting. This is the part of the setup that gets underinvested in relative to how much leverage it has over reported profitability.

The ledger settings on a profile decide, transaction type by transaction type, hour, expense, item, whether costs post straight to the profit and loss statement or sit on the balance sheet as work in progress until someone runs a separate posting step. They also decide whether on-account, milestone-based invoicing lands in a balance account or a P&L account, and whether unbilled revenue gets accrued to the general ledger at all. None of these settings are visible on the transaction itself. A time entry looks identical whether its hours are configured to post immediately or to wait in WIP, which is exactly why a wrong setting here doesn’t throw an error. It just quietly changes what shows up as margin.

Finance professional reviewing project accounting and cost allocation data

Fixed-Price Work Needs Its Own Logic

Time-and-materials projects recognize revenue roughly as work happens, so the profile settings above cover most of what matters. Fixed-price projects need an additional layer, because the billing schedule and the actual delivery pace are two different things, and the whole point of the accounting setup is to keep them from contaminating each other. Project Operations offers three methods here. Completed contract holds all revenue and cost recognition until the project finishes, carrying everything as WIP in the meantime. Completed percentage accrues revenue periodically based on how much of the project is actually done, using cost templates to group transactions for the percentage-complete calculation and period codes to set how often that calculation runs. No WIP skips the deferral entirely and is meant for short engagements where invoicing and cost recognition happen close enough together that deferral adds nothing but complexity.

A firm running long, milestone-heavy fixed-price engagements under a “no WIP” setup, because that was the default nobody revisited, will see revenue and cost recognized in whatever period the invoice happens to fall in rather than the period the work actually happened in. Margins swing from project to project not because delivery efficiency is inconsistent, but because the accounting method assumes short-cycle work being applied to long-cycle contracts.

Five Specific Ways This Goes Wrong

A handful of misconfiguration patterns show up repeatedly enough to be worth naming directly. A billing method mismatch, where time is set to fixed-price logic on what’s actually a time-and-materials engagement, or the reverse, throws off exactly when hours or expenses hit revenue relative to when they’re billed. A missed manual step is just as damaging: when hour or expense costs are set to post to a balance account rather than profit and loss, someone has to run the “post costs” function to move them into P&L, and if that step is skipped, costs simply never show up against revenue, producing a margin that looks better than it is. A mismatched revenue recognition method does similar damage from the other direction, completed contract selected on the profile while revenue is somehow still being accrued on a monthly cadence, which mismatches costs and revenue by period and makes margins swing without any real change in delivery.

The accrual settings create a subtler trap. Revenue accrual turned on for a time-and-materials engagement whose cost posting is set to “no ledger” produces transactions where revenue is recognized but the matching cost is never posted anywhere, which can show as a margin approaching 100 percent on paper. And on-account invoicing routed to a profit and loss account instead of a balance account recognizes milestone billings as revenue immediately, ahead of the delivery they’re meant to represent, front-loading margin into whichever period the invoice happens to land in.

Getting Project Profitability Right Before the Numbers Matter

None of this is complicated once it’s named, but it has to be checked deliberately rather than assumed. Start by confirming which billing method, time-and-materials or fixed-price, is actually assigned to each active profile, and cross-check that against how the contracts using that profile are actually structured. Walk the ledger settings for each transaction type and confirm someone owns the recurring job of running the “post costs” function if any type is set to balance posting, since that step doesn’t run itself. For fixed-price work, match the recognition method to the actual shape of the engagement rather than the platform default, short and simple work can reasonably use no WIP, but anything spanning multiple billing cycles needs completed percentage with cost templates that actually reflect how the project’s cost mix is structured. Finally, verify that profile assignment rules, by contract, project group, or individual project, are actually routing each engagement to the profile that matches how it’s billed, since a firm running several contract types often has profiles that were configured correctly once and then silently misapplied as the portfolio grew.

Routeget Technologies has walked in behind project-based businesses whose delivery teams were being blamed for margin problems that turned out to live entirely in the posting configuration, not the work. Reconciling that gap usually takes a focused audit of the profile settings against a sample of actual contracts, not a re-implementation, and it tends to be one of the highest-leverage half-days a Project Operations environment can spend.


#ProjectProfitability #ProjectAccounting #ProjectOperations #RevenueRecognition #WIPAccounting #CFOStrategy

Power BI Financial Dashboards for Dynamics 365 Finance: Building the Business Case Without Overcommitting Resources

Power BI financial dashboard with budget variance analysis and cash flow metrics

Your Dynamics 365 Finance implementation is live. You saw a beautiful demo six months ago showing real-time cash flow forecasts, interactive budget variance analysis, and executive dashboards that updated daily. The vendor closed by saying, “You can build this in Power BI in a few weeks.”

Now, three months into your Power BI financial analytics initiative, your internal team is debating whether to hire a permanent analytics hire, your costs have tripled, and you’re six weeks behind on the first dashboard. That demo didn’t account for your Chart of Accounts structure complexity, your subsidiaries’ separate accounting policies, or the fact that your finance team still reconciles GL accounts in a spreadsheet no amount of automation can entirely replace.

This gap between demo and reality is not unusual. It is the norm. Finance organizations that understand this gap upfront build realistic programs that deliver value in 18 to 24 months. Those that don’t end up with abandoned dashboards, frustrated finance teams, and justifiably skeptical CFOs.

What Power BI Actually Brings to Finance

Power BI is a visualization and analytics tool. It is not magic, and it is not a substitute for good financial process discipline. What it does extremely well is surface patterns and relationships in data that spreadsheets obscure, refresh reporting faster than month-end manual consolidations, and give finance teams access to their own analysis without waiting for IT to run scripts.

For Dynamics 365 Finance specifically, Power BI connects directly to your financial data through Dataverse, Power BI’s native Dynamics 365 connector, or Azure Synapse Link for larger datasets. This means your dashboards can show live GL balances, budget variances, or cash flow trends without your finance team building and maintaining ETL jobs in Excel. That alone is valuable. It also means your governance and data accuracy problems do not disappear; they become visible much faster.

The Real Cost of Financial Analytics

Most finance organizations underestimate three cost categories when planning Power BI dashboards.

First: Data Preparation and Model Building. Your chart of accounts is not flat. Your GL transactions include reversals, accruals, and period-end corrections. Your budget data lives in multiple systems (ERP, planning tools, legacy spreadsheets). Your actuals do not reconcile automatically to budget because your organization budgets differently than you post GL transactions. Building a semantic model that surfaces truth instead of confusion requires someone (or a team) to understand your financial processes deeply enough to build that logic in Power BI’s data model.

A consultant or senior analyst can build a basic cash flow dashboard in two weeks. Building a GL variance analysis dashboard that your business partner actually trusts because they understand where the numbers came from requires six to eight weeks of data modeling, testing, and refinement. Multiply this by five to ten dashboards, and you are talking about 10 to 15 person-months of skilled analytical work before you have a production-grade Power BI program.

Second: Governance, Security, and Access Control. Power BI’s row-level security (RLS) model is powerful and flexible. It is also complex. If you need controller-level access to consolidated GL but division heads to see only their own GL, and you want budget managers to compare actual to budget within their business unit, you need a well-designed RLS strategy built on top of your Dynamics 365 security roles.

Adding RLS after dashboards are built is expensive. Building it from the start means taking time to model your organizational hierarchy, decide how P&L responsibilities map to GL structures, and test that every user sees exactly what they should. In large organizations, this is not a week-long project. It is often three to six weeks of iterative testing, edge-case resolution, and alignment with your controller’s office.

Third: Change Management and Training. Your finance team has used the same reports for five years. A new dashboard that shows variance differently, calculates metrics in an unfamiliar way, or requires them to self-serve analysis instead of calling the accounting department will be questioned. Finance organizations move slowly because accuracy matters. Spending time to train your finance team, document assumptions in your dashboards, and let them develop confidence in new analytics before expanding access is essential. Organizations that skip this step often see adoption stall after the initial roll-out.

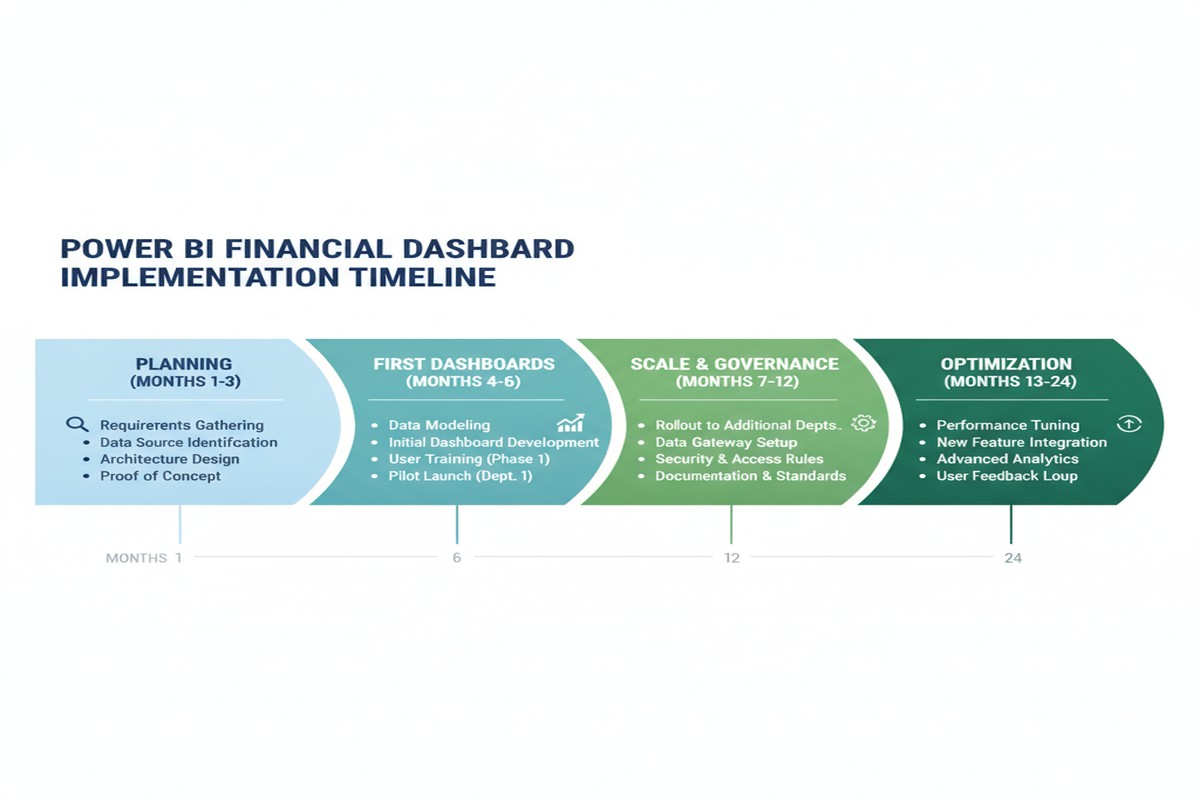
Timeline showing 24-month implementation roadmap for Power BI financial analytics

Timeline Reality for Finance Dashboards

A realistic timeline for a production-grade Power BI financial analytics program looks like this:

Months 1 to 3: Planning, Architecture, and Foundation Building. You define which dashboards matter most. You audit your GL structure and data quality. You design your semantic model. You plan your security model. You do not build dashboards yet. This period is invisible to executives but essential to avoid rebuilding everything later.

Months 4 to 6: First Dashboards and Pilot Testing. You deliver one to two core dashboards (GL overview, budget variance, or cash flow) to a pilot group of power users. You iterate based on their feedback. You refine the data model. You document assumptions. You do not declare victory.

Months 7 to 12: Scale and Governance. You build three to five additional dashboards based on lessons from the pilot. You harden your security model. You establish SLAs for data refresh (daily, hourly). You set up processes for your finance team to request new analysis without recreating dashboards.

Months 13 to 24: Optimization and Organizational Adoption. Your dashboards are live for most of the organization. You optimize performance, add forecasting or predictive capabilities, and integrate with planning tools. Real adoption happens here, not during launch.

Eighteen months is a conservative estimate for a mid-market organization. If you are larger or your GL is more complex, add six months. If you try to compress this to nine months, you will compromise on governance or data quality, and you will pay for it later.

Realistic ROI and Business Case Framework

Financial analytics ROI is real but indirect. You should not expect Power BI alone to reduce headcount. What you should expect is that your finance team spends less time on manual reporting and more time on analysis, and that finance leaders can answer ad hoc questions faster.

For a CFO building a business case, frame the ROI around three levers:

Time Savings. If your month-end close takes ten days and two weeks of follow-up reporting questions, and Power BI cuts that to eight days with faster ad hoc answer time, quantify that. At a typical all-in cost of $200 to $250K annually for a finance analyst, saving 10 to 20 percent of their time across the team is meaningful.

Decision Velocity. Finance leaders who can answer a business partner’s variance question in hours instead of days make better decisions. Quantify this carefully (it is subtle), but it is real. Include it in your business case as a strategic benefit, not just cost savings.

Risk Mitigation. Faster visibility into GL accuracy, budget performance, and cash flow trends reduces surprises at board meetings. This is hard to quantify but worth naming in your business case, especially if you have had historical GL variance issues or cash flow forecasting failures.

Pragmatic Next Steps

Before committing to a large Power BI investment, take these steps:

Start with a pilot. Pick one financial process (GL variance analysis or monthly cash flow forecasting) and build a proof of concept with one to two analysts over 8 to 12 weeks. Spend one week on planning. Spend six weeks on data modeling and development. Spend one week on pilot testing. Use what you learn to scope the larger program.

Assess your data quality. If your GL balances don’t reconcile to your trial balance, or your budget data lives across five systems, fix that first. Power BI will not solve data quality problems; it will highlight them.

Define governance upfront. Decide who owns the semantic model. Decide how often dashboards refresh. Decide how users request new analysis. These decisions are boring but essential.

Budget realistically. A multi-dashboard financial analytics program for a mid-market organization costs between $200K and $500K over 18 to 24 months, including internal team time, consulting, and platform licenses. If your CFO is not comfortable with that range, you are not yet ready for the program.

The Business Case That Actually Works

Power BI for financial analytics delivers real value. The organizations that see that value are those that plan for 18 months, budget realistically, and recognize that the real cost is not the software license or the initial implementation. It is the investment in data quality, governance discipline, and finance team capability that makes analytics actionable.

The demo you saw six months ago was real. You are just building the foundation to support it.


Routeget Technologies helps organizations build data-driven financial organizations through Dynamics 365 Finance implementations and Power BI analytics programs that actually fit your organization’s reality. Reach out to discuss your financial analytics roadmap.

#PowerBIFinance #FinancialAnalytics #DynamicsFinance #BusinessCaseAnalysis #CFOStrategy #FinancialReporting