Business Central Cash Flow Forecasting: Automating Liquidity Planning with Predictive Analytics

Liquidity crises don’t announce themselves with executive summaries. They arrive as surprise calls from your bank about minimum balances, or as the discovery that payroll runway is tighter than expected while a major customer delays payment. For finance leaders managing mid-market organizations, cash flow visibility is survival insurance. Yet many organizations running Business Central still manage cash forecasts through spreadsheets, updated manually from GL balances and supplemented with guesswork about receivables collection and vendor payment timing.

The gap between current cash position and next month’s reality creates planning risk that traditional monthly close cycles don’t adequately address. Business Central’s native cash flow forecasting capabilities address this by combining historical transaction patterns, outstanding payables and receivables aging, and configurable forecast accounts into a forward-looking view of liquidity. When properly configured and monitored, this capability shifts cash planning from reactive expense management to proactive decision-making, allowing CFOs and Finance Directors to identify shortfalls weeks in advance and make informed decisions about debt facilities, capital allocation, or working capital optimization.

Why Cash Flow Forecasting Matters Beyond the Accounting Function

Cash flow forecasting in Business Central isn’t a finance tool with secondary business utility. It’s a business planning instrument that affects debt capacity, supplier relationship decisions, and strategic flexibility. Consider a growing organization that tightly manages working capital through careful buyer payment terms and customer payment incentives. Without forward visibility into cash position, the finance team must either (1) maintain excessive cash reserves to absorb unexpected volatility, which ties up capital otherwise deployed to growth, or (2) accept ongoing uncertainty and maintain standby credit facilities at higher-than-necessary cost because the organization cannot demonstrate stable cash predictability to its lenders.

Business Central’s cash flow forecast addresses this directly. By automating the aggregation of aged receivables and payables, overlay with account schedules that represent recurring cash activities (payroll, rent, debt service), and then extending forward using configurable assumptions about customer collection patterns, the system produces a documented, repeatable forecast that reflects the organization’s actual cash dynamics rather than generic assumptions.

How Business Central Structures Cash Flow Forecasting

Business Central organizes cash flow analysis around cash flow accounts, which represent categorized sources and uses of cash. The system maintains a hierarchy of these accounts, allowing organizations to forecast at summary levels (Operating Activities, Investing Activities, Financing Activities aligned to cash flow statement presentation) or drill into operational detail (Receivables Collection, Payables Disbursement, Payroll, Tax Payments, Debt Service). Finance teams configure which GL accounts map into which cash flow account, establishing a bridge between the accounting records and the forward-looking cash position.

Once configured, the forecast calculation follows a systematic process. The system queries aged receivables and aged payables for the foreseeable period. For receivables, it applies configured collection percentages (for example, assume 70 percent of current invoices collect within 30 days, 25 percent within 60 days, remainder within 90 days), generating a cash receipt forecast. For payables, it applies payment assumptions by vendor or age band. The system supplements this with manual forecast entries for known non-transaction items like salary expenses, loan payments, dividend distributions, or seasonal adjustments.

The result is a line-by-line, month-by-month forecast of cash inflows and outflows, typically extending 6 to 13 months into the future, depending on the organization’s planning horizon. This forecast can then be compared against actual cash balances, current debt capacity, and minimum balance requirements to expose timing mismatches or shortfalls well before they become operational constraints.

Practical Implementation: Moving Beyond the Setup Screen

The capability exists in Business Central, but its value depends on disciplined configuration and ongoing refinement. Many organizations implement cash flow forecasting, run a few reports, then set it aside because the forecasts consistently miss or require heavy manual adjustment. The gap usually traces to one of a few common implementation missteps.

First, the collection and payment assumptions must reflect your organization’s actual behavior, not generic textbook percentages. If your customer concentration is high, or your largest customers consistently pay on unique terms, the default 30-60-90 collection assumptions will not reflect reality. The first iteration of the forecast should be calibrated by comparing prior-year actuals against the forecast for the same periods, allowing the finance team to refine assumptions based on observed patterns.

Second, the configuration must account for known variations in cash timing. Payroll in most organizations is highly predictable. Seasonal businesses face known patterns of inventory buildup, collection acceleration, and vendor payments concentrated in specific quarters. Utilities, insurance, and tax payments arrive at known intervals. Loan amortization follows documented schedules. These should be explicitly configured in the forecast rather than treated as unknowns or manually adjusted each reporting period. The effort to establish this detail upfront compounds over time through reduced maintenance and more accurate projections.

Third, the forecast must distinguish between operational cash flows and financial and strategic cash flows. Operating forecasts driven by receivables, payables, and recurring GL entries capture the core business cash generation and consumption. But major capital equipment purchases, debt issuances or repayment, dividend distributions, or acquisition activity operate on different planning cycles and should be configurable separately so the forecast remains clean and interpretable.

Linking Forecast Accuracy to Working Capital Decisions

A well-maintained cash flow forecast becomes decision infrastructure. Finance teams use it to answer questions that directly affect operational and financial strategy: Can we accelerate vendor payments to capture early-pay discounts without constraining liquidity? Should we invest in supply chain financing programs that extend payables without impacting supplier relationships? Do we need to establish additional credit facilities for seasonal working capital, or is our cash generation sufficient? What is our realistic payoff timeline for outstanding debt? Can we fund a capital investment from operations, or must we raise external capital?

Organizations that treat the Business Central cash forecast as a static monthly ritual rather than a dynamic planning tool forfeit this benefit. The forecast should be refreshed at minimum monthly, ideally with a rolling 13-month horizon so planning always extends at least one full year forward. Variance analysis comparing prior-month forecasts against actual results informs assumptions refinement and builds confidence in the forecast’s reliability over time.

Moving Forward: From Spreadsheets to Integrated Planning

The transition from spreadsheet cash planning to Business Central’s integrated forecast model requires an initial investment in configuration and assumption refinement, but the payoff arrives quickly. Finance teams regain the hours lost to manual consolidation. The forecast becomes auditable and repeatable. New team members inherit a system of record rather than undocumented spreadsheet logic. Most importantly, the organization gains the cash visibility that underpins confident capital decisions and the liquidity management discipline that lenders and investors value.

For CFOs and Finance Directors overseeing mid-market organizations, Business Central’s cash flow forecasting is a capability that should be treated not as a reporting feature but as a core strategic planning tool. Configured thoughtfully and maintained rigorously, it transforms cash management from spreadsheet guesswork into data-driven planning.

Routeget Technologies specializes in Business Central implementation and financial process optimization for mid-market organizations. Our consulting teams help organizations configure cash flow forecasting, establish financial close automation, and optimize working capital strategies to align with business growth objectives.

#BusinessCentralCashFlow #LiquidityPlanning #WorkingCapitalManagement #BusinessCentralFinance #CFOInsights #CashFlowForecasting #FinancialPlanning #MidMarketERP


Multi-Company Consolidation and Intercompany Eliminations in Business Central: Building Predictable Financial Reporting for Multi-Entity Organizations

Multi-company consolidation architecture in Business Central

Most finance leaders in multi-entity organizations face the same uncomfortable question every quarter: when you’ve pushed the consolidation close button, how confident are you that the consolidated revenue number sitting in front of the board actually represents what happened across all your companies? Not the individual piece that’s typically reliable, but the consolidated picture? That’s where consolidation becomes less about compliance and more about survival.

Business Central’s consolidation framework is deceptively straightforward on paper. Transfer general ledger entries from subsidiary companies into a consolidated company, eliminate intercompany transactions, and generate a trial balance. The reality of getting there, especially across multiple environments, different chart of accounts structures, and hundreds of intercompany transactions, is where most implementations hit friction.

The Two Paths to Multi-Entity Financial Reporting

Business Central offers two fundamentally different architectures for consolidation, and choosing between them shapes your entire finance operation.

Native Business Central Consolidation handles multiple subsidiary companies within the same environment. Each subsidiary is a separate legal entity (company), and the consolidated company pulls general ledger entries from all of them into a single trial balance. This works well for organizations with moderate complexity: two to six subsidiaries, similar chart of accounts structures, and predictable intercompany volumes. The native approach requires no additional licensing and runs against your existing Business Central instance.

Cross-Environment Consolidation pulls data across separate Business Central environments, typically when subsidiaries operate independently or have separate implementations. This approach demands Azure app registration and explicit API configuration beyond what most implementations document upfront. It gains you geographic flexibility and organizational autonomy at the cost of architectural complexity that surprises most finance leaders when they discover it.

The decision between these architectures should happen before implementation begins, not halfway through configuration. A CFO running five subsidiaries with different revenue streams should make that choice explicitly based on reporting requirements, not stumble into cross-environment consolidation because someone recommended “a separate environment for that subsidiary.”

Why Intercompany Eliminations Break Without Architecture

Intercompany eliminations are not an accounting problem. They are an architecture problem masquerading as accounting.

A subsidiary books a $500,000 sale to its sister company. The buying subsidiary records a $500,000 purchase from that same sister. The parent company sees $500,000 of revenue and $500,000 of expense moving through its chart of accounts. In a consolidated trial balance, these numbers double-count the same economic transaction, distorting both the consolidated revenue line and gross margin.

Eliminating this intercompany transaction seems straightforward: enter an adjusting entry in the consolidated company’s general journal, reverse out the duplicate revenue and expense, and your consolidated numbers reflect the economic reality of what actually happened outside the company. In practice, this process fails for three reasons that surface repeatedly in multi-entity implementations.

First: Account mapping complexity. When subsidiaries maintain different chart of accounts structures, you cannot simply reverse a $500,000 revenue entry in Subsidiary A against a matching $500,000 purchase entry in Subsidiary B. The account numbers don’t align. You must maintain a separate intercompany chart of accounts and map each subsidiary’s accounts to that shared chart, then map back to the consolidated company’s structure. This creates bidirectional mapping rules that are easy to misconfigure and difficult to audit later.

Second: Dimension fragmentation. Subsidiaries may use different dimensions to slice data. One subsidiary tracks revenue by sales region; another tracks revenue by customer segment. Consolidated reporting demands that these dimensions reconcile or remain separately reportable. Without deliberate dimension strategy upfront, finance teams end up manually reconciling consolidated totals back to subsidiary detail because the consolidated trial balance doesn’t break down by the dimensions that matter to the business.

Third: Timing and currency mismatch. Intercompany eliminations assume the subsidiary’s books match. If the subsidiary records a $500,000 sale in December and the parent records a $500,000 purchase in January, the consolidation period matters. Similarly, when subsidiaries operate in different currencies, the exchange rate used to record the transaction must align with the rate used to record the corresponding entry in the other company, or the elimination fails to net perfectly and leaves a mysterious gain or loss on currency conversion that nobody can explain.

These technical details are finance operations details. They cascade directly into close speed, error rates, and the executive team’s confidence in the numbers.

CFO reviewing consolidated financial statements in Business Central

Practical Path: Right-Sizing the Consolidation Approach

A common failure mode in consolidation implementations is overengineering for tomorrow’s complexity. Organizations build elaborate cross-environment consolidation architectures when today’s requirements could run entirely on native consolidation.

For two to six subsidiaries with predictable intercompany volumes: Start with native Business Central consolidation. It requires no licensing premium, minimizes Azure complexity, and works against your existing environment. The Business Units page becomes your consolidation control center. Test data before running consolidation (the “Test File” or “Test Database” action flags account number and dimension mismatches before they corrupt your close). Generate the Consolidated Trial Balance report (Report 17) and the G/L Consolidation Eliminations report (Report 16) to preview elimination impact before posting adjustments.

For cross-environment requirements or complex subsidiary structures: Allocate implementation time explicitly to Azure app registration, API endpoint configuration, and cross-environment testing. Document which company data moves which direction, which chart of accounts mapping applies at each step, and which dimensions matter to consolidated reporting. This is not something a finance team should discover mid-close.

For intercompany transaction volume above 200 per month: Evaluate ISV extensions like Binary Stream MEM (Multientity Management) or equivalent tools. Native Business Central consolidation handles centralized intercompany payables and receivables adequately, but it is not optimized for mass journal entry processing when intercompany volumes exceed what native functionality was designed for. ISV tools are cost-justified if they reduce manual reconciliation by five to ten hours per close cycle.

Building Eliminations into Your Close Process

Intercompany eliminations work best when they become a defined step in your close calendar, not an afterthought when the numbers don’t match.

Pre-close phase: Publish a “no intercompany transactions after X date” deadline to all subsidiary controllers. Require them to settle open intercompany payables and receivables (the native Business Central Intercompany Transactions module makes this transparent). Running consolidation after that deadline eliminates the problem of transactions in flight.

Consolidation phase: Run the Consolidated Trial Balance report. Compare this to the prior quarter. Material variances should be investigated before finalization. Use the G/L Consolidation Eliminations report to preview the impact of pending adjustments. Only post elimination entries if the consolidated numbers reflect the economic reality the business expects.

Post-close phase: Publish the consolidated trial balance to Finance stakeholders (CFO, Board reporting team, external auditors). Confidence in this number determines trust in all downstream financial statements.

The Bottom Line

Business Central’s consolidation engine solves a real problem: bringing multiple legal entities’ financial data into a single, trusted view. But consolidation success depends entirely on architecture decisions made before implementation starts. Choose between native and cross-environment consolidation explicitly. Map your chart of accounts and dimensions upfront. Define your intercompany elimination rules in writing before you book a single subsidiary transaction.

When you do this work, consolidation becomes predictable. The numbers reconcile. Your close accelerates. The board sees financial statements that actually represent what happened across the organization.

When you don’t, you spend the last three days of every close cycle chasing mysterious variances and rebuilding eliminations by hand.

The difference between those two outcomes isn’t luck. It’s architecture.


About Routeget Technologies: Routeget specializes in Business Central implementations for mid-market organizations with complex multi-entity structures. Our approach begins with consolidation architecture design before any configuration touches the system, ensuring your finance team closes faster with higher accuracy.

#MultiEntityConsolidation #BusinessCentralFinance #ConsolidationAccounting #IntercompanyEliminations #FinanceOperations #CFOStrategy #BusinessCentralCFO

Business Central Inventory Valuation Methods: Why FIFO, LIFO, and Weighted Average Choices Reshape Working Capital and Tax Liability

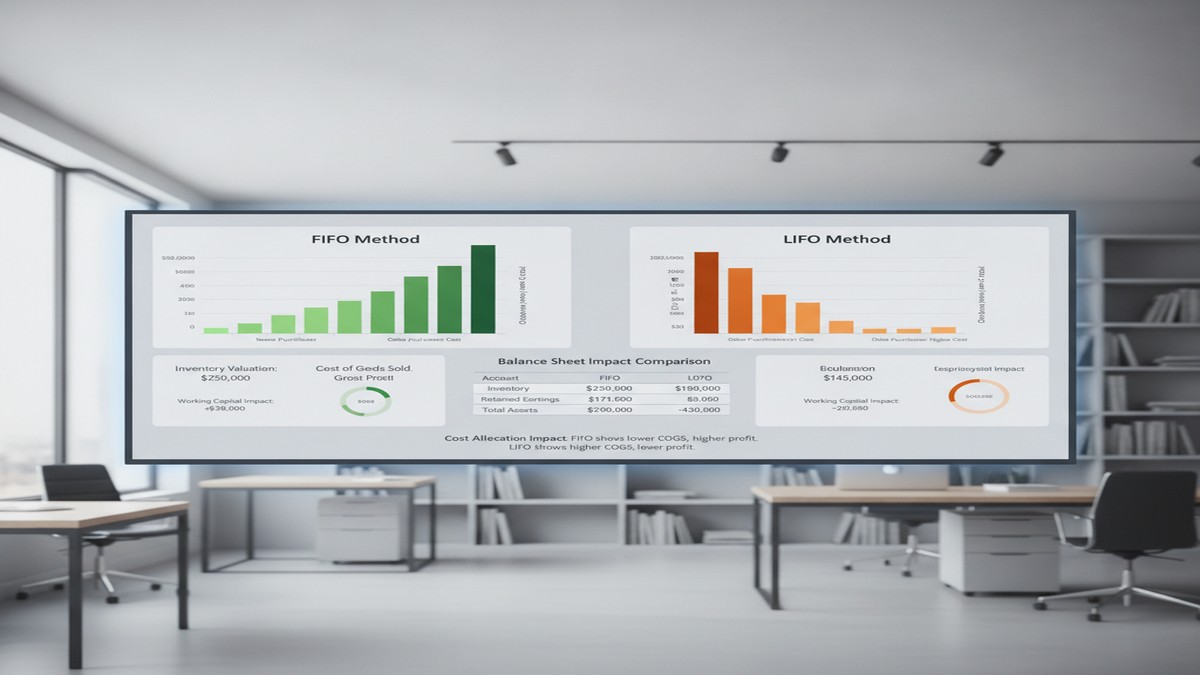
Business Central inventory costing methods FIFO vs LIFO comparison

When most finance teams implement Business Central, inventory costing defaults to FIFO. It’s the system default, it feels familiar, and no one on the implementation team flags it as a strategic decision. Then, 18 months into production, the conversation happens in the CFO’s office: your inventory balance sheet valuation has drifted significantly from what your tax accountant expected, your working capital metrics look different than they did under your legacy system, and your auditors are asking uncomfortable questions about whether the method you’re using actually aligns with your declared accounting policy.

This scenario repeats across organizations that underestimate the costing method decision as a finance strategy choice rather than a technical configuration. The truth is that your selection of FIFO, LIFO, weighted average, standard, or specific costing in Business Central ripples through your financial statements, your tax position, your working capital calculation, and your audit trail in ways that matter far more than most implementation teams realize.

## Why the Costing Method Choice Actually Matters to the Bottom Line

Business Central’s inventory costing method determines which purchase prices flow into your cost of goods sold and which prices remain sitting in inventory on your balance sheet. This distinction seems technical, but the financial impact is substantial. When prices rise, different costing methods produce radically different results: one method increases your reported profits and tax liability, another decreases both, and a third lands somewhere in between. The method you choose today locks in a path for your working capital metrics, your borrowing capacity, and your tax strategy for years to come.

Beyond the numbers, the costing method choice also determines how flexibly you can adjust costs after posting, whether you can back-date transactions without recalculating everything downstream, and how much discipline you need from your inventory and purchasing teams to keep the GL in sync with your ledger. Some methods are forgiving when you discover a $5,000 invoice weeks after posting; others force you to recalculate thousands of ledger entries and reconcile your entire inventory GL account.

## FIFO: The Default That Often Feels Wrong Under Inflation

First-In, First-Out assumes that the oldest items purchased are the first ones sold. When prices are stable or declining, FIFO produces intuitive results. When prices rise, FIFO increases your reported inventory value and profits, which sounds good until tax day arrives and your tax liability rises with it. In an inflationary environment, FIFO inflates your balance sheet. Your inventory looks more valuable, which helps you approach lenders and improves your current ratio. Your cost of goods sold stays lower, making gross margins look better. But your reported profit grows, and so does your tax bill.

FIFO is also straightforward to reconcile. Business Central tracks which purchase transactions were consumed in which sales, so tracing cost flows back to specific purchase invoices is relatively transparent. If you discover a cost error in a purchase invoice, you can correct it without triggering a cascade of recalculations across the entire inventory GL. These operational benefits make FIFO the path of least resistance for many finance teams.

The constraint worth noting: once you set an item to FIFO in Business Central, you cannot change to a different costing method if any ledger entries exist for that item. This lock-in effect means your initial FIFO choice is likely permanent for years, even if business conditions shift.

## LIFO: The Tax Advantage with Regulatory Complications

Last-In, First-Out assumes that the most recently purchased items are sold first, which produces the opposite financial effect of FIFO. In an inflationary environment, LIFO decreases your reported profits and tax liability, which is why LIFO became popular during high-inflation eras as a way to reduce tax burden. Your cost of goods sold rises faster, your gross margin shrinks on paper, and your reported profit falls, which lowers your tax bill.

The catch is significant: LIFO is disallowed in many countries and regions outside the United States. If your organization operates internationally or plans to expand outside the US, LIFO creates compliance complications and audit friction. Some jurisdictions view LIFO as a method that artificially depresses profit, and regulators restrict or disallow its use entirely. For this reason, LIFO is increasingly rare in global organizations, even though it retains tax appeal in the US market.

## Weighted Average: The Middle Ground for Volatile Costs

Weighted average costing calculates a single average unit cost at a defined interval (daily, weekly, monthly, quarterly, or per accounting period). Every item consumed during that period uses the same average cost. This method produces results that fall between FIFO and LIFO, making it a reasonable choice when your product costs are volatile or you have mixed, homogeneous inventory such as chemicals, raw materials, or commodities where tracing individual purchase costs to specific sales is impractical.

The operational trade-off with weighted average is important: if you back-date a transaction, Business Central must recalculate all affected ledger entries and inventory GL entries within that averaging period. A single invoice correction that appears weeks after posting can trigger a recalculation wave that touches hundreds of inventory transactions. This recalculation risk makes weighted average less attractive in environments where posting errors surface late or where regular transaction corrections are common.

## The Real Decision Framework: What Finance Leaders Should Actually Evaluate

Selecting your costing method should be driven by three distinct questions, not by which method your legacy system used or which option appears first in the setup wizard.

First, what is your product cost environment? If product costs are stable or predictable, FIFO is operationally clean. If your costs are volatile and inventory is homogeneous, weighted average is more defensible. For highly valued, easily identifiable items, specific costing gives you exact cost tracking.

Second, what is your tax and financial reporting strategy? If you want to minimize tax liability in an inflationary environment, LIFO appeals. If you want to maximize reported profits and borrowing capacity, FIFO serves that goal. If you want a neutral middle ground that doesn’t swing too far either direction, weighted average is stable. This decision is not a technical question; it is a finance strategy question that should involve your tax accountant and CFO.

Third, what are your regulatory and audit constraints? If you operate globally, LIFO creates complications. If your auditors have strong opinions about industry-standard methods, align with those expectations upfront. If your working capital and cash flow metrics are tightly monitored by lenders, verify that your costing method choice aligns with debt covenant calculations.

Once these three questions are answered, the technical choice becomes clear.

## Common Mistakes That Surface After Cutover

Finance teams frequently discover problems with their costing method choice only after cutover has been running for months. One common mistake is defaulting to FIFO because the implementation team knew no better, then realizing too late that your tax strategy would have favored weighted average or that your auditor expected a different method. Another frequent issue is underestimating the back-dating problem with weighted average, only to discover months later that regular cost corrections trigger massive recalculation waves that destabilize your GL.

A third mistake is failing to ensure that your Dynamics purchasing and inventory teams understand the costing method you selected. If your team does not know that you have chosen LIFO, for example, they may manage inventory in a way that contradicts LIFO’s assumptions, making your GL reconciliation substantially harder and your audit trail less defensible.

## Resetting the Choice Requires Planning

If you discover six months after cutover that you selected the wrong costing method, reversing the decision is expensive and disruptive. The technical constraint is absolute: you cannot change an item’s costing method if ledger entries exist. Resetting requires either creating new item numbers and migrating open inventory to those new items, or conducting a full inventory revaluation and GL restatement. Both paths are operationally messy and often require auditor involvement to ensure the transition is defensible.

For this reason, getting the choice right upfront is worth the investment of time and expert input before cutover.

## The Real Impact: Working Capital and Strategic Positioning

The costing method you choose in Business Central is not a technical detail to delegate to the implementation team; it is a financial strategy decision that affects your reported working capital, your tax position, and your balance sheet strength for years to come. FIFO inflates your inventory value and profits during inflation, making your balance sheet look stronger to lenders but increasing your tax bill. Weighted average cushions you against cost volatility but exposes you to recalculation risk. LIFO minimizes taxes but creates regulatory complications.

Organizations that treat the costing method choice as a strategic decision, led by their CFO and tax accountant rather than by the technical implementation team, avoid costly reversals after cutover and build a Business Central GL that supports their actual financial and tax strategy. Routeget Technologies helps finance and operations teams make this strategic choice before implementation, ensuring that your Business Central configuration aligns with your working capital goals and tax objectives from day one.

The choice you make now will shape your financial statements for years. Make it deliberately.

—

#BusinessCentralInventory #InventoryCosting #WorkingCapital #BusinessCentralFinance #FIFOvLIFO #CFOStrategy #DynamicsFinanceOps #FinancialAccounting #CostAccounting #BusinessCentralCore

Finance team analyzing Business Central inventory valuation in office

About Routeget Technologies: Routeget Technologies is a Microsoft Dynamics consulting firm helping enterprise and mid-market organizations implement, optimize, and extend their Microsoft technology investments. Our teams combine deep technical expertise with business advisory experience to deliver implementations that drive operational efficiency and financial impact.