

Your Dynamics 365 Finance implementation is live. You saw a beautiful demo six months ago showing real-time cash flow forecasts, interactive budget variance analysis, and executive dashboards that updated daily. The vendor closed by saying, “You can build this in Power BI in a few weeks.”
Now, three months into your Power BI financial analytics initiative, your internal team is debating whether to hire a permanent analytics hire, your costs have tripled, and you’re six weeks behind on the first dashboard. That demo didn’t account for your Chart of Accounts structure complexity, your subsidiaries’ separate accounting policies, or the fact that your finance team still reconciles GL accounts in a spreadsheet no amount of automation can entirely replace.
This gap between demo and reality is not unusual. It is the norm. Finance organizations that understand this gap upfront build realistic programs that deliver value in 18 to 24 months. Those that don’t end up with abandoned dashboards, frustrated finance teams, and justifiably skeptical CFOs.
What Power BI Actually Brings to Finance
Power BI is a visualization and analytics tool. It is not magic, and it is not a substitute for good financial process discipline. What it does extremely well is surface patterns and relationships in data that spreadsheets obscure, refresh reporting faster than month-end manual consolidations, and give finance teams access to their own analysis without waiting for IT to run scripts.
For Dynamics 365 Finance specifically, Power BI connects directly to your financial data through Dataverse, Power BI’s native Dynamics 365 connector, or Azure Synapse Link for larger datasets. This means your dashboards can show live GL balances, budget variances, or cash flow trends without your finance team building and maintaining ETL jobs in Excel. That alone is valuable. It also means your governance and data accuracy problems do not disappear; they become visible much faster.
The Real Cost of Financial Analytics
Most finance organizations underestimate three cost categories when planning Power BI dashboards.
First: Data Preparation and Model Building. Your chart of accounts is not flat. Your GL transactions include reversals, accruals, and period-end corrections. Your budget data lives in multiple systems (ERP, planning tools, legacy spreadsheets). Your actuals do not reconcile automatically to budget because your organization budgets differently than you post GL transactions. Building a semantic model that surfaces truth instead of confusion requires someone (or a team) to understand your financial processes deeply enough to build that logic in Power BI’s data model.
A consultant or senior analyst can build a basic cash flow dashboard in two weeks. Building a GL variance analysis dashboard that your business partner actually trusts because they understand where the numbers came from requires six to eight weeks of data modeling, testing, and refinement. Multiply this by five to ten dashboards, and you are talking about 10 to 15 person-months of skilled analytical work before you have a production-grade Power BI program.
Second: Governance, Security, and Access Control. Power BI’s row-level security (RLS) model is powerful and flexible. It is also complex. If you need controller-level access to consolidated GL but division heads to see only their own GL, and you want budget managers to compare actual to budget within their business unit, you need a well-designed RLS strategy built on top of your Dynamics 365 security roles.
Adding RLS after dashboards are built is expensive. Building it from the start means taking time to model your organizational hierarchy, decide how P&L responsibilities map to GL structures, and test that every user sees exactly what they should. In large organizations, this is not a week-long project. It is often three to six weeks of iterative testing, edge-case resolution, and alignment with your controller’s office.
Third: Change Management and Training. Your finance team has used the same reports for five years. A new dashboard that shows variance differently, calculates metrics in an unfamiliar way, or requires them to self-serve analysis instead of calling the accounting department will be questioned. Finance organizations move slowly because accuracy matters. Spending time to train your finance team, document assumptions in your dashboards, and let them develop confidence in new analytics before expanding access is essential. Organizations that skip this step often see adoption stall after the initial roll-out.
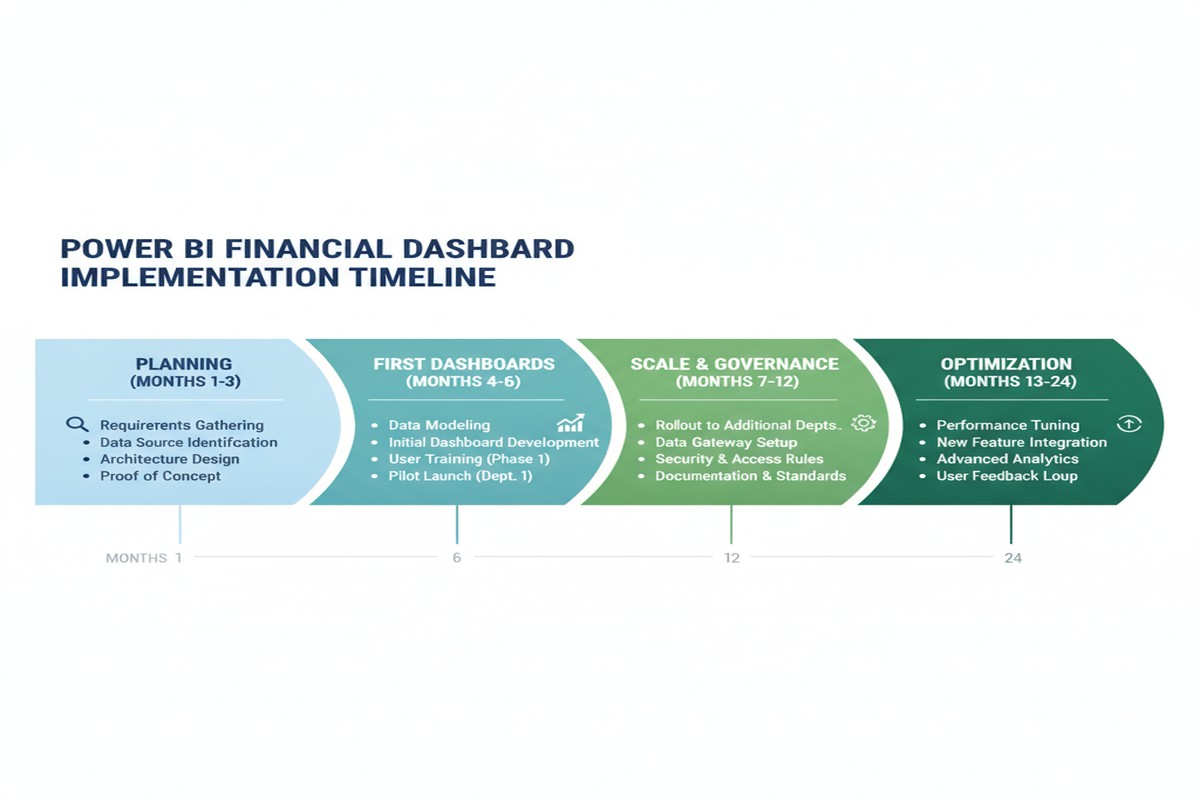
Timeline Reality for Finance Dashboards
A realistic timeline for a production-grade Power BI financial analytics program looks like this:
Months 1 to 3: Planning, Architecture, and Foundation Building. You define which dashboards matter most. You audit your GL structure and data quality. You design your semantic model. You plan your security model. You do not build dashboards yet. This period is invisible to executives but essential to avoid rebuilding everything later.
Months 4 to 6: First Dashboards and Pilot Testing. You deliver one to two core dashboards (GL overview, budget variance, or cash flow) to a pilot group of power users. You iterate based on their feedback. You refine the data model. You document assumptions. You do not declare victory.
Months 7 to 12: Scale and Governance. You build three to five additional dashboards based on lessons from the pilot. You harden your security model. You establish SLAs for data refresh (daily, hourly). You set up processes for your finance team to request new analysis without recreating dashboards.
Months 13 to 24: Optimization and Organizational Adoption. Your dashboards are live for most of the organization. You optimize performance, add forecasting or predictive capabilities, and integrate with planning tools. Real adoption happens here, not during launch.
Eighteen months is a conservative estimate for a mid-market organization. If you are larger or your GL is more complex, add six months. If you try to compress this to nine months, you will compromise on governance or data quality, and you will pay for it later.
Realistic ROI and Business Case Framework
Financial analytics ROI is real but indirect. You should not expect Power BI alone to reduce headcount. What you should expect is that your finance team spends less time on manual reporting and more time on analysis, and that finance leaders can answer ad hoc questions faster.
For a CFO building a business case, frame the ROI around three levers:
Time Savings. If your month-end close takes ten days and two weeks of follow-up reporting questions, and Power BI cuts that to eight days with faster ad hoc answer time, quantify that. At a typical all-in cost of $200 to $250K annually for a finance analyst, saving 10 to 20 percent of their time across the team is meaningful.
Decision Velocity. Finance leaders who can answer a business partner’s variance question in hours instead of days make better decisions. Quantify this carefully (it is subtle), but it is real. Include it in your business case as a strategic benefit, not just cost savings.
Risk Mitigation. Faster visibility into GL accuracy, budget performance, and cash flow trends reduces surprises at board meetings. This is hard to quantify but worth naming in your business case, especially if you have had historical GL variance issues or cash flow forecasting failures.
Pragmatic Next Steps
Before committing to a large Power BI investment, take these steps:
Start with a pilot. Pick one financial process (GL variance analysis or monthly cash flow forecasting) and build a proof of concept with one to two analysts over 8 to 12 weeks. Spend one week on planning. Spend six weeks on data modeling and development. Spend one week on pilot testing. Use what you learn to scope the larger program.
Assess your data quality. If your GL balances don’t reconcile to your trial balance, or your budget data lives across five systems, fix that first. Power BI will not solve data quality problems; it will highlight them.
Define governance upfront. Decide who owns the semantic model. Decide how often dashboards refresh. Decide how users request new analysis. These decisions are boring but essential.
Budget realistically. A multi-dashboard financial analytics program for a mid-market organization costs between $200K and $500K over 18 to 24 months, including internal team time, consulting, and platform licenses. If your CFO is not comfortable with that range, you are not yet ready for the program.
The Business Case That Actually Works
Power BI for financial analytics delivers real value. The organizations that see that value are those that plan for 18 months, budget realistically, and recognize that the real cost is not the software license or the initial implementation. It is the investment in data quality, governance discipline, and finance team capability that makes analytics actionable.
The demo you saw six months ago was real. You are just building the foundation to support it.
Routeget Technologies helps organizations build data-driven financial organizations through Dynamics 365 Finance implementations and Power BI analytics programs that actually fit your organization’s reality. Reach out to discuss your financial analytics roadmap.
#PowerBIFinance #FinancialAnalytics #DynamicsFinance #BusinessCaseAnalysis #CFOStrategy #FinancialReporting
No comment yet, add your voice below!