Distributed Order Management Date Logic in Dynamics 365: Why Your Order Promise Dates Don’t Match Fulfillment Reality

Distributed Order Management dashboard showing fulfillment network optimization

A CFO at a mid-market distributor implemented Distributed Order Management in Dynamics 365 Supply Chain Management expecting it to automatically optimize which warehouse fulfilled each order. Six weeks after go-live, order promise dates started slipping consistently beyond what the fulfillment network could actually deliver. The system promised customers Friday delivery, but warehouse capacity and transit times said Tuesday was realistic. The DOM configuration looked correct on paper, but something in the date calculation logic wasn’t aligning with how the fulfillment network actually worked.

This scenario repeats across Dynamics 365 implementations. Distributed Order Management is powerful, but the interaction between order promise date logic, inventory allocation, and fulfillment location rules creates a complexity that most teams underestimate. The system doesn’t fail loudly; it simply generates commitments that the supply chain can’t keep.

How DOM Calculates Order Promise Dates

Distributed Order Management dashboard showing fulfillment network optimization

Distributed Order Management in Dynamics 365 uses a specific sequence when evaluating whether an order can be fulfilled. First, DOM checks inventory availability across fulfillment locations based on allocation rules you configure. Then it calculates a delivery date by adding transit time from the selected warehouse to the delivery address. Finally, it compares that calculated date against your order promise date policy. If the fulfillment location can deliver within the promised window, the order is allocated there. If not, DOM tries the next location in the rule priority sequence.

The order promise date itself is typically set during order entry, usually based on a default lead time from your Sales module or a customer-specific agreement. That date becomes a hard constraint in DOM’s allocation logic. If no warehouse can deliver by that date, DOM marks the order as unallocated, and a manual intervention becomes necessary.

The problem emerges when your order promise date policy doesn’t account for the actual distribution network topology. Many teams set promise dates based on what customer expectations are, not what the fulfillment network can physically deliver. You might promise Friday delivery in all cases, but your nearest warehouse to a particular delivery address is two days away by standard transit. DOM will correctly refuse that allocation, but the order is already in the system with a date you can’t keep.

Common Date Logic Failures

Transit time configuration is the first place this breaks. Dynamics 365 allows you to define transit times between fulfillment locations and delivery addresses using distance-based or location-based rules. If your transit time matrix is incomplete or uses broad assumptions (for example, assuming all addresses in a state can be reached in one day), DOM will calculate delivery dates that don’t match reality. A customer in a remote area might be assigned a warehouse that’s technically capable of shipping, but the transit time estimate is wildly optimistic.

Inventory allocation sequencing compounds the issue. DOM prioritizes fulfillment locations based on rules you define, often weighted toward nearest warehouse or lowest cost. If your highest-priority warehouse has zero inventory but a high promised delivery date policy, DOM may skip it and try a lower-priority location further away. That second location might have inventory, but if its transit time exceeds your order promise date, the order goes unallocated. Your first-choice warehouse would have delivered on time, but it was out of stock.

Lead time inclusion creates another layer of complexity. Some organizations include a buffer in their order promise dates to account for order processing and picking time at the warehouse. Dynamics 365 allows this through the delivery date offset configuration in DOM rules. If that offset is set incorrectly (too small or too large), the system either promises dates that include warehouse processing time that doesn’t exist, or it excludes processing time that’s actually required, causing fulfillment failures when the order reaches the warehouse and needs to be queued.

Customer-level promise date overrides can also break assumptions. You might configure DOM with a global 5-day promise window, but a contract with a specific customer guarantees 3-day delivery. If that override isn’t captured in your fulfillment location rules or priority weighting, DOM will allocate to a warehouse that can deliver in 4 days, violating the contract.

Diagnosing What’s Actually Happening

Modern warehouse fulfillment center with inventory management operations

The DOM allocation trace in Dynamics 365 is your primary diagnostic tool. When an order fails to allocate, you can review the detailed trace that shows which fulfillment locations were evaluated, in what order, and why each was rejected or selected. This trace will show you if DOM was considering a warehouse that’s 800 miles away when one 50 miles away was available, or if it rejected a capable warehouse because of a date mismatch.

Run a date audit on recent orders. Compare the promised delivery date in the order against the calculated fulfillment date from the allocating warehouse. If most discrepancies are 1-2 days, your promise date policy is probably out of sync with network capability. If discrepancies are random and larger, your transit time matrix or delivery date offset configuration needs review.

Test your fulfillment location rules under load. DOM’s behavior changes when multiple orders are competing for the same inventory. Create test orders representing different geographic regions and order volumes, then check whether DOM’s allocation recommendations make sense. A warehouse that looks ideal in isolation may become bottlenecked when handling actual volumes, and DOM doesn’t account for capacity constraints in its date calculations, only inventory availability.

Fixing the Fundamental Mismatch

Start by establishing what your supply chain can actually deliver. Map your fulfillment locations, typical inventory levels, and genuine transit times (not best-case, but realistic). Document customer-specific commitments and contract terms separately from default policies. This foundation is non-negotiable.

Configure DOM’s promise date policy to match this reality. If your farthest delivery address is 4 days by ground from your nearest warehouse, your default promise date can’t be 2 days. If you want to offer 2-day delivery, you need inventory positioned closer to that customer or expedited shipping available. The promise date is a hard constraint in DOM’s logic, and you can’t configure your way around physics.

Use delivery date offsets intentionally. Set offset values to match actual warehouse processing and handling time, not to pad margins or squeeze perceived cost. A 1-day offset means that when DOM calculates a delivery date, it subtracts 1 day from the available time window to account for warehouse operations. If your actual processing time is 1 day, use 1 day. If you set 2 days to add safety margin, you’ll miss valid allocation opportunities and generate unallocated orders.

Test with real order patterns before relying on DOM for critical orders. Run a pilot allocation cycle using your actual customer set and geographic distribution. Let DOM run without overriding individual allocations, then measure how many orders allocate successfully and how many miss their promise dates. That result tells you whether your configuration is grounded in supply chain reality or wishful thinking.

Implementation Considerations

DOM becomes more valuable when it’s working with accurate constraints, not fighting against them. The system will allocate orders optimally, but only within the bounds you set. If those bounds don’t match physical reality, you’re asking DOM to solve an impossible problem, and the system will fail in ways that look like bugs but are actually configuration problems.

Many teams discover this only after going live and watching order dates slip. By then, you’re rewriting promise date policies, adjusting transit times, and managing customer expectations, all while DOM continues to make allocation decisions based on outdated assumptions. The cost of getting this wrong extends beyond supply chain operations into customer service and revenue recognition, where promise dates become contractual commitments.

The solution isn’t complex, but it is foundational. Your Dynamics 365 implementation needs to start with an honest assessment of what your fulfillment network can deliver, then configure DOM to work within those constraints. When you do, the system’s optimization capabilities become genuinely valuable. When you don’t, you’re managing conflict between a system trying to allocate optimally and a supply chain that can’t deliver on what it’s promising.


#DynamicsSupplyChain #DistributedOrderManagement #DOM #SupplyChainOptimization #D365SCM #FulfillmentLogistics #InventoryAllocation #OrderManagement #SupplyChainTechnology

AI-Powered Lead Scoring in Dynamics 365 Sales: Turning Raw Data Into Revenue Priority

Your sales team has access to thousands of leads. The problem is not finding prospects; it is identifying which ones are worth the time of your most expensive salespeople. Most organizations still rely on a combination of manual CRM notes, email volume, and gut feel to determine which leads get attention. The result is predictable: sales reps work randomly through their pipeline, cold accounts consume their bandwidth, and opportunities grow stale while tier-two prospects wait.

Dynamics 365 Sales, combined with AI Builder and Power Automate, offers a practical alternative: automated lead scoring that continuously evaluates prospect behavior and intent signals, surfacing the highest-probability deals to your team. This is not a generic tactic; it is a specific system that assigns numerical scores to every lead based on your own historical conversion data, and then uses those scores to automatically route, prioritize, and stage deals. For many midsize and enterprise sales organizations, implementing this correctly compresses sales cycles, improves win rates, and frees your team to focus on closing rather than hunting.

Why Scoring Beats Instinct (And Why Dynamics 365 Is the Right Platform for It)

Lead scoring rests on a simple premise: your best leads look like your past best deals. If you can identify the early signals that characterized your won deals, you can apply those same signals to your pipeline in real time.

In practice, scoring requires three things. First, you need historical data: a clean set of opportunities that closed as won, complete with the lead source, company size, industry, engagement pattern, and other attributes that came before the win. Second, you need an algorithm that maps those attributes to probability. Third, you need a system that applies that scoring continuously, updates scores as new activity arrives, and feeds the results back to your sales team in a way they actually use.

Dynamics 365 Sales provides all three. The platform already holds your historical opportunity data and your lead attributes. AI Builder, Dynamics’ no-code machine learning tool, can ingest that historical data and generate a scoring model without requiring you to hire data scientists or build a custom pipeline. Power Automate can then apply that model to every new lead and opportunity, and can automatically update scores as activity accumulates. The result is a lead scoring system that lives inside the CRM where your team already works, rather than in a separate tool that requires them to toggle between windows.

For a sales leader, the advantage is clear. A scoring model trained on your own data will reflect your unique sales motion, your typical deal cycle, and the specific attributes of your market. An off-the-shelf scoring engine, by contrast, is built on generic B2B assumptions that may not match your business at all. When you train your model on your own closed deals, your salespeople are more likely to trust the scores, and they are more likely to act on them. That trust translates to adoption, and adoption translates to impact.

The Lead Scoring Workflow: How It Works in Practice

Setting up automated lead scoring in Dynamics 365 requires clear thinking about what you are trying to score and how you will use the scores once they are calculated.

Start with definition. Decide whether you are scoring leads (unconverted prospects) or opportunities (qualified leads that have entered your formal sales process), or both. Most organizations score at the opportunity level, because that is where actual revenue potential becomes measurable. Define your target variable: are you predicting whether a deal will close, or are you predicting deal size, cycle length, or the probability of a specific outcome?

Next, assemble your training data. Go back through your closed opportunities for the past 12 to 24 months. For each closed opportunity, document the attributes that were visible early in the deal: company industry, company size (headcount or revenue), whether they came from inbound or outbound marketing, how many email interactions occurred before the first sales conversation, whether a technical evaluation took place, how many stakeholders were involved. Then add the outcome: did the deal close? For closed-won deals, record the deal size and the time from initial contact to close.

This is the dataset that AI Builder will learn from. The more historical data you assemble, the more reliable the model. If you have fewer than 50 closed-won deals in your history, scoring will be difficult; if you have 200 or more, you have strong signal.

Upload that dataset into a spreadsheet or a Dataverse table, or connect AI Builder directly to your Dynamics 365 opportunity list. AI Builder’s automated machine learning will ingest the historical data, identify which attributes most strongly correlate with closed-won outcomes, and generate a scoring model that assigns a probability to new opportunities based on their current attributes.

Once the model is trained and validated, use Power Automate to apply it. Create a cloud flow that triggers whenever a new opportunity is created or whenever an activity is recorded against an existing opportunity. The flow calls the AI Builder scoring model, collects the predicted score, and writes it back to the opportunity record in a custom Score field. You can also set up automatic actions triggered by score thresholds: when an opportunity crosses above 70% probability, automatically assign it to your top sales rep and send a summary email to the sales manager.

The Business Case: Impact You Can Measure

The value of lead scoring shows up in three areas, all measurable.

First, sales team efficiency. When leads are scored and routed based on probability, your best salespeople spend their time on high-probability deals rather than randomly working through a queue. In practice, this often means a 20 to 30 percent reduction in the time spent on early-stage qualification, and a corresponding increase in the number of high-value conversations happening per week. You are not changing headcount; you are redistributing where existing salespeople spend their effort.

Second, pipeline velocity. Deals that are accurately scored tend to move through your pipeline faster. Sales reps focus on moving high-probability deals to close, rather than keeping stalled opportunities open indefinitely. Early action on low-probability deals (either aggressive qualification or formal disqualification) clears the pipeline and keeps your forecast clean. For a $10 million sales organization, even a modest acceleration of your average deal cycle by 10 to 20 percent can add millions of dollars to annual revenue.

Third, forecast accuracy. When leads are continuously scored based on consistent criteria, your sales managers can forecast pipeline with much greater confidence. Instead of relying on a subjective assessment of deal status, managers can look at the aggregate score distribution of their pipeline and predict with reasonable accuracy what will close. This precision becomes particularly valuable if you operate with quota management, revenue recognition, or board-level reporting that requires predictability.

Common Mistakes and How to Avoid Them

Most organizations do not fail to deploy lead scoring; they fail to deploy it correctly, and then they abandon it.

The most common mistake is training a model on data that is too thin or too old. If your training set includes only 20 closed opportunities, or if those opportunities closed more than three years ago, the model will perform poorly on new data. Build your training dataset deliberately. If you have a young sales organization with limited historical data, start with a smaller set of attributes that you are confident are predictive (perhaps company size, industry, and sales motion source), and plan to retrain the model every six months as you accumulate more closed deals.

The second mistake is treating the score as a rank. Sales reps sometimes interpret a lead with a 65% score as inferior to one with an 80% score, and deprioritize it accordingly. In reality, both are valuable; the difference is risk profile. A 65% score means the deal has a reasonable chance of closing, but with more uncertainty. A 80% score means the deal is more likely to close, but may be smaller or further away. Train your team to interpret scores as probability, not hierarchy, and to view all scores above your qualification threshold (typically 50 to 60%) as worthy of active pursuit.

The third mistake is deploying the score without changing your process. Simply displaying a score in Dynamics 365 will not change behavior; salespeople will ignore it if it feels disconnected from the way they work. Instead, wire the score into your sales process. Use it to trigger automatic task assignments, to rank leads in your daily view, or to flag deals that have stalled despite a high score. Make the score a structural part of your daily work, not a novel data point that sits on the side.

Getting Started: The First 90 Days

If you decide to implement lead scoring, plan for a three-month project. Weeks one and two focus on data assembly. Work with your finance and sales operations teams to pull together your closed opportunity history, verify data quality, and prepare the training set.

Week three covers modeling. Upload your data to AI Builder, train a scoring model, and validate it against a holdout sample of historical data. Most models will achieve 70 to 80% accuracy on historical data; that is expected.

Weeks four through six focus on integration. Build the Power Automate flow that applies the model to new opportunities and activities. Set up automatic actions. Write a short guide for your sales team explaining what the scores mean and how to use them.

Weeks seven through 12 are deployment and refinement. Roll out scoring to your team. Collect feedback. Monitor which leads are being acted on and which are being ignored. Refine your thresholds. After 90 days, pause and evaluate: did sales cycle compress? Did revenue increase? Did forecast accuracy improve? Use those results to decide whether to expand the model or refine it further.

Conclusion

AI-powered lead scoring in Dynamics 365 Sales is not a futuristic concept; it is a practical system available to any sales organization with 50 or more closed deals and the willingness to spend 12 weeks implementing it. The payoff is significant: freed-up sales time, faster deals, and more predictable revenue. For sales leaders tasked with improving efficiency without adding headcount, or for IT leaders evaluating how to deliver business value from Dynamics 365, a lead scoring implementation offers measurable, defensible ROI.

At Routeget Technologies, we have built lead scoring systems for dozens of Dynamics 365 organizations. The implementation patterns we have learned apply to most sales organizations: start with clean historical data, train a model conservatively, integrate it into your daily sales process, and refine over time based on real results. If your sales team is currently managing leads by feel or by gut, a data-driven approach to prioritization will likely produce immediate impact.


#Dynamics365Sales #AILeadScoring #SalesEnablement #AIBuilder #SalesOptimization #CRM #LeadManagement #SalesAutomation

Designing Dynamics 365 for Enterprise: Why Customization Strategy Decides Success, Not Implementation Speed

Enterprise architecture diagram for Dynamics 365 customization strategy

Designing Dynamics 365 for Enterprise: Why Customization Strategy Decides Success, Not Implementation Speed

Your implementation partner is confident they can deploy Dynamics 365 Finance in 16 weeks, on budget, with minimal customization. Your CIO is skeptical. What everyone is missing is that 16 weeks of deployment velocity means nothing if the system cannot flex to meet the specific financial workflows, reporting requirements, and exception-handling logic that actually run your business. This article walks through the decision-making framework that separates Dynamics 365 implementations that maintain competitive advantage from those that lock you into inflexible process conformity.

Enterprise architecture diagram for Dynamics 365 customization strategy

The Cost of Standardization Without Strategy

When large organizations adopt Dynamics 365, they encounter a genuine constraint that smaller implementations never face. Standard Dynamics 365 processes are designed to handle typical transactional patterns: create a sales order, post inventory, record journal entries, close a period. These processes work well in companies where financial and supply chain operations follow recognizable routines. For organizations with complex subsidiaries, multiple legal entities, specialized revenue recognition requirements, or consolidated financial structures, the gap between standard functionality and operational reality can be substantial.

The temptation is to close that gap quickly. Customize first, ask questions later, implement the feature, move on. Partners and consultants work under schedule pressure; executives care about go-live dates. But what you are actually deciding during that 16-week window is whether Dynamics 365 will grow with your business or become a limitation on it. Quick customization often leaves a system that works once but breaks when operational volumes increase, subsidiary structures change, or new products with different financial characteristics are introduced.

The alternative, often recommended as the responsible path, is to conform your business processes to Dynamics 365’s out-of-the-box design, accepting some operational inefficiency as the cost of system stability and supportability. In many cases this is the right choice. But conformity also has costs that don’t appear on project budgets. Your finance team works longer hours to reconcile Dynamics 365’s assumptions against reality. Your reporting becomes a collection of workarounds rather than a source of truth. And when the next acquisition brings new compliance requirements or new product portfolios, the system lacks the extension points to accommodate them without a redesign.

What does decide success is a third path: designing your customization strategy during the planning phase, before implementation begins. That strategy takes into account which aspects of your business must remain flexible and which can safely conform to industry standards. It identifies the specific extension points within Dynamics 365’s architecture where customization will add the most value for the least technical risk. And it builds a system that can absorb change without constant rearchitecture.

Where Customization Creates Value Versus Where It Creates Debt

Enterprise Dynamics 365 implementations typically divide customization work into three categories. The first, which most organizations handle well, is creating reports and dashboards that show business leaders what is actually happening in the system. Power BI integration has made this category straightforward and low-risk. The second category is integrating Dynamics 365 with adjacent systems: supply chain planning, human capital management, third-party analytics, specialized industry platforms. This category is partially standardized through common APIs, but it still requires engineering effort to match data semantics and handle edge cases.

Enterprise architecture dashboard with analytics and workflow components

The third category is where implementation strategy becomes critical. This is the customization of Dynamics 365’s own business logic: approval workflows, financial period close sequences, consolidation logic for multi-entity structures, asset depreciation rules, tax calculation approaches. This category is where quick implementations often stumble. An approval workflow that works during initial deployment may become a bottleneck once volume increases. A period-close automation that works for a single legal entity with straightforward inter-company transactions becomes fragile when the organization acquires a subsidiary with different accounting standards.

The decision-making framework starts here: before implementation begins, your enterprise architects and finance leaders should identify which of these processes are truly core to competitive differentiation and which can safely standardize. A manufacturing company with a proprietary approach to cost allocation across multiple production facilities needs flexible and sophisticated costing logic. It is worth customizing Dynamics 365 to accommodate that approach because it is a source of actual competitive advantage. A company that follows standard industry costing practices might adopt Dynamics 365’s defaults and apply engineering effort elsewhere. The distinction seems obvious once stated, but most implementations conflate two different questions: “What does our business need?” and “What can we afford to build?”

Building Sustainable Extensibility Into Your Architecture

Once you have identified where customization creates value, the question becomes how to build those customizations in a way that survives the company’s evolution. This is the point where many implementations fail, not because the customizations are poorly written, but because they are designed for a static set of requirements rather than a dynamic business landscape.

Sustainable Dynamics 365 customization relies on a small set of architectural practices that most standard implementations skip. The first is establishing a clear boundary between custom logic and core system behavior. Dynamics 365 provides multiple layers where you can extend functionality: metadata-driven configuration, business process flows for structured automation, plugins for deep system logic, and custom APIs for discrete operations. Each layer has appropriate use cases, and mixing them creates brittle systems that become impossible to maintain as requirements change. Your architecture should establish which customization layer you will use for each category of logic, and it should enforce that decision consistently across the implementation.

The second practice is designing for data portability and reporting independence. The most consequential decision you make during implementation is how custom data structures interact with standard Dynamics 365 tables. Custom tables often make sense for capturing business-specific information, but they need to be designed from the start as if they might need to move to Power BI, external data warehouses, or downstream systems. This means using consistent naming conventions, avoiding gratuitous denormalization, and exposing data through defined APIs rather than direct database access. This sounds like overhead during implementation, but it becomes the difference between a system that can evolve and one that becomes increasingly brittle.

The third practice is establishing a plugin and API governance model before the first line of custom code is written. Plugins in Dynamics 365 give you profound power to intercept and transform business logic, but they also create opportunities for cascading failures if not managed carefully. A plugin that modifies financial data should have well-defined preconditions and should fail safely rather than partially. This requires treating plugin logic as mission-critical software, with corresponding standards for error handling, logging, and monitoring. Many organizations discover this requirement only after a plugin failure causes data corruption or blocks period close.

The Timeline Problem: Speed Versus Sustainability

The financial incentive structure in most implementations creates pressure to prioritize speed over sustainability. Consultants are paid for hours, not for long-term system stability. Partners succeed when projects go live on schedule, not when systems remain flexible three years later. This creates an alignment problem between what consultants build and what enterprises actually need.

The remedy is to invest in architectural review and governance at the beginning of the implementation, not at the end. This means dedicating time during planning to document which Dynamics 365 capabilities will be used as-is, which will be customized and why, and which are being bypassed in favor of external systems. It means establishing plugin standards and API governance before the technical team begins coding. It means creating a small architecture review board that reviews major customization decisions and blocks implementations that do not align with the agreed strategy.

This sounds like adding overhead to an already-complex project, and in terms of pure calendar time, it does. But the payoff is in the years that follow. When your organization expands into new markets and needs to onboard a subsidiary with different accounting structures, a well-designed Dynamics 365 foundation can usually accommodate that through configuration and targeted customization. A poorly-designed one requires rearchitecture. When regulatory requirements change and you need to modify financial period-close logic, a system built on clear customization boundaries can adapt. One without those boundaries often cannot.

Deciding What to Do Right Now

If you are in the early stages of Dynamics 365 planning, the most valuable action is to bring your architects and business leaders into the conversation about customization strategy before implementation begins. Do not let this decision be made implicitly by consultants optimizing for schedule. If you are mid-implementation and realizing that customization decisions are being made tactically rather than strategically, it is not too late to step back and establish architecture governance.

The enterprise that succeeds with Dynamics 365 is not necessarily the one that goes live fastest. It is the one that understands, before implementation, which parts of its business need to remain flexible and builds a system architecture that protects that flexibility. That requires more planning, more discipline, and more serious engagement with technical architecture decisions. It also results in a system that still works years later when your business has changed in ways you could not have predicted during implementation planning.

This is not a problem that faster implementation or lower-cost consulting can solve. It is a problem that requires CIOs and enterprise architects to make genuine strategic choices about where customization creates value and where it creates technical debt. The organizations that make those choices deliberately are the ones that get long-term value from Dynamics 365. The others end up managing the consequences.

Topics: #Dynamics365Architecture #EnterpriseCustomization #Dynamics365Strategy #CustomizationStrategy #EnterpriseERP #Dynamics365Implementation

Dynamics 365 Finance Month-End Close: Why Manual Review Processes Eat Three Weeks of Your Finance Team’s Time

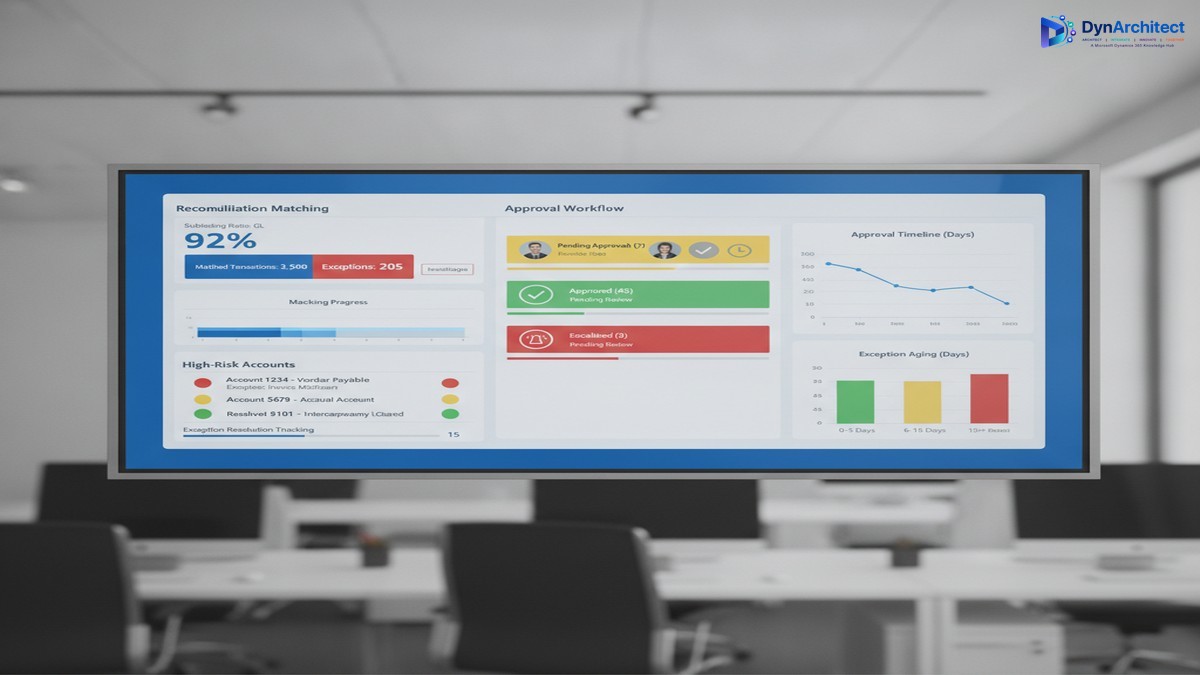
Dynamics 365 Finance month-end close dashboard with reconciliation and approval workflows

Your CFO expects the month-end close to take five business days. Your finance team knows it will take at least three weeks, if nothing breaks. Neither estimate is wrong, but the gap between them exposes a concrete operational problem that Dynamics 365 Finance can address—if you design the close process deliberately rather than simply importing Excel workflows into a new system.

The root cause isn’t Dynamics 365 Finance’s fault. It’s that most organizations have never mapped the actual work their finance team performs during month-end close, and they transfer that unmapped work directly into D365 Finance, where the same manual reviews and exception-handling steps consume the same time, just now in a new interface. This article walks through the hidden work that extends close cycles and the specific D365 Finance capabilities that can compress it without sacrificing control.

The Hidden Work in Month-End Close

Finance teams perform three categories of work during month-end close: transactional, reconciliation, and review and approval. The first category moves quickly in Dynamics 365 Finance because transactional posting, reversal, and period closing are automated. The second category, reconciliation, is where most organizations find that D365 Finance has given them new tools but not a fundamentally different process. The third category, review and approval, is where the real bottleneck sits.

Reconciliation requires matching subledger balances to the general ledger and resolving differences. In Excel, this meant exporting general ledger data to a spreadsheet, exporting subledger data to another spreadsheet, and then manually or with crude formulas, finding and categorizing exceptions. In Dynamics 365 Finance, you have automated reconciliation matching, but it still requires manual exception review if a transaction doesn’t auto-match due to timing, rounding, or data misalignment. Many organizations don’t implement the reconciliation matching engine at all, and instead build custom reconciliation reports that they then export and manually review in Excel. That defeats the purpose. Organizations that do implement reconciliation matching still need a process to review and approve the remaining exceptions. If your exception resolution process is ad-hoc (email threads, informal approvals, updates made directly to the database by whoever has time), month-end close becomes a game of whack-a-mole where resolving one exception creates new work elsewhere.

The review and approval stage is where time collapses. At this stage, the close is technically complete from a system perspective—all journal entries have posted, all subledgers have been reconciled, and all accounts have been reviewed—but finance leadership has not yet signed off. This is where your CFO’s five-day close hits the wall. The approval process usually means compiling reports, distributing them via email, waiting for responses, and manually tracking who has signed off and who is still reviewing. If a reviewer finds an error, the journal entry gets reversed, the approver list gets longer, and the cycle starts again. If multiple reviewers work simultaneously without a structured change-control process, they may unknowingly create conflicting updates.

Dynamics 365 Finance month-end close dashboard with reconciliation and approval workflows

Why Dynamics 365 Finance’s Tools Don’t Automatically Solve This

Dynamics 365 Finance has features that address each of these stages. It has reconciliation matching for subledger-to-GL matching. It has a journal approval workflow that routes entries to approvers. It has role-based security so that only authorized users can post to specific accounts or cost centers. But implementing these features doesn’t automatically translate to a faster close if the underlying process is not designed first.

The most common implementation pattern is this: the team implements D365 Finance features directly as they exist, with minimal process redesign. The reconciliation matching engine gets enabled but with no workflow for resolving exceptions. The journal approval workflow gets configured but with a long approval chain that mirrors the existing email-based approval process—five to ten approvers in sequence, each seeing the full entry list and taking days to respond. The role-based security gets configured but not used strategically to separate data entry from approval, so reviewers still spend time wading through draft entries they didn’t create.

The result is that Dynamics 365 Finance executes the existing process more efficiently at the transactional level but doesn’t reduce the actual elapsed time, because the transactional work was never the bottleneck. The bottleneck is the manual review and approval stage.

Structural Changes That Compress the Close Without Cutting Corners

Three structural changes to your close process, combined with deliberate use of D365 Finance features, can reduce elapsed close time from three weeks to ten to twelve business days while improving control and auditability.

The first change is to separate data entry from approval. Assign data entry (journal posting, subledger reconciliation, exception resolution) to one team and approval to another team that has not touched the data being approved. This isn’t a new idea, but Dynamics 365 Finance makes it operationally feasible. Your reconciliation team can mark exceptions as resolved in the reconciliation matching workspace, but the approval team (the controller, the finance director, or a designated approval group) can see which exceptions were resolved and review them before the general ledger is locked. By structuring permissions so that data entry users cannot post approved entries directly, and approval users see only high-level summaries plus exceptions, you cut the time approvers spend searching for relevant data. A 30-minute approval review of 500 transactions becomes a 10-minute review of 12 exceptions.

The second change is to compress the approval chain. Instead of sequential approval (entry review by the subledger owner, then the cost center manager, then the controller, then the finance director), design approval stages in parallel when possible and in short sequence when approval must be serial. Most organizations can reduce approval stages from five to three without sacrificing control. The subledger owner approves their subledger reconciliation in the reconciliation workspace. The controller approves all entries and reconciliation exceptions at once, using a dashboard that shows high-risk accounts and exceptions flagged by the reconciliation matching engine. The CFO reviews a summary and sign-off letter rather than individual entries. This parallel-where-possible, serial-only-where-necessary structure typically reduces approval cycle time from eight to ten days to two to four days.

The third change is to automate exception escalation. If an exception is not resolved within a specific time window (for example, three days after period end), Dynamics 365 Finance can send an automated alert to the responsible approver. This prevents exceptions from sitting in a queue and blocking closure. The escalation alert also creates an audit trail—it records when the exception was identified, when the alert was sent, and when it was finally resolved. This audit trail is exactly what your auditors want to see, and it removes the need for a manual exception log that has historically been built in Excel and updated sporadically.

The Realistic Implementation Timeline

These changes require careful process design before the configuration work begins. A typical implementation that adds close-process automation to an existing D365 Finance deployment takes three to four months. The first month is spent mapping current close processes, identifying where exceptions occur most often, and defining the data risk thresholds that trigger approval. The second month is spent building the reconciliation matching rules, configuring the approval workflow, and setting up the exception escalation alerts. The third month is spent running parallel close cycles (the old manual process running alongside the new D365 Finance process) so your finance team can validate that nothing is being missed. The month-end close itself becomes faster immediately, but the real efficiency gain comes in the fourth and fifth close cycles, after your team is comfortable with the new workflow.

The cost of this implementation is not primarily in configuration—it’s in the time your finance team spends away from month-end close activities while the process is being redesigned and validated. Expect to allocate one senior accountant and one finance operations person for two to three months. Expect also that your close process will feel slower for the first month or two after go-live, because your team is learning new workflows and validating that every exception has been captured and resolved. This is normal, and it is not a sign that the implementation has failed.

Making the Business Case to Leadership

The case for process redesign around month-end close is straightforward for a CFO: it frees up your most experienced team members from manual review work so they can focus on analysis, forecasting, and planning. It compresses the time it takes to close the books, which gives leadership three extra weeks per quarter to make decisions based on actual financial results rather than waiting for the close to complete. It creates an audit trail for month-end close activities, which strengthens your internal control environment and simplifies external audits. It reduces the error rate in close processes because exception resolution is now tracked and validated rather than handled ad-hoc.

The cost is three to four months of implementation effort plus the finance team’s time during the redesign phase. The benefit is a close process that runs three to four days faster and a finance team that spends ten to twelve fewer days per month on manual reconciliation and approval work. Over the course of a year, that’s enough time for your finance team to take on strategic work that they couldn’t fit before.

Month-end close doesn’t have to be a three-week sprint every month. It can be a structured, partially automated process that your finance team completes in two to three weeks while also having time to analyze variances and support the business. The tooling exists in Dynamics 365 Finance. The missing piece is usually a deliberate process design that aligns the close workflow with your organization’s risk tolerance and approval structure.


About Routeget Technologies: Routeget Technologies helps mid-market and enterprise organizations streamline financial operations with Dynamics 365 Finance. If your finance team’s close process is consistently running longer than expected, contact us for a process assessment that identifies where Dynamics 365 Finance can reduce manual work without cutting corners on control.

#DynamicsFinance #MonthEndClose #FinanceTransformation #FinanceOperations #CFOStrategy #DynamicsImplementation

Power BI Financial Dashboards for Dynamics 365 Finance: Building the Business Case Without Overcommitting Resources

Power BI financial dashboard with budget variance analysis and cash flow metrics

Your Dynamics 365 Finance implementation is live. You saw a beautiful demo six months ago showing real-time cash flow forecasts, interactive budget variance analysis, and executive dashboards that updated daily. The vendor closed by saying, “You can build this in Power BI in a few weeks.”

Now, three months into your Power BI financial analytics initiative, your internal team is debating whether to hire a permanent analytics hire, your costs have tripled, and you’re six weeks behind on the first dashboard. That demo didn’t account for your Chart of Accounts structure complexity, your subsidiaries’ separate accounting policies, or the fact that your finance team still reconciles GL accounts in a spreadsheet no amount of automation can entirely replace.

This gap between demo and reality is not unusual. It is the norm. Finance organizations that understand this gap upfront build realistic programs that deliver value in 18 to 24 months. Those that don’t end up with abandoned dashboards, frustrated finance teams, and justifiably skeptical CFOs.

What Power BI Actually Brings to Finance

Power BI is a visualization and analytics tool. It is not magic, and it is not a substitute for good financial process discipline. What it does extremely well is surface patterns and relationships in data that spreadsheets obscure, refresh reporting faster than month-end manual consolidations, and give finance teams access to their own analysis without waiting for IT to run scripts.

For Dynamics 365 Finance specifically, Power BI connects directly to your financial data through Dataverse, Power BI’s native Dynamics 365 connector, or Azure Synapse Link for larger datasets. This means your dashboards can show live GL balances, budget variances, or cash flow trends without your finance team building and maintaining ETL jobs in Excel. That alone is valuable. It also means your governance and data accuracy problems do not disappear; they become visible much faster.

The Real Cost of Financial Analytics

Most finance organizations underestimate three cost categories when planning Power BI dashboards.

First: Data Preparation and Model Building. Your chart of accounts is not flat. Your GL transactions include reversals, accruals, and period-end corrections. Your budget data lives in multiple systems (ERP, planning tools, legacy spreadsheets). Your actuals do not reconcile automatically to budget because your organization budgets differently than you post GL transactions. Building a semantic model that surfaces truth instead of confusion requires someone (or a team) to understand your financial processes deeply enough to build that logic in Power BI’s data model.

A consultant or senior analyst can build a basic cash flow dashboard in two weeks. Building a GL variance analysis dashboard that your business partner actually trusts because they understand where the numbers came from requires six to eight weeks of data modeling, testing, and refinement. Multiply this by five to ten dashboards, and you are talking about 10 to 15 person-months of skilled analytical work before you have a production-grade Power BI program.

Second: Governance, Security, and Access Control. Power BI’s row-level security (RLS) model is powerful and flexible. It is also complex. If you need controller-level access to consolidated GL but division heads to see only their own GL, and you want budget managers to compare actual to budget within their business unit, you need a well-designed RLS strategy built on top of your Dynamics 365 security roles.

Adding RLS after dashboards are built is expensive. Building it from the start means taking time to model your organizational hierarchy, decide how P&L responsibilities map to GL structures, and test that every user sees exactly what they should. In large organizations, this is not a week-long project. It is often three to six weeks of iterative testing, edge-case resolution, and alignment with your controller’s office.

Third: Change Management and Training. Your finance team has used the same reports for five years. A new dashboard that shows variance differently, calculates metrics in an unfamiliar way, or requires them to self-serve analysis instead of calling the accounting department will be questioned. Finance organizations move slowly because accuracy matters. Spending time to train your finance team, document assumptions in your dashboards, and let them develop confidence in new analytics before expanding access is essential. Organizations that skip this step often see adoption stall after the initial roll-out.

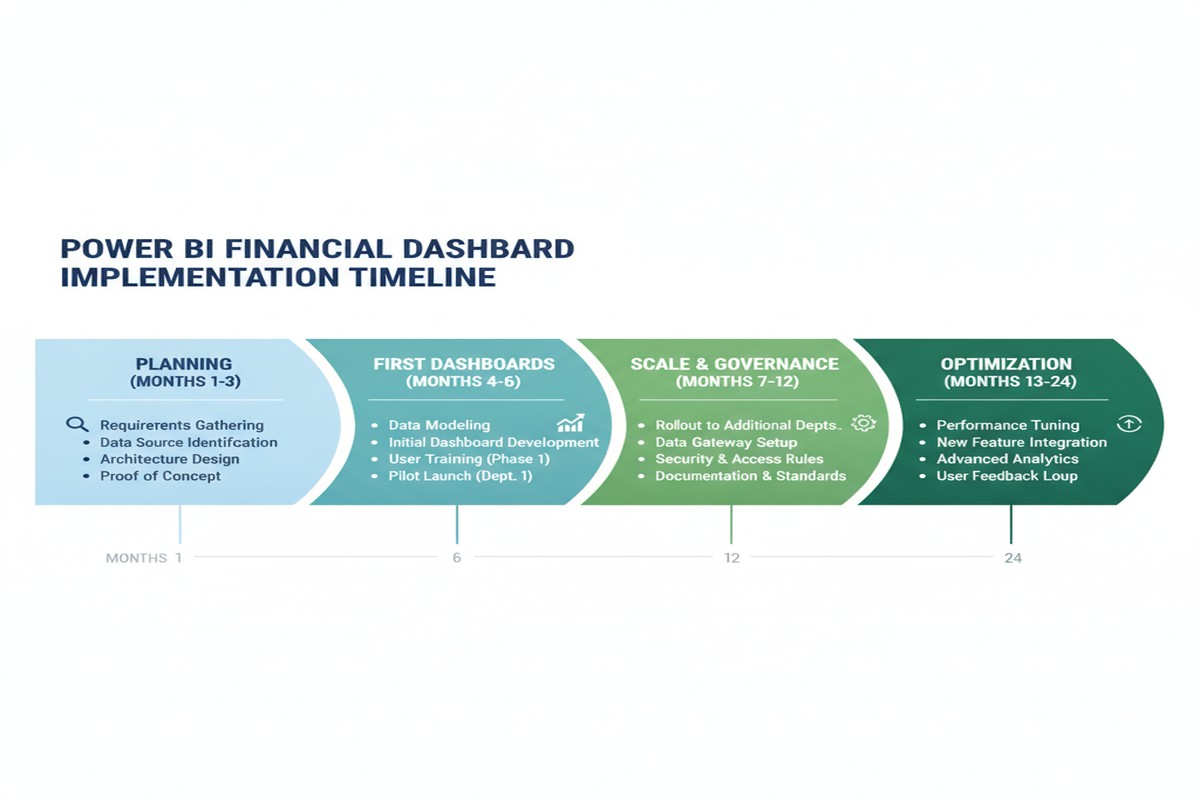
Timeline showing 24-month implementation roadmap for Power BI financial analytics

Timeline Reality for Finance Dashboards

A realistic timeline for a production-grade Power BI financial analytics program looks like this:

Months 1 to 3: Planning, Architecture, and Foundation Building. You define which dashboards matter most. You audit your GL structure and data quality. You design your semantic model. You plan your security model. You do not build dashboards yet. This period is invisible to executives but essential to avoid rebuilding everything later.

Months 4 to 6: First Dashboards and Pilot Testing. You deliver one to two core dashboards (GL overview, budget variance, or cash flow) to a pilot group of power users. You iterate based on their feedback. You refine the data model. You document assumptions. You do not declare victory.

Months 7 to 12: Scale and Governance. You build three to five additional dashboards based on lessons from the pilot. You harden your security model. You establish SLAs for data refresh (daily, hourly). You set up processes for your finance team to request new analysis without recreating dashboards.

Months 13 to 24: Optimization and Organizational Adoption. Your dashboards are live for most of the organization. You optimize performance, add forecasting or predictive capabilities, and integrate with planning tools. Real adoption happens here, not during launch.

Eighteen months is a conservative estimate for a mid-market organization. If you are larger or your GL is more complex, add six months. If you try to compress this to nine months, you will compromise on governance or data quality, and you will pay for it later.

Realistic ROI and Business Case Framework

Financial analytics ROI is real but indirect. You should not expect Power BI alone to reduce headcount. What you should expect is that your finance team spends less time on manual reporting and more time on analysis, and that finance leaders can answer ad hoc questions faster.

For a CFO building a business case, frame the ROI around three levers:

Time Savings. If your month-end close takes ten days and two weeks of follow-up reporting questions, and Power BI cuts that to eight days with faster ad hoc answer time, quantify that. At a typical all-in cost of $200 to $250K annually for a finance analyst, saving 10 to 20 percent of their time across the team is meaningful.

Decision Velocity. Finance leaders who can answer a business partner’s variance question in hours instead of days make better decisions. Quantify this carefully (it is subtle), but it is real. Include it in your business case as a strategic benefit, not just cost savings.

Risk Mitigation. Faster visibility into GL accuracy, budget performance, and cash flow trends reduces surprises at board meetings. This is hard to quantify but worth naming in your business case, especially if you have had historical GL variance issues or cash flow forecasting failures.

Pragmatic Next Steps

Before committing to a large Power BI investment, take these steps:

Start with a pilot. Pick one financial process (GL variance analysis or monthly cash flow forecasting) and build a proof of concept with one to two analysts over 8 to 12 weeks. Spend one week on planning. Spend six weeks on data modeling and development. Spend one week on pilot testing. Use what you learn to scope the larger program.

Assess your data quality. If your GL balances don’t reconcile to your trial balance, or your budget data lives across five systems, fix that first. Power BI will not solve data quality problems; it will highlight them.

Define governance upfront. Decide who owns the semantic model. Decide how often dashboards refresh. Decide how users request new analysis. These decisions are boring but essential.

Budget realistically. A multi-dashboard financial analytics program for a mid-market organization costs between $200K and $500K over 18 to 24 months, including internal team time, consulting, and platform licenses. If your CFO is not comfortable with that range, you are not yet ready for the program.

The Business Case That Actually Works

Power BI for financial analytics delivers real value. The organizations that see that value are those that plan for 18 months, budget realistically, and recognize that the real cost is not the software license or the initial implementation. It is the investment in data quality, governance discipline, and finance team capability that makes analytics actionable.

The demo you saw six months ago was real. You are just building the foundation to support it.


Routeget Technologies helps organizations build data-driven financial organizations through Dynamics 365 Finance implementations and Power BI analytics programs that actually fit your organization’s reality. Reach out to discuss your financial analytics roadmap.

#PowerBIFinance #FinancialAnalytics #DynamicsFinance #BusinessCaseAnalysis #CFOStrategy #FinancialReporting

Building Approval Loops in Power Automate That Don’t Fall Apart

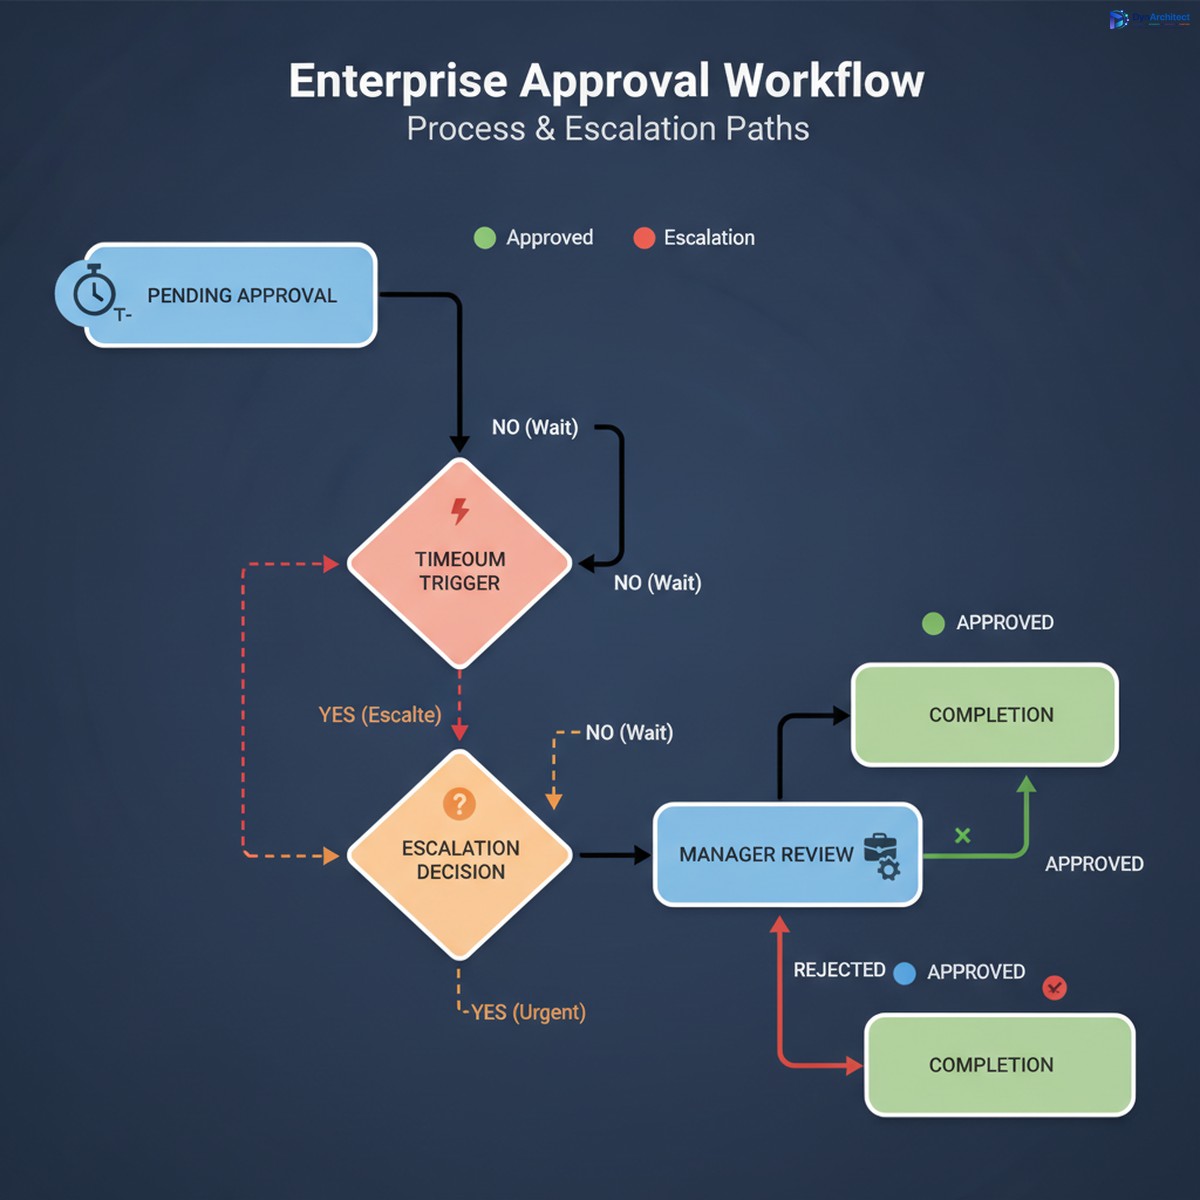
Enterprise approval workflow dashboard with timeout and escalation management

Approval workflows sound simple in theory. Send a request, wait for response, move forward based on outcome. But somewhere between the proof of concept and production reality, approval loops accumulate failures so quietly that six months pass before anyone notices half your approvals never closed, escalations silently vanished, and the finance team is manually reworking approvals that should have auto-completed.

The gap between what you design and what survives in production typically opens in three places: timeouts on waiting responses that get no notification when they expire, escalation logic that triggers but assumes someone is actually paying attention to a hand-passed email, and no mechanism to detect an approval that was submitted but never reached the assigned approver. Each failure is small enough to dismiss as a one-off, but they compound quickly enough that the flow looks broken even when it is technically working.

This isn’t a flaw in Power Automate itself. Approval loops are possible and reliable at scale. But they require specific configuration practices that most documentation glosses over because they fall outside the “happy path” that gets written up in tutorials. The actual production implementation involves setting constraints, monitoring for stuck states, and building reminders and escalations that stay responsive even when people are unavailable.

The Three Failure Modes in Approval Workflows

Power Automate approval workflow state transitions showing timeout and escalation paths

The first and most common failure mode is the timeout without escalation. By default, an approval waits forever for a response. In production, this means a request sits in someone’s inbox for days while they’re in meetings, on vacation, or simply overwhelmed. The approver eventually rejects or approves, but by then the original requestor has stopped watching and other parts of the process have already stalled or errored out. Better practice: set an explicit timeout on the approval action itself. Don’t wait indefinitely. Use a 48 or 72 hour window depending on your business, and when the window closes without a response, trigger an escalation workflow instead of just abandoning the request.

The second failure mode is silent escalation that nobody actually sees. When a primary approver times out, many designs hand off to a backup approver or manager using a simple email notify step. But email is not a reliable alert mechanism inside workflows. The backup approver doesn’t get a red flag in their task management system. The approval request lands in a folder with two hundred other emails. Three days later, the request is still pending, nobody knows why, and you discover by accident that the backup approver never saw it. Better practice: when escalating, create an explicit escalation record in a tracked system, assign it directly to the backup approver through Power Automate’s assignment or Outlook task creation, and log the escalation so you can report on it later.

The third failure mode is the orphaned approval that disappears from tracking. An approver response can fail for reasons outside your control: the response email is misrouted, the approval action times out before the response is processed, or the flow logic that handles the response encounters an error and doesn’t retry. In many cases, there’s no notification that the approval failed, so it simply stays pending forever. The requestor has moved on, the approver thinks they responded, and your audit log shows a request that was submitted but never resolved. Better practice: attach a completion deadline to every approval, separate from the timeout. If the approval has not resolved by that deadline, automatically resolve it with a fallback decision, and send a notification that escalation occurred.

Implementing a Production-Ready Approval Loop in Power Automate

Start with an approval request that includes a deadline. Use a scheduled cloud flow as a failsafe trigger that runs daily or every six hours and checks for approvals that have been pending longer than expected. If one is found, resolve it by creating a comment on the original record and moving the process forward with a fallback decision (typically approval, pending manager review). This sounds like it adds complexity, but it prevents the entire workflow from silently stalling.

The approval action itself should have a timeout set explicitly, measured in hours rather than days. In Power Automate’s approval action settings, set “Time Out In” to a value between 24 and 72 hours depending on your business rhythm. When that timeout is reached, the flow should not just stop. Instead, trigger an escalation workflow that routes to a backup approver, creates an escalation record, and sends an alert through a more reliable channel than email, such as a Teams message or a specific task in a project management system.

The escalation workflow should include logic that detects whether the backup approver is available. If the backup is out of office, the flow should identify an additional escalation level and continue upward. This requires maintaining a clear escalation path in a configuration table or SharePoint list, but it is the only way to ensure approvals don’t stall when a single person is unavailable.

Every approval flow should also log its state transitions to a tracking table. Each time an approval is requested, assigned, escalated, responded to, or timed out, write a record to a SharePoint list or a database table that includes the approval ID, the approver name, the action taken, the timestamp, and the outcome. This log is what makes it possible to audit the flow later, identify patterns of missed approvals, and debug failures when they occur. Without logging, you’re flying blind.

Error Handling and Retry Logic

Approval flows should not fail silently. Every step that might fail, particularly the send approval action itself, should have an error handler configured. If the approval action fails, the flow should retry once or twice before escalating. Use the retry policy built into cloud flows to automatically retry transient failures without adding extra steps.

The response handling section is where most approval flows fail operationally. The flow waits for a response, the response arrives, and then the flow tries to parse it or use it in a downstream action. If the response object is malformed or the downstream action fails, the approval is left in an inconsistent state. Configure error handling around the response processing step, and if it fails, log the failure, notify an administrator, and set the approval to a manual-review state so it can be handled by a human.

Avoiding the Common Pitfalls

Many approval flows make the mistake of embedding the approval timeout in a scheduled flow instead of setting it on the approval action itself. This doubles the complexity and introduces a race condition where the approval might respond after the timeout is checked but before the scheduled flow resolves it. Set the timeout on the approval action, not as a separate scheduled check.

Another pitfall is using the approval owner’s email address to send escalations. Escalations should be routed through the actual escalation workflow, not as emails copied to a backup. If the email approach is used, the escalation has no status tracking and no way to know whether the backup actually saw it.

A third pitfall is assuming that because an approval was sent, it was received. Always add a receipt confirmation step after sending the approval, using a follow-up flow or a scheduled check that verifies the approver’s status. Some organizations send a brief Teams message or Slack notification alongside the approval to ensure the approver knows to check their Outlook task.

Monitoring and Iteration

Once an approval loop is deployed, the real work begins. Run reports monthly on approval cycle times, timeout rates, escalations, and manual overrides. If escalations are happening more than 5% of the time, the timeout is too aggressive or the approval routing is misaligned. If timeouts rarely occur, you may be able to shorten the window to speed up the overall flow.

Track approvers who consistently miss deadlines and consider reassigning their responsibilities. Some approval routing that looks good on paper breaks down in practice because a particular approver is overloaded or rarely checks their tasks.

Approval loops are a reliable part of any organization’s workflow infrastructure when they are designed with production reality in mind. But that reality is messier than most documentation acknowledges. The difference between a working approval flow and one that silently breaks down is attention to timeouts, escalations, and monitoring from the start.

About Routeget Technologies: Routeget specializes in enterprise transformation across the Microsoft cloud ecosystem, including Power Automate automation and workflow optimization. Organizations looking to build production-ready approval systems that scale reliably can engage our consulting team to design governance frameworks, implement monitoring patterns, and optimize approval workflows for their specific operational needs.


#PowerAutomateApprovals #ApprovalWorkflows #EnterpriseAutomation #PowerAutomate #WorkflowOptimization #DynamicsIntegration

Preventing Unintended Blocks: Implementing Data Loss Prevention Policies Without Paralyzing Your Power Platform

Data Loss Prevention governance dashboard with security controls and policy checkpoints

Data Loss Prevention (DLP) policies in Power Platform sit at an uncomfortable intersection: they’re necessary for governance, but they’re easy to misconfigure so that your first draft breaks legitimate business workflows. Most organizations learn this the hard way, after a DLP policy ships and silently blocks connector calls in production automations. A finance team’s approval workflow mysteriously stops routing to Slack. A sales process can’t write leads to an external data warehouse. Nobody notices until something breaks on a Tuesday afternoon.

The challenge is structural. DLP policies operate at the connector level, not at the individual action level, so a single overly restrictive rule can disable entire classes of integrations across your tenant. The organizations that avoid catastrophic blocks are not the ones that build the most restrictive policies first. They’re the ones that start with a clear map of what data actually needs protection, then craft policies targeting that specific risk rather than trying to lock down anything that looks suspicious.


Understanding DLP in Practice

A Data Loss Prevention policy defines which connectors can share data with each other. You classify connectors as Restricted Data (like SQL Server, Dataverse, SharePoint), Limited Business Use (like Slack, Teams), or General. The policy enforces rules like “data from Restricted connectors cannot flow to Limited Business Use connectors.”

The critical point most organizations miss: these classifications are tenant-wide and apply to all environments unless you create specific overrides. A policy blocking Slack from receiving SQL Server data blocks it everywhere, for everyone. That sounds straightforward on paper, but most organizations have at least a dozen legitimate integrations that move data between categories that look “risky” in isolation. A financial reporting automation sending a Slack summary of daily sales. A customer service workflow pulling account data from Dataverse to an external ticketing system. A sales tool reading opportunities from Dynamics 365 for pipeline visibility.

None of these are data leaks. All would be blocked by an overly broad DLP policy.


Common DLP Mistakes

The first mistake is auditing too aggressively. Many organizations activate DLP in Audit mode to collect data on actual usage patterns without blocking anything. The theory is sound. The practice is crushing volumes of alerts, most false positives or unavoidable business integrations. Teams see 10,000 violations in a month with no systematic way to separate real concerns from critical workflows. They either give up on enforcement or ship a policy based on highest-volume alerts, which usually fails.

The second mistake is confusing audit alerts with actual risks. Not every data flow represents a security problem. A sales team’s external deal tracker is not a breach waiting to happen just because it reads from Dataverse. An approval workflow sending Teams notifications is not exposing proprietary information just because Teams is classified as Limited Business Use. Organizations conflate appearance of complexity with presence of risk, then tighten policies to zero out complexity. This transfers risk to shadow IT. People still move the data they need. If official integrations are blocked, they’ll build their own via Excel and manual uploads.

The third mistake is shipping policies without environment-level testing. DLP policies are tenant-scoped by default, so a broad policy breaks production systems across business units before validation in staging. The correct pattern is testing in specific environments, monitoring real workflow impact, then rolling out to the entire tenant. Executives want company-wide governance immediately, but breaking multiple workflows costs more than a phased rollout.


Building a Working DLP Policy

Enterprise security infrastructure showing data governance and compliance controls

Start with an actual inventory of your integrations, not a theoretical one. Go through your most business-critical Power Automate flows (approval automations, financial data movements, sales processes) and document which connectors they use and what data moves between them. Don’t ask business owners what they think is critical. Inspect the flows. You’ll find integrations that look risky but are actually essential. A manufacturing team’s work order system pulling from Dataverse and posting to an external MES system. A finance team’s journal import flow reading CSV from a web service and loading into Dynamics 365. These would fail under restrictive DLP, and stakeholders will fight when they break.

Second, classify connectors based on actual data sensitivity, not theoretical risk. Dataverse and SQL Server carry genuinely sensitive data and warrant strong controls. SharePoint carries mixed content and needs nuance. Slack and Teams are low-sensitivity by themselves but become sensitive only when receiving restricted data. The mistake is classifying Slack as Limited Business Use, then treating any flow from SQL Server to Slack as violation. That blocks the finance team’s daily sales summary, sales team’s pipeline snapshot, and customer service team’s alert automation. These aren’t leaks, they’re operations.

A better approach is classifying Slack as General for normal use, then building specific policy exceptions for flows that legitimately move summarized data from restricted systems. This requires identifying those flows in advance.

Third, build your initial policy at the environment level, not tenant-wide. Create a restrictive policy for sandbox and development environments. Test your business-critical flows in staging with your proposed tenant-level DLP policy before shipping. You will find your policy breaks something unexpected. Refine the policy, create flow-specific exceptions, or move that flow to a dedicated environment with looser rules. All beat discovering your policy broke production automations.

Fourth, document every policy exception and why. When carving out exceptions for flows moving data between connector categories, write down the business reason, data classification, and approval stakeholder. This prevents exceptions from becoming a free-for-all over time. Each exception should have a clear owner and documented security rationale. Quarterly audits will make sense of your policy instead of inheriting blackbox carve-outs.


Monitoring and Maintenance

Finally, review your DLP policy every quarter. Power Platform gets new connectors regularly. Integration patterns change as teams adopt new tools. A policy from Q1 might be outdated by Q3. Quarterly review catches new patterns, adjusts classifications as you learn more about actual data flow, and retires unnecessary exceptions. Organizations that ship a policy and never touch it end up either too restrictive (silently blocking workflows) or too permissive (defeating the point).

Set up Power BI reporting against Power Platform audit logs. Create dashboards showing DLP violations over time by connector pair, environment, and flow. Most organizations find 80 percent of violations come from a handful of flows or connector combinations. For each, decide: Is this legitimate and needs exception? Is it shadow IT to replace? Or is it misconfigured? Document the decision.

Engage with solution architects and flow owners before violations happen. After quarterly reviews, share audit logs with teams owning business-critical integrations. This conversation prevents surprises and keeps teams aligned rather than feeling DLP is something done to them.


DLP policies are not set-and-forget security controls. They’re part of ongoing governance between your security team, platform team, and business stakeholders. Organizations implementing DLP successfully are not enforcing maximum-security policies. They start with a clear picture of what they’re protecting, build policies addressing that specific risk, and refine them as their integration landscape evolves. That approach is slower than dropping maximum-security on the entire tenant, but it’s the only approach that works in organizations where Power Platform ties directly to business operations.


#PowerPlatformGovernance #DataLossPrevention #DLPPolicy #PowerAutomateIntegration #MicrosoftCloudSecurity #EnterpriseGovernance

Dynamics 365 Omnichannel for Customer Service: Real Service Management Starts After Configuration Ends

Omnichannel Customer Service Featured

Omnichannel for Customer Service in Dynamics 365 promises a single, unified workspace where agents handle customer interactions from email, chat, social media, and phone without context switching. The promise is compelling: less time hunting between systems, faster resolution, better customer experience.

Omnichannel customer service dashboard in Dynamics 365

The reality is more complicated. Configuration is one thing. Operating omnichannel at scale—where fifty agents handle thousands of interactions daily across five channels—is another. Many organizations configure Omnichannel correctly in a test environment, deploy to production, and then discover that the system they built doesn’t match how work actually flows in a busy contact center.

Omnichannel’s Foundational Premise: Unified Workload Management

Customer service routing and queue management system

Omnichannel organizes customer interactions into a queue-based model. Every incoming chat, email, email-to-case conversation, social message, and phone call flows into a work item. That work item contains the customer context, conversation history, and metadata. Agents see a unified interface and pick up work items in order of priority, assignment rules, or routing logic.

The configuration itself is straightforward: define queues by channel or by business function, set up routing rules based on agent skills or availability, configure notification behavior, define service-level targets (SLA), and establish escalation paths. Most organizations complete this within a few weeks.

But here’s where the gap appears: once omnichannel starts processing real customer interactions at real volume, several operational realities emerge that no configuration screen fully prepares you for.

Issue One: Routing Logic Doesn’t Always Match Channel Behavior

Omnichannel supports skill-based routing, where work items are assigned to agents with matching skills. In theory, a chat about billing goes to agents tagged with “billing-expert,” and a social-media complaint about shipping goes to “escalations.”

In practice, skill tags accumulate overtime. Agents get tagged with more skills than they actually have capacity for, either because they once handled a specialized case and never got the tag removed, or because managers add skills to broaden an agent’s available work. The routing logic then becomes unreliable. A chat that should go to the most experienced agent instead goes to whoever technically has the skill but happens to be first in the queue.

Solution architects often respond by tightening the skill-assignment process and educating managers about the cost of skill inflation. But the underlying issue is that most organizations lack a systematic way to audit skill usage or enforce skill standards once omnichannel is live.

Issue Two: Phone Channel Integration Isn’t Truly Integrated

Omnichannel’s phone integration exists, but many organizations find it works best when phone calls are treated as a special case, not as peers to chat and email within the same routing logic.

Here’s why: phone interactions move at voice speed. An agent picks up a call, and the customer is already speaking. There’s no 30-second window to pull up customer records, like there is with an incoming email or chat. Phone calls also cannot wait in a queue the way digital channels can; the interaction starts immediately or the customer hangs up and calls a competitor.

Many organizations end up running phone as a parallel system within Omnichannel rather than truly integrated. Phone calls route to a dedicated phone team with their own skills, queues, and SLAs, and only occasionally transfer into the main omnichannel workspace for escalations. This defeats much of the “single workspace” promise, but it’s operationally simpler and more stable than trying to force voice into the same queue-driven model.

Issue Three: SLA Compliance Becomes Unpredictable at Scale

Omnichannel supports Service Level Agreements (SLAs) that measure, for example, “first response within 2 minutes for chat” or “resolution within 4 hours for email.” Configuration is simple: define the metric, set the target time, and choose what happens when it’s breached (notification, escalation, priority boost).

But at volume, SLA behavior becomes hard to predict. If your agents are handling 300 chat interactions per day and you have a service-level target of “first response within 2 minutes,” that means approximately 99% of your agents need to be available and responding to new chats within that 2-minute window. Missing that threshold by a few percentage points means dozens of chats violate the SLA daily.

Organizations often respond by tightening thresholds—maybe “first response within 1 minute” for very high-urgency chats—but this can paradoxically worsen agent satisfaction and error rates, because agents are constantly interrupted and switching context between work items.

The operational reality is that SLA targets need to account for actual agent capacity, not theoretical capacity. A team of 50 agents cannot sustainably respond to every chat within 2 minutes if they’re also handling email and other channels. The configuration screens don’t flag this contradiction; it surfaces only in production data.

Issue Four: Routing Rules Create Silent Failures

Omnichannel allows conditional routing rules. For example, “if the customer’s account is flagged for fraud review, route to the fraud team” or “if sentiment analysis detects high emotion, escalate to a supervisor.” These rules are powerful when they work.

They often don’t, silently. A rule might fail to fire because a prerequisite data field is empty (the customer record has no sentiment score yet), or because the rule’s condition was written too narrowly (it looks for exactly “fraud” but the account is flagged as “review-fraud-pending”). When a routing rule fails to fire, the work item doesn’t escalate and doesn’t get reassigned; it just continues down the default path.

The agent never sees a warning. The system doesn’t flag a rule failure. The work item eventually gets handled, maybe late, maybe incorrectly. Discovering these failures requires audit logs and data queries, not standard Omnichannel reporting.

Issue Five: Historical Context Fades Faster Than You’d Expect

One of Omnichannel’s core selling points is customer context. Every conversation thread, every case history, every previous interaction is visible in the unified workspace. An agent can see that a customer has contacted support three times this month about the same issue.

But in a high-volume contact center, historical context can degrade quickly. If a customer’s issue remains open for 72 hours without resolution, the record might accumulate 15 different interactions, notes, and case reassignments. A new agent picking up that conversation needs to scroll through all of that history to understand where the issue stands.

Many organizations respond by enforcing a maximum context retention policy—say, “only show interactions from the last 48 hours”—but this can mean losing important information. A customer might say, “This is the same issue I reported last week,” but the agent cannot see that previous week’s conversation because it’s been archived.

Operational Frameworks That Actually Work

Organizations that run Omnichannel successfully tend to implement several practices that don’t come out of the box:

**Skill Audit Cycles**: Quarterly (at minimum) audits of agent skills, removing skills that are no longer relevant and tightening the rules for when a skill can be assigned. This is a governance task, not a configuration task, and it requires someone’s time every quarter.

**Phone as a Managed Exception**: Accept that phone calls don’t fit the same queue model as digital channels. Establish phone as a dedicated workstream with its own routing, escalation, and SLA targets. This isn’t a failure of Omnichannel; it’s an acknowledgment of how voice works.

**SLA Targets Based on Capacity, Not Theory**: Before setting an SLA target, calculate what it actually requires. If you have 50 agents, each handling an average of 5 concurrent chat interactions, with 40 seconds average handling time, then you can sustain a 2-minute first-response target for roughly 70% of inbound chats. Set your SLA to that realistic threshold, not to an aspirational one.

**Routing Rule Validation**: Implement a monthly process to validate that routing rules are firing as expected. This means querying Omnichannel analytics to confirm that “fraud-flagged” accounts are actually reaching the fraud queue, and that sentiment-escalation rules are working. Fix silent failures as you find them.

**Context Management Policy**: Define what counts as “relevant context” for agents. Decide how far back conversation history should display (48 hours? 30 days?). Document which data fields agents need to see immediately versus which can be found in a related case. Enforce this consistently so agents know where to find what they need.

The Operating Model Matters More Than the Configuration

Many organizations approach Omnichannel as a technical implementation problem: install it, configure it, test it, go live. In reality, Omnichannel’s success depends far more on the operating model around it.

A mature Omnichannel deployment has a defined governance structure, regular audits of routing and skill assignments, SLA targets that reflect real capacity, and someone accountable for keeping it all working. Configuration is the easy part. Operations is where most organizations struggle.

If your organization is considering Omnichannel, or if you’re already running it but seeing unpredictable behavior, the first question isn’t “Is our configuration wrong?” It’s “Do we have the operational discipline to keep Omnichannel working correctly at volume?” The answer determines whether Omnichannel becomes a competitive advantage or a source of recurring complaints.

Business Central Virtual Tables Eliminate the ETL Job Between BC and Dataverse. They Also Eliminate Half Your Filter Options.

Solution architect reviewing a real-time data integration visualization between enterprise systems

A solution architect scoping a Dynamics 365 Sales rollout for a distribution client recently asked a straightforward question: does the sales team need to see live Business Central order and inventory data inside their CRM records, or is a nightly sync job good enough? The honest answer took longer than it should have, because Business Central virtual tables, the feature Microsoft built specifically to answer this question, solve it only for a narrower set of scenarios than the AppSource listing and most walkthroughs suggest. The core mechanism works exactly as advertised. Where it falls short is rarely covered in the getting-started guides, and that gap is exactly where a scoping conversation needs to happen before anyone commits to an architecture.

Virtual tables have been positioned, correctly in most cases, as the end of a certain kind of integration project: the one where someone builds a scheduled job to copy Business Central records into Dataverse so Power Apps and Dynamics 365 Sales can read them. That job needs error handling, a schema that drifts every time BC gets a service update, and someone on call when the sync silently stops. Virtual tables remove that job entirely for read-heavy scenarios, just not for every scenario, and the difference is worth planning around before it’s discovered mid-build.

How Business Central Virtual Tables Actually Work

The Business Central Virtual Table plugin, published on AppSource, gives Dataverse a way to read and write Business Central records without copying that data into Dataverse storage. Under the hood, it consumes the Business Central API (v2.0), turns each endpoint’s response properties into virtual table columns, and maps the API’s own relationships into table relations that Power Apps and Power Automate can traverse like any native table. None of that translation happens on a schedule. Every query against a Business Central virtual table becomes a live OData call back to the Business Central tenant the moment a user opens a form, loads a subgrid, or a flow condition evaluates.

That real-time behavior is the actual selling point, and it’s a legitimate one. A Dynamics 365 Sales rep looking at an account record sees the customer’s current balance and open orders as they exist in Business Central right now, not as of last night’s sync window. There’s no data duplication to reconcile, no field mapping table to maintain as BC’s schema evolves, and no separate storage cost in Dataverse for records that already live somewhere else.

What Setup Actually Involves

Getting virtual tables running is a Power Platform admin task more than a developer task, which is worth knowing before anyone estimates the work. The solution installs from AppSource into a target Power Platform environment. Inside Business Central, an administrator enables the corresponding Microsoft Entra application, listed on BC’s own Entra applications page as the option for virtual tables. In Dataverse, the Business Central Virtual Data Source Configuration table needs the target BC environment name and a default company, since every request has to resolve to a specific company context.

Microsoft ships this as a set of managed solutions rather than one package: a company reference table every request depends on, the core plugin support, a catalog of tables available from the connected BC environment, and the generated virtual table definitions themselves. Because that catalog reflects the full breadth of Business Central’s OData surface, tables aren’t visible in Power Apps by default. An admin has to open the Business Central Configuration app and mark each table an app will use, a sensible governance control once you know it’s coming, and a confusing missing-table problem the first time you don’t.

Developer workstation displaying live data flow dashboards representing database integration

The Tenant Requirement That Ends Some Projects Before They Start

The detail worth checking on the first scoping call, not discovering three weeks into a build, is that the Business Central environment and the Dataverse environment must sit in the same Microsoft Entra tenant. For an organization that has run its Dynamics footprint under one tenant from the start, this is a non-issue. It becomes a real blocker for companies that grew through acquisition and still operate a separate Business Central tenant for a subsidiary, and it comes up constantly on engagements where a client’s CRM and ERP environments were provisioned years apart, sometimes by different vendors, under different tenants.

When that’s the situation, virtual tables aren’t an option regardless of how well everything else fits, and the project falls back to a conventional integration built on Power Automate flows against the Business Central API, or a dedicated integration platform between the two systems. Confirming tenant alignment costs a few minutes of checking admin center settings. Discovering the mismatch after a Power Apps screen is already designed around virtual tables costs a redesign.

Where the Filtering Restrictions Actually Bite

Because every virtual table query is a live OData call, the filtering grammar available to a Dataverse view or an advanced find is exactly as expressive as OData’s filter syntax, and no more. Predicates like does not equal, does not contain, does not begin with, and does not end with aren’t available. A view can’t combine AND and OR groups across different columns the way a native Dataverse table allows, and filtering on related tables or calculated fields isn’t supported either, nor are charts, attachments, images, or any BLOB-backed multiline text field built on a virtual table.

None of that shows up in a basic demo, which is the actual problem. A subgrid or gallery built against a virtual table for a first pass usually works, because the first pass rarely tests anything more demanding than “show me the open orders.” The gap surfaces once a real user asks for something like “show open sales orders where the requested ship date isn’t blank and the customer isn’t on credit hold,” a query needing a does-not-equal check on one column joined with an AND against a second. A native Dataverse table handles that without anyone thinking twice. A virtual table view can’t express it, and the fix ends up being either a purpose-built custom API on the Business Central side shaped for that exact query, or pushing the filtering logic into a Power Automate flow or a canvas app formula instead of the view. Either workaround is manageable, but only if someone anticipated it, and the tutorials rarely mention it exists.

Synthetic Relationships Connect the Models, But Only One Way

Virtual tables can also link to native Dataverse tables through what Microsoft calls synthetic relationships, letting a record like a Dataverse Account display related Business Central sales orders in a subgrid without custom plugin code. Building one means creating a foreign key on the native table first, then defining the relationship in the Business Central Configuration app’s Table Relations screen, mapping the native table’s key columns to the matching virtual table columns.

The relationship, once created, isn’t editable. Changing which columns participate means deleting it and rebuilding from scratch, and refreshing the underlying virtual table’s metadata while a relationship depends on it tends to throw errors rather than update quietly. The practical implication is to stabilize the Business Central side of the schema first: it’s far cheaper to adjust a Dataverse foreign key than to reconstruct several relationship mappings after a field gets renamed on the BC side. It’s also worth knowing upfront that relationships between two virtual tables aren’t supported at all, only between a native table and a virtual table, so an architecture chaining two Business Central entities purely through Dataverse relationships needs a custom API instead.

When Virtual Tables Are the Right Call

Virtual tables fit read-heavy scenarios well: a Power App or Dynamics 365 Sales form that needs current item availability, order status, or account balance without anyone owning a sync pipeline, where the filtering the business needs stays inside basic equality and straightforward AND logic. They’re a poor fit for anything involving attachments or images tied to BC records, analytics that need to chart or aggregate BC data directly, filter logic needing negation or mixed AND/OR groups, and any architecture spanning two Entra tenants.

The habit worth building into every Business Central to Dataverse integration scope is prototyping the specific filter and subgrid scenarios the business will actually use, not a generic list view, before the architecture is locked in. Almost every gap covered here only shows up once a real filter requirement meets OData’s grammar, and that’s cheap to test in the first week and expensive to discover after Power Apps screens are already built around the wrong assumption. Teams we’ve helped scope this kind of integration get the most value out of virtual tables when the tenant check and a short filter-requirements workshop are treated as the first two deliverables, not something left until a screen doesn’t do what the demo implied it would.

Virtual tables genuinely remove a maintenance burden that used to be permanent: the sync job nobody wanted to own, the schema drift nobody wanted to chase down. What they don’t remove is the need to know, before the architecture is set, exactly which filters, which tenant, and which record types the integration actually has to support.


#BusinessCentral #DataverseIntegration #VirtualTables #PowerPlatform #ERPIntegration #DynamicsConsulting

Dynamics 365 Tax Calculation Migration Gets an Automated Tool. It Still Needs a Reviewer.

Finance systems analyst reviewing Dynamics 365 tax configuration data on a monitor

A finance solution architect I spoke with recently put the choice in blunt terms: her team’s Sales Tax configuration has worked reliably for nine years, and nobody wants to touch it, but Microsoft has made it clear that Advanced Tax Calculation, not the legacy Sales Tax module, is where indirect tax functionality in Dynamics 365 Finance is actually heading. That tension shows up in nearly every conversation about a Dynamics 365 tax calculation migration: teams know the destination, but re-keying years of tax codes, tax groups, and jurisdiction rules by hand is not a project anyone volunteers for. With the 2026 Wave 1 release, Microsoft shipped a preview feature aimed at closing that gap, and it deserves a close technical look before anyone assumes it turns migration into a one-click event.

What the Tax Calculation Migration Tool Actually Moves

The feature, officially called “Automate tax feature creation based on tax master data,” lives in Globalization Studio under Tax Calculation, and it is activated through a Feature Management flag rather than being on by default. Once enabled, it reads a legal entity’s existing sales tax master data (tax codes, sales tax groups, and item sales tax groups) and builds an equivalent Tax Calculation feature version from it, reusing the reference data rather than asking anyone to redefine it from scratch. It also maps general ledger parameters that previously lived at the legal entity level, reverse sales tax on cash discount, whether cash discount is deducted before tax calculation, and whether cash discount is calculated on an amount including tax for both customers and vendors, onto their equivalent Tax Jurisdiction Parameters in the new model. Tax code origin settings translate as well: percentage of gross amount becomes “By Gross Amount,” percentage of net amount becomes “By Net Amount,” percentage of margin becomes “By Margin,” and so on through amount-per-unit and tax-on-tax origins.

Finance systems analyst reviewing Dynamics 365 tax configuration data on a monitor

That mapping table matters more than it looks. Anyone who has manually stood up Advanced Tax Calculation before knows that recreating tax jurisdiction parameters and origin rules correctly, across dozens of tax codes, is where most implementation hours actually go. Automating that translation, even in preview, removes a meaningful chunk of the grinding part of the work.

Where the Automation Runs Into Real Constraints

The tool is scoped to one legal entity at a time, and it requires the operator to be signed into the correct legal entity before starting the process from the Tax Data Migration button in Globalization Studio. It is also explicitly unavailable for Brazil and India legal entities, so multinational rollouts will need a separate manual path for those jurisdictions regardless of how well the automated tool performs elsewhere.

Two hard limits are worth flagging before anyone schedules migration work around this tool. Tax code names are capped at ten characters in the target model, and when a naming conflict forces the tool to create a variant, it truncates the original name and appends a numeric suffix, so “Test123456” becomes “Test1234_1.” Separately, if the combined character length of the tax codes attached to a single tax group or item tax group exceeds 1,000 characters, the migration for that group fails outright with an explicit error rather than a partial or degraded result. Neither limit is exotic for a small implementation, but a legal entity that has accumulated hundreds of tax codes over a decade (which describes a fair number of established Dynamics 365 customers) can hit the 1,000-character ceiling without anyone realizing it was a live risk until the process stops.

Reading the Variant Logic Correctly

Tax code variants deserve particular attention because the tool’s behavior here is deterministic in outcome but not in labeling. When the same tax code is assigned to more than one tax group with different parameters, for instance a code marked Exempt in one tax group and configured with Use Tax enabled in another, the migration creates separate variants, such as Test10, Test10_1, and Test10_2, to preserve both configurations rather than collapsing them into one and losing data. The parameter mappings themselves come through correctly, but which suffix lands on which variant is not something to assume from naming alone. Microsoft’s own documentation notes the suffix order isn’t guaranteed to follow a predictable pattern. A reviewer needs to open each variant and check its assigned tax group and parameters directly, rather than trusting that _1 always corresponds to the first tax group alphabetically or chronologically. Skipping that verification step is the most likely way a migration looks clean in testing and then produces a wrong tax determination on a specific transaction type in production.

Cash discount handling is the other area that needs a second look rather than a rubber stamp. Because the legacy model sometimes allowed cash discount settings to diverge between the general ledger parameters and individual sales tax groups, the migration surfaces a warning wherever it detects that discrepancy instead of silently picking one value. That warning is not cosmetic. It flags a real business decision, specifically which cash discount behavior should win going forward, that the automation correctly declines to make on its own.

Two enterprise IT professionals reviewing a tax migration report and dashboard

What This Means for a Dynamics 365 Tax Calculation Migration Project Plan

None of this changes the fundamental recommendation: this is a preview feature, and Microsoft’s own guidance is explicit that it is not intended for production use yet. Treat a run of the tool as generating a strong first draft of the target configuration, not a finished migration. The realistic project plan looks like importing the latest tax configuration through Electronic Reporting, enabling the preview flag in Feature Management, running the tool against a non-production legal entity, and then working through a defined review checklist. That checklist should confirm every tax jurisdiction parameter actually matches current business intent rather than just what the legacy setup happened to contain, trace every tax code variant back to its correct tax group assignment, resolve every cash discount warning as a deliberate decision, and check the default rounding method, which the tool sets to Ordinary regardless of what a given legal entity may actually need. There is also no incremental sync: if master data changes after a feature version is created, that version does not update itself, and the team has to decide whether to regenerate a new version or maintain the delta by hand.

For a solution architect scoping this work, the honest framing is that the tool changes where implementation hours go rather than eliminating them. It removes most of the manual re-entry burden and replaces it with a structured, checklist-driven review, which for a data set of any real size is still a substantially better trade than doing both the entry and the review from a blank slate. Firms that have run tax configuration projects on both the legacy and Advanced Tax Calculation models, Routeget Technologies among them, tend to build that review checklist into the statement of work up front, specifically because the tool’s own limitations (character caps, entity-by-entity scope, and the Brazil and India exclusions) are exactly the details that get missed when a migration is treated as a single automated step instead of a reviewed one.

Teams planning a Dynamics 365 tax calculation migration over the next few Wave releases should watch for this feature’s move from preview to general availability, since GA typically brings expanded country coverage and, ideally, an incremental update path. Until then, the tool is genuinely useful for what it is: a way to stop re-keying tax codes by hand and start reviewing a generated draft instead. That is a real improvement in a project that used to have no shortcut at all, even if it is not yet the fully automated migration some teams are hoping for.


#TaxCalculationService #DynamicsFinanceOps #GlobalizationStudio #ERPTaxCompliance #TaxAutomation #FinanceTransformation