The Low-Code Business Case: How Power Platform Reduces Development Backlogs and Accelerates Digital Transformation

Most IT organizations face the same structural problem: a development backlog stretching 18 to 36 months out, while business units report growing frustration waiting for solutions to simple operational problems. A finance department needs a custom dashboard to track cash flow. Sales wants an intake form that actually reflects how their process works. Supply chain needs alerts when inventory dips below thresholds. Each request lands in the queue. Each waits.

The business case for low-code platforms like Power Platform rests not on the technology itself, but on the math: how much operational value is created when business problems move from a 24-month wait to a 2-week delivery cycle.

For IT leaders, CFOs, and CIOs evaluating low-code platforms, the question is not whether these tools work technically. They do. The real question is whether they deliver measurable business impact at a cost that justifies adoption. The answer, for most enterprise organizations, is yes, but only if implementation follows a specific framework.

What the Backlog Costs

Development backlogs exist because custom application capacity is fixed and demand is infinite. A typical enterprise development team might deliver 50 to 100 applications per year. The same organization receives 500 to 1000 business requests. The gap creates the backlog, and the backlog creates business value leakage.

Consider a realistic scenario. A supply chain leader identifies a process inefficiency in demand planning. A small automation could eliminate 40 hours of manual work per month. Waiting for development to build a solution means 40 hours per month of opportunity cost: wages, delay, error risk, and competitive disadvantage. If that problem waits 18 months in the backlog before development gets to it, the organization has absorbed 720 hours of cumulative wasted labor before the solution even ships.

Across a portfolio of 100 similar problems in a typical large organization, this cumulative delay translates to significant cost: an estimated 2 to 5 percent of operational headcount remains engaged in manual workarounds rather than higher-value work.

How Low-Code Shifts the Equation

Power Platform (Power Apps, Power Automate, Power Pages) provides business users and citizen developers the ability to build solutions without writing code. The implication is not that low-code replaces traditional development. It does not. Instead, it creates two paths: high-complexity custom applications remain with traditional development, while 60 to 70 percent of business requests now route through low-code delivery, which operates at a dramatically different speed and cost.

The numbers matter: A Power App that a business analyst delivers in 2 weeks, iterating with the customer as they work, costs roughly 5 to 10 percent of what a traditionally developed application would cost, measured in both labor and time-to-value. A Power Automate workflow that eliminates manual data entry takes a skilled developer 3 to 5 days to build and typically requires 2 to 3 weeks of requirement gathering, planning, and deployment in a traditional environment. A Power Pages portal for external customer intake can launch in 4 to 6 weeks, complete with security, branding, and integration, versus 6 to 12 months for a custom web application.

The result: IT organizations adopting Power Platform typically reduce backlog wait times from 18 to 36 months down to 4 to 12 weeks for low-to-medium complexity requests. Simultaneously, IT can allocate a larger portion of traditional development resources to genuinely complex, mission-critical applications.

The Adoption Framework

The business case for Power Platform does not materialize automatically. Organizations that simply release Power Platform and declare “go build” typically encounter governance failures, security gaps, and orphaned applications that create long-term technical debt. The business case requires a structured adoption model.

First, establish a Center of Excellence. The CoE owns governance, training, component libraries, and standards. It should include representatives from IT, security, finance, and key business units. The CoE approves and catalogs solutions, ensuring applications adhere to security and data management standards. This is not bureaucratic gatekeeping; it is risk management. Without governance, unsecured applications and data integrations accumulate and eventually force a costly remediation effort.

Second, invest in training and capability building. Not every business user is ready to build applications. The most successful organizations identify citizen developers from within their business units (typically 2 to 4 per major department) and invest in structured training. These people become the interface between business process owners and IT, translating requirements into low-code solutions. This is not a technology problem; it is an organizational change problem. Without training, adoption stalls.

Third, create reusable component libraries. Power Automate templates, Power Apps canvas components, and Dataverse models that solve common problems accelerate delivery across the organization. A business unit building a customer intake flow should not start from scratch; they should extend a template created by the first intake flow built elsewhere in the organization. Component libraries compound the speed advantage over time.

Fourth, establish metrics and governance around data. Low-code platforms make it easy to create many databases and integrate many data sources. Without clear data governance, you end up with multiple versions of the same data and reconciliation chaos. Require citizen developers to use a shared Dataverse instance for core business entities (customers, orders, inventory) and establish clear rules for when new standalone databases are appropriate.

The Measurable Outcomes

Organizations that follow this framework typically report: Reduction in backlog wait times from 18-36 months to 4-12 weeks for low-to-medium complexity applications. 30 to 40 percent reduction in total application development cost per application across the portfolio, measured in blended labor rates. 15 to 25 percent reduction in overall IT spending on custom development within 18 to 24 months, as low-code absorbs the volume of routine requests. 20 to 30 percent increase in business user satisfaction with IT delivery, measured through survey, as wait times drop and responsiveness improves. Faster time-to-value for business initiatives. A competitive response that would have taken 6 months to develop and deploy can now launch in 6 weeks.

For a CFO, the payoff translates directly: lower cost per delivered solution, faster business impact, reduced opportunity cost from delayed initiatives. For a CIO, it means selective relief on the backlog problem, allowing traditional development teams to focus on genuinely complex work rather than spending half their capacity on routine applications that low-code platforms can handle equally well.

Realistic Boundaries

This case does not claim that Power Platform solves all application delivery problems. High-performance systems, large-scale data processing pipelines, and applications requiring specialized architectural patterns remain best served by traditional development. Equally, the business case depends on organizational readiness. Adopting low-code without governance, training, and management commitment typically generates cost overruns and technical debt rather than savings.

The framework also requires ongoing investment. A CoE is not free. Component library development is iterative work. Training is not one-time. These costs are real, but for most enterprise organizations, they pay for themselves through the volume of requests moved from 18-month backlog to 8-week delivery.

Conclusion

The business case for Power Platform rests on a simple observation: the traditional development model creates a structural backlog that delays business value. Low-code platforms do not eliminate the backlog entirely, but they shift a majority of routine requests to a delivery model that is an order of magnitude faster and cheaper. For IT leaders evaluating whether to adopt, the question is not whether the technology works. The question is whether your organization is ready to implement the governance, training, and management structures required to realize the value. When those elements are in place, the math works clearly in favor of adoption.


Routeget Technologies helps organizations build Power Platform adoption strategies, establish Centers of Excellence, and accelerate digital transformation.

#PowerPlatformAdoption #LowCodeDevelopment #PowerAppsBusinessCase #DigitalTransformationROI #DevelopmentBacklogSolution #CitizenDeveloper #PowerAutomate


Power Automate Error Handling: Building Resilient Cloud Flows That Don’t Fail Silently

Power Automate Error Handling Architecture Diagram

You launch a critical approval workflow into production, and for two months it runs without obvious issue. Then Finance calls: a vendor invoice sits stuck in limbo, and the escalation that should have fired never arrived. You check the flow history. The run shows “Succeeded,” but the approval task was never created, and no notification reached anyone. Silent failure, the kind that eats hours of investigation and delays payment cycles.

This scenario repeats across organizations deploying Power Automate at scale. The default error handling behavior in cloud flows is permissive and forgiving, designed to let flows complete even when individual actions fail. This is convenient during development but disastrous in production, where a missing HTTP response, a timing issue on an approval task creation, or an unexpected data format in a downstream system turns silent into undetected. The flow completes successfully by the application’s measure, but business logic never executes. Error handling in Power Automate is not a nice-to-have feature for robustness; it is the architectural foundation that separates production-ready automation from toy scripts.

Understanding Default Behavior and Why It Fails

By default, Power Automate treats a failed action like a skip. If an “Create an approval” action times out or receives an unexpected response, the flow continues to the next step. Conditional actions branch on the previous action’s status, but most flows don’t include that branching. An approval might never materialize, yet the flow proceeds as if it succeeded, sending payment confirmations or triggering downstream systems based on assumptions about work that never completed. Notification actions often sit at the end of a flow, so if an error occurs mid-stream and the flow halts before reaching the notification step, no one knows failure occurred. The inbox has no warning. The flow history shows green. Days pass before someone manually discovers the orphaned record.

This happens because Power Automate distinguishes between a failed action and a failed flow. A single failed action can leave the flow in a half-completed state that still reports success. Production systems need explicit acknowledgment of failure, not a default assumption of continuation. Scope actions, try-catch patterns, and notification strategies are the techniques that transform Power Automate from a convenient desktop automation tool into a reliable production system.

Scope Actions and Error Handling Tiers

The core building block for error handling in Power Automate is the Scope action, which wraps a logical group of steps and exposes four possible outcomes: Succeeded, Failed, Skipped, and TimedOut. A Scope action acts like a transaction container. If any step inside fails, the Scope itself fails, and you can then use the Configure run after property to branch on that failure state. Configuring a Scope so that downstream actions only run if the Scope succeeded is the first layer of error handling.

For critical workflows, organize Scopes into layers. A “happy path” Scope contains the main logic (create approval, send notification, update records). A “validation” Scope runs first and checks input data before attempting the main workflow. An “error handling” Scope runs only if the happy path fails, containing steps to log the error, notify a human, and roll back any partial state. This layering makes the flow’s intent explicit: if the happy path fails for any reason, the error layer kicks in. If the error layer itself fails (for example, the notification system is temporarily down), that failure is also visible and can trigger escalation.

Implementing Try-Catch Patterns

A try-catch pattern in Power Automate maps to a Scope (try) followed by a Configure run after rule (catch). After a critical Scope completes, even if it failed, configure the next action to run only if the Scope failed. Inside this catch block, add steps to capture what went wrong (log the error message and flow context), notify the appropriate person or system, and decide whether to retry or abandon. For approval workflows, a catch block might check if the approval was actually created (by querying Dataverse) before sending a notification. If the approval does not exist, log the specific error and notify a supervisor that manual intervention is needed.

The catch block should not attempt to continue the main business logic. Trying to recover by re-running the failed step or guessing at a default value introduces risk. Instead, catch blocks should focus on observation (logging), communication (notification), and escalation (routing to a person or alert system). This keeps the error path simple and auditable. When a catch block executes, someone should know about it, and the flow should stop rather than creating inconsistent downstream state.

Technical Team Reviewing Power Automate Error Handling Strategy

Handling Timeouts and Asynchronous Gaps

Timeouts are a class of failure distinct from logic errors. An action that calls an external API might exceed Power Automate’s timeout thresholds (2 minutes for cloud flows, 10 minutes for desktop flows) through no fault of the flow’s logic. A synchronous HTTP action to a slow third-party API will reliably timeout in production if that API experiences latency. Asynchronous patterns are the solution: instead of waiting synchronously, send an asynchronous request and poll for the result, with explicit limits on retries and elapsed time. A Scope action wrapping an HTTP POST followed by a repeat-until loop that polls for completion gives you control over timeout behavior.

Approval actions introduce similar asynchronous complexity. When you create an approval task, the action returns immediately, but the approval itself is time-consuming. If you try to check the approval’s response in the next step and the approver has not yet responded, your flow will either wait forever or timeout. Structure approval flows so that the approval creation is one Scope, any actions that depend on the approval response are in a separate step or flow triggered asynchronously (via a Power Automate Connector trigger or notification), and the main flow completes after the approval is created. This prevents the flow from blocking indefinitely and makes it clear which parts of the workflow are synchronous and which are asynchronous.

Notification and Escalation Strategies

An error that no one knows about is still an error. Every production flow needs explicit error notification. For non-critical flows, a daily digest of failed runs might suffice, sent to a service account inbox where admins can triage them. For critical workflows, errors should trigger immediate notification to an on-call engineer or supervisor through a dedicated notification system (Teams, Slack, email, or an alert system). Configure the notification to include the flow name, the step that failed, the error message, the affected record ID (invoice number, order ID), and a direct link to that flow run in the Power Automate admin portal so the engineer can investigate immediately.

For approval workflows, escalation is the second notification layer. If an approval sits unapproved for 24 hours, send a reminder to the approver. If it sits for 48 hours, escalate to the approver’s manager or a shared mailbox. Implement this using scheduled cloud flows that query the approval status in Dataverse and send conditional notifications based on elapsed time. This prevents approvals from silently stalling because someone’s mailbox was full or the approval notification was missed.

Testing Error Paths in Production

Error handling code that is never exercised is dead code. Most flow testing focuses on the happy path because that is where the visible business logic lives. But the error path is where reliability lives. Before pushing a critical flow to production, explicitly test failure scenarios: trigger an HTTP action to a nonexistent endpoint and confirm the error is caught and logged; simulate a timeout by adding a delay action and running it during off-hours; delete a required record midway through the flow to force a lookup failure; confirm that notifications fire and escalations trigger correctly. Production flows should have a pre-launch checklist that includes error path testing, not just happy path verification.

Common Architecture Mistakes

Avoid storing error handling logic in separate flows triggered by error notifications. Flows that handle errors should be part of the same versioned flow or called as child flows with explicit control flow. Separate error-handling flows that run asynchronously can miss new versions and become stale. Avoid generic retry logic that re-runs a failed action without understanding why it failed. Some errors are transient (network timeouts) and justify a retry; others are permanent (schema mismatch, missing data) and will retry indefinitely without fixing the root cause. Inspect the error message before deciding to retry. Finally, avoid logging errors to an unmonitored inbox. Logs that accumulate without review are useless. Use a proper telemetry system or a regularly tended shared mailbox so errors are actually seen and investigated.

Building Production Confidence

Error handling is not overhead added to a flow once it reaches production; it is the architecture that transforms automation from convenience to reliability. Flows that handle errors explicitly, notify on failures, and separate happy-path logic from error-path logic run predictably and build confidence with stakeholders who depend on them. The investment in error handling upfront, through scope actions, try-catch patterns, and notification strategies, is what separates a flow that your team trusts from a flow that your team monitors anxiously.


At Routeget Technologies, we architect Power Automate solutions that scale with production demands, building error handling and resilience into automation from the start rather than bolting it on after failures occur. If you’re deploying automation at enterprise scale and need guidance on error architecture or flow governance, our Power Platform specialists can help design systems your team can maintain and trust.

#PowerAutomate #ErrorHandling #CloudFlows #PowerPlatformDevelopment #ResilientAutomation #ApprovalWorkflows #PowerAutomateArchitecture

Building Approval Loops in Power Automate That Don’t Fall Apart

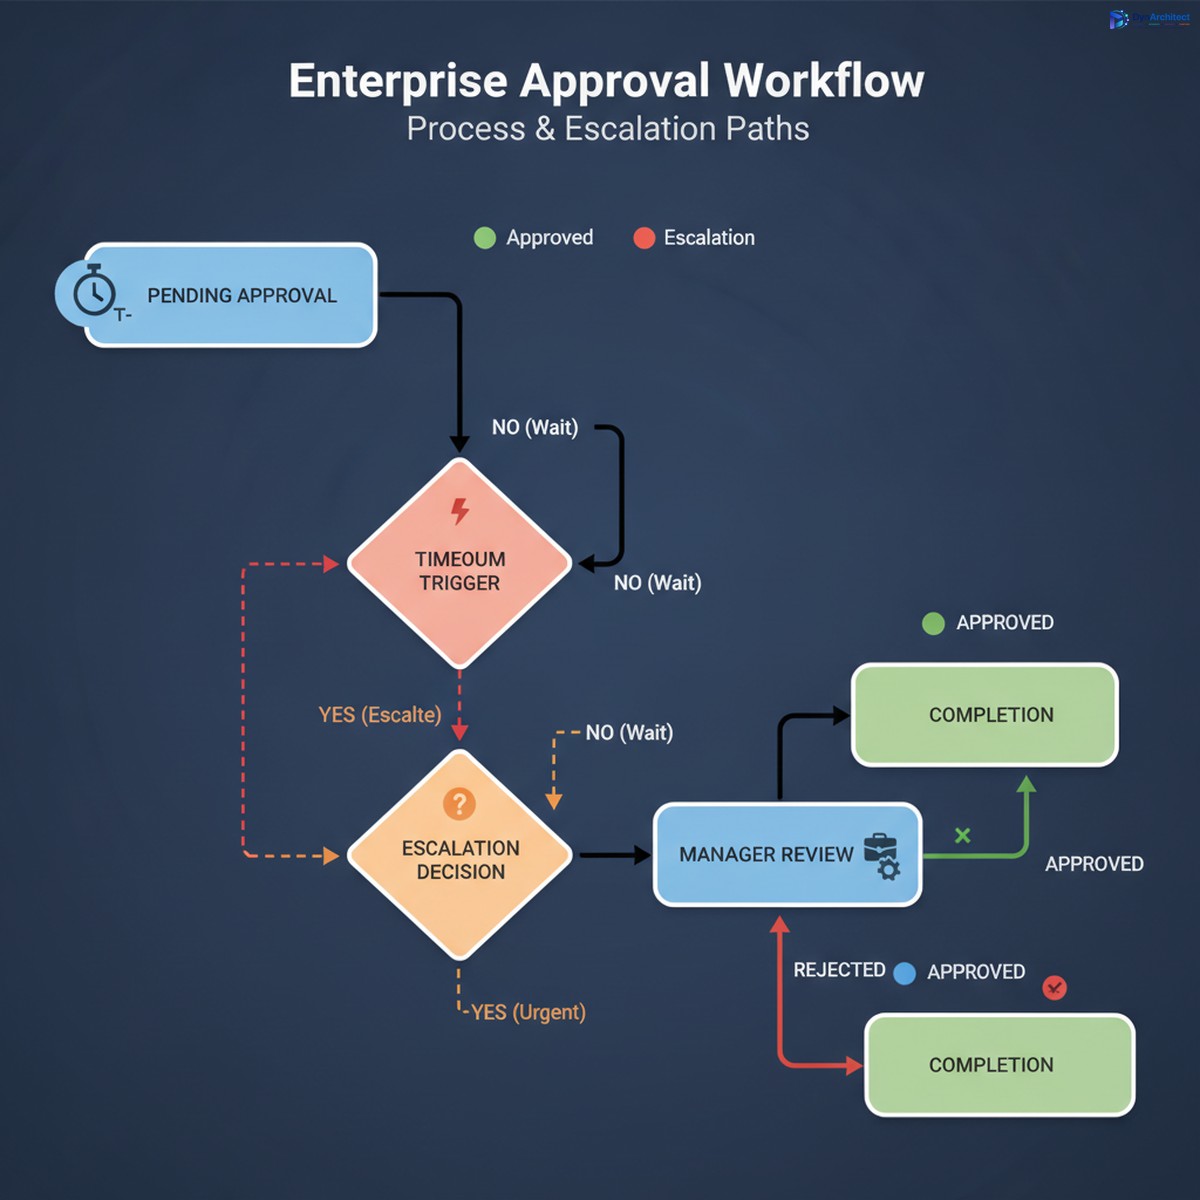
Enterprise approval workflow dashboard with timeout and escalation management

Approval workflows sound simple in theory. Send a request, wait for response, move forward based on outcome. But somewhere between the proof of concept and production reality, approval loops accumulate failures so quietly that six months pass before anyone notices half your approvals never closed, escalations silently vanished, and the finance team is manually reworking approvals that should have auto-completed.

The gap between what you design and what survives in production typically opens in three places: timeouts on waiting responses that get no notification when they expire, escalation logic that triggers but assumes someone is actually paying attention to a hand-passed email, and no mechanism to detect an approval that was submitted but never reached the assigned approver. Each failure is small enough to dismiss as a one-off, but they compound quickly enough that the flow looks broken even when it is technically working.

This isn’t a flaw in Power Automate itself. Approval loops are possible and reliable at scale. But they require specific configuration practices that most documentation glosses over because they fall outside the “happy path” that gets written up in tutorials. The actual production implementation involves setting constraints, monitoring for stuck states, and building reminders and escalations that stay responsive even when people are unavailable.

The Three Failure Modes in Approval Workflows

Power Automate approval workflow state transitions showing timeout and escalation paths

The first and most common failure mode is the timeout without escalation. By default, an approval waits forever for a response. In production, this means a request sits in someone’s inbox for days while they’re in meetings, on vacation, or simply overwhelmed. The approver eventually rejects or approves, but by then the original requestor has stopped watching and other parts of the process have already stalled or errored out. Better practice: set an explicit timeout on the approval action itself. Don’t wait indefinitely. Use a 48 or 72 hour window depending on your business, and when the window closes without a response, trigger an escalation workflow instead of just abandoning the request.

The second failure mode is silent escalation that nobody actually sees. When a primary approver times out, many designs hand off to a backup approver or manager using a simple email notify step. But email is not a reliable alert mechanism inside workflows. The backup approver doesn’t get a red flag in their task management system. The approval request lands in a folder with two hundred other emails. Three days later, the request is still pending, nobody knows why, and you discover by accident that the backup approver never saw it. Better practice: when escalating, create an explicit escalation record in a tracked system, assign it directly to the backup approver through Power Automate’s assignment or Outlook task creation, and log the escalation so you can report on it later.

The third failure mode is the orphaned approval that disappears from tracking. An approver response can fail for reasons outside your control: the response email is misrouted, the approval action times out before the response is processed, or the flow logic that handles the response encounters an error and doesn’t retry. In many cases, there’s no notification that the approval failed, so it simply stays pending forever. The requestor has moved on, the approver thinks they responded, and your audit log shows a request that was submitted but never resolved. Better practice: attach a completion deadline to every approval, separate from the timeout. If the approval has not resolved by that deadline, automatically resolve it with a fallback decision, and send a notification that escalation occurred.

Implementing a Production-Ready Approval Loop in Power Automate

Start with an approval request that includes a deadline. Use a scheduled cloud flow as a failsafe trigger that runs daily or every six hours and checks for approvals that have been pending longer than expected. If one is found, resolve it by creating a comment on the original record and moving the process forward with a fallback decision (typically approval, pending manager review). This sounds like it adds complexity, but it prevents the entire workflow from silently stalling.

The approval action itself should have a timeout set explicitly, measured in hours rather than days. In Power Automate’s approval action settings, set “Time Out In” to a value between 24 and 72 hours depending on your business rhythm. When that timeout is reached, the flow should not just stop. Instead, trigger an escalation workflow that routes to a backup approver, creates an escalation record, and sends an alert through a more reliable channel than email, such as a Teams message or a specific task in a project management system.

The escalation workflow should include logic that detects whether the backup approver is available. If the backup is out of office, the flow should identify an additional escalation level and continue upward. This requires maintaining a clear escalation path in a configuration table or SharePoint list, but it is the only way to ensure approvals don’t stall when a single person is unavailable.

Every approval flow should also log its state transitions to a tracking table. Each time an approval is requested, assigned, escalated, responded to, or timed out, write a record to a SharePoint list or a database table that includes the approval ID, the approver name, the action taken, the timestamp, and the outcome. This log is what makes it possible to audit the flow later, identify patterns of missed approvals, and debug failures when they occur. Without logging, you’re flying blind.

Error Handling and Retry Logic

Approval flows should not fail silently. Every step that might fail, particularly the send approval action itself, should have an error handler configured. If the approval action fails, the flow should retry once or twice before escalating. Use the retry policy built into cloud flows to automatically retry transient failures without adding extra steps.

The response handling section is where most approval flows fail operationally. The flow waits for a response, the response arrives, and then the flow tries to parse it or use it in a downstream action. If the response object is malformed or the downstream action fails, the approval is left in an inconsistent state. Configure error handling around the response processing step, and if it fails, log the failure, notify an administrator, and set the approval to a manual-review state so it can be handled by a human.

Avoiding the Common Pitfalls

Many approval flows make the mistake of embedding the approval timeout in a scheduled flow instead of setting it on the approval action itself. This doubles the complexity and introduces a race condition where the approval might respond after the timeout is checked but before the scheduled flow resolves it. Set the timeout on the approval action, not as a separate scheduled check.

Another pitfall is using the approval owner’s email address to send escalations. Escalations should be routed through the actual escalation workflow, not as emails copied to a backup. If the email approach is used, the escalation has no status tracking and no way to know whether the backup actually saw it.

A third pitfall is assuming that because an approval was sent, it was received. Always add a receipt confirmation step after sending the approval, using a follow-up flow or a scheduled check that verifies the approver’s status. Some organizations send a brief Teams message or Slack notification alongside the approval to ensure the approver knows to check their Outlook task.

Monitoring and Iteration

Once an approval loop is deployed, the real work begins. Run reports monthly on approval cycle times, timeout rates, escalations, and manual overrides. If escalations are happening more than 5% of the time, the timeout is too aggressive or the approval routing is misaligned. If timeouts rarely occur, you may be able to shorten the window to speed up the overall flow.

Track approvers who consistently miss deadlines and consider reassigning their responsibilities. Some approval routing that looks good on paper breaks down in practice because a particular approver is overloaded or rarely checks their tasks.

Approval loops are a reliable part of any organization’s workflow infrastructure when they are designed with production reality in mind. But that reality is messier than most documentation acknowledges. The difference between a working approval flow and one that silently breaks down is attention to timeouts, escalations, and monitoring from the start.

About Routeget Technologies: Routeget specializes in enterprise transformation across the Microsoft cloud ecosystem, including Power Automate automation and workflow optimization. Organizations looking to build production-ready approval systems that scale reliably can engage our consulting team to design governance frameworks, implement monitoring patterns, and optimize approval workflows for their specific operational needs.


#PowerAutomateApprovals #ApprovalWorkflows #EnterpriseAutomation #PowerAutomate #WorkflowOptimization #DynamicsIntegration

Dynamics 365’s Free Sentiment Analysis Has a Blind Spot. AI Builder Sentiment Analysis Can Close It, at a Cost.

Customer experience team reviewing a sentiment analytics dashboard on a large monitor

A customer experience director at a mid-market distributor recently asked her Dynamics 365 partner for something that sounded simple: one ranked list of accounts trending toward churn, built from every piece of customer feedback the company already collects. Support conversation transcripts, service case notes, post-delivery satisfaction surveys, and the freeform comments account managers leave on Opportunity records all already exist somewhere in her Dataverse environment. She assumed the sentiment analysis her team had seen in Customer Service demos would simply read all of it. It doesn’t. Dynamics 365’s built-in sentiment analysis is real, it works well, and it costs nothing extra to use, but it only sees what happens inside a case or an email thread. Everything else on her list, the surveys, the account notes, the reseller complaints logged in a spreadsheet, sits entirely outside its reach. Closing that gap means turning to AI Builder sentiment analysis, a separate tool, and that is a deliberate build, not a setting an admin flips on.

That distinction gets lost in a lot of planning conversations, because “Dynamics 365 has AI-powered sentiment analysis” sounds like one complete capability. It is actually two separate tools, the sentiment monitoring built into Customer Service and the standalone AI Builder sentiment analysis model, with different reach, different cost structures, and different governance obligations. Confusing the two is how a CX program either overpromises what a pilot will cover or underuses a tool that is already paid for.

What Dynamics 365 Already Gives You, Free

Native sentiment analysis in Customer Service is enabled by default and configured through the admin center’s Insights settings, where a supervisor can turn on real-time monitoring in a few clicks. Once it’s on, service representatives see a live sentiment reading during an active omnichannel conversation, with configurable alert thresholds ranging from “slightly negative” up to “very negative,” and supervisors get their own notification settings so they can step in on a conversation that’s deteriorating before it becomes an escalation. Historical scoring rolls up into Omnichannel Insights dashboards for after-the-fact analysis, and the feature covers more than forty languages out of the box. As of a May 2026 release, Microsoft extended the same underlying capability to email: incoming customer messages now get scored for tone before a representative drafts a reply, and that email-level sentiment rolls into a unified case sentiment score alongside conversation data. None of this requires AI Builder, a Power Automate flow, or a separate licensing conversation. It is part of the platform a Customer Service organization is already paying for.

Where the Built-In Tool Stops Seeing Customers

The scope of that native feature is narrower than most stakeholders assume. It is wired specifically to the Case, Conversation, and Email Message records inside Customer Service, and nothing that lives outside that data model gets touched by it. A satisfaction survey captured through a Power Pages portal or a Customer Voice form sits in its own tables. Freeform notes an account manager keeps on an Opportunity or Account record are just text fields, invisible to a sentiment engine that only looks at cases. A complaint a reseller emails to a partner manager, rather than filing through a support channel, never becomes a case at all. Social commentary or review-site feedback pulled in through a connector has no case or email record to attach a score to. In the distributor’s situation, most of the feedback her CX team actually cared about lived in exactly these gaps, which is why the demo she’d seen didn’t match the reality of her own data.

Solution architect building an automated sentiment scoring flow on a laptop

What AI Builder Sentiment Analysis Adds That the Native Tool Doesn’t

This is the actual role for AI Builder sentiment analysis, and it is worth being precise about what kind of tool it is. It’s a standalone prebuilt model, not a Customer Service feature, callable from a Power Automate flow or through a Power Fx formula in a canvas app, and it has no built-in awareness of cases or email at all. It accepts up to 5,120 characters of text per call and returns a document-level classification of positive, negative, neutral, or mixed sentiment, along with a confidence score and, if needed, a sentence-by-sentence breakdown. It supports a solid set of languages, including English, Spanish, French, German, Italian, Portuguese, Dutch, Japanese, Korean, Chinese, Hindi, Turkish, and Norwegian. Because it’s just a callable action with no opinion about where its input comes from, a flow can point it at a Customer Voice survey response table, a custom “Account Note” column, a SharePoint list, or an inbox that never turns into a formal case. That flexibility, not any difference in accuracy, is the actual reason to reach for it: it lets an organization build the one unified sentiment signal the CX director wanted, rather than settling for whatever slice of the customer relationship happens to fall inside a Case record.

The Rate Limit and Credit Shift Worth Budgeting For

Two constraints deserve attention before anyone commits a rollout date. The first is technical: the sentiment analysis, language detection, and key phrase extraction prebuilt models share a single throttle of 400 calls per 60 seconds within an environment. That ceiling is comfortable for scoring cases and emails as they trickle in throughout the day, but it gets hit fast the moment someone tries to backfill a year of Opportunity notes or process five thousand quarterly survey responses in one overnight batch. This is usually the first thing that breaks when a “score everything” mandate meets real data volume, and it should shape the flow design from the start, through pacing, delay steps, or triggering only on new and changed records instead of reprocessing history, rather than getting discovered during a failed pilot.

The second constraint is financial, and it connects to a transition already underway across AI Builder. Sentiment analysis is now billed under Microsoft’s “text and generative AI tools (Basic)” capability, and its licensing is migrating from AI Builder credits to Copilot Studio credits, with AI Builder capacity add-ons and any seeded credits in premium licenses reaching end of life on November 1, 2026. Any budget built for a sentiment-expansion project running into next year should be modeled against Copilot Studio credit consumption, not against a credit pool that Microsoft has already scheduled to stop selling.

A Practical Pattern for Extending Coverage

The build itself is not complicated once the source data is identified. A Power Automate flow triggers on new or changed rows in whichever table holds the text, whether that’s a survey response, a custom account-note table, or a Power Pages-submitted complaint form, calls the AI Builder sentiment action, and writes the resulting classification and confidence score back to a column on that record. From there, a condition branch can raise a Dataverse task for the account owner when a result comes back strongly negative above a chosen confidence threshold, and a Power BI report can rank accounts by a rolling sentiment average pulled from every connected source, not just cases. That report is what actually answers the CX director’s original request. The one governance step teams tend to skip is consent: because this reaches customer-identifiable text outside the flow Customer Service already governs for case and email sentiment, legal and IT should extend the same notice-and-consent practice to whatever new source gets added, rather than assuming existing sentiment monitoring approvals already cover it.

What to Confirm Before Committing

Three things are worth verifying before committing. The inventory of where sentiment-bearing text actually lives outside the Case and Email Message tables determines whether this is a two-week Power Automate build or a multi-source integration project, so it belongs at the start, not mid-pilot. Realistic call volume needs to be estimated against that 400-call, 60-second shared limit before a rollout date gets promised to a business sponsor, because a mismatch there turns a promising pilot into an incident in its first week of production use. And finance should weigh whether the Copilot Studio credit model makes sense at the organization’s expected volume compared with calling Azure AI Language directly through a custom connector, since at higher volumes the direct route sometimes costs less and gives more control over batching, even though it takes more setup than the point-and-click AI Builder action.

Dynamics 365’s native sentiment analysis, especially now that it reaches into email as well as live conversations, already covers most of what a typical service organization needs, and it’s worth using as it stands before building anything on top of it. The gap only becomes a problem when an organization wants one sentiment signal spanning every channel a customer actually uses, most of which never turns into a case. AI Builder sentiment analysis is the right tool for that expansion, but it comes with a real throughput ceiling and a licensing model mid-transition, not a checkbox next to a feature Microsoft already includes. Teams at firms like Routeget Technologies that have wired sentiment scoring into Dataverse tables outside the standard Customer Service model tend to start with that inventory step, because it’s usually where the real scope of the project gets decided, before anyone opens Power Automate.


#AIBuilder #DynamicsCustomerService #PowerAutomate #ChurnPrevention #CustomerExperience #EnterpriseAI #Dataverse

Power Automate API Request Limits Are Losing Their Grace Period. Most Dynamics 365 Integrations Aren’t Ready.

IT solutions architect reviewing a Power Automate integration flow dashboard on a large screen in an enterprise operations center

A finance operations lead watching a month-end close dashboard notices something odd: a batch of vendor invoices has been sitting in “waiting” status for eleven minutes. No error message, no failed run in the flow history, just silence. The Power Automate flow pulling records from Dataverse and pushing them into a document management system hasn’t crashed. It has been throttled, and almost nobody on the team knows that’s a distinct condition from a broken flow, let alone what triggers it or how long it lasts.

That gap in understanding is about to matter a lot more. Microsoft has spent the better part of the last two years quietly running Power Automate’s API request limits in what it calls a transition period: real entitlements exist on paper, actual enforcement is loose, and most tenants are running well past their official limits without consequence. That period has a stated end point, tied to when Power Platform Request usage reporting in the admin center reaches general availability, plus roughly six months. Teams that built integration flows assuming today’s permissive behavior is permanent are going to have an uncomfortable conversation with their CIO when enforcement tightens.

What Actually Counts Against Your Limit

The mental model most consultants carry around, that a “request” means one API call your flow makes to an external system, undersells how quickly limits get consumed. Every action in a flow run generates a request, whether it succeeds or fails. An action sitting inside an Apply to Each loop generates one request per item processed, not one request for the loop as a whole. Pagination counts separately too, so a flow that queries a Dataverse table with 50,000 rows and pages through results in batches of 5,000 will burn ten requests just retrieving data it hasn’t done anything with yet.

This is where a lot of Dynamics 365 integration flows get into trouble without anyone noticing during development. A flow built and tested against a sandbox environment with a few hundred sales order records behaves completely differently once it hits production volume. The loop that ran fine at fifty iterations in UAT becomes five thousand iterations against the live sales order table, and each of those iterations might trigger two or three downstream actions: a lookup, a field update, a notification. What looked like a lightweight automation in testing turns into a five-figure daily request count in production.

Developer typing on a laptop with a blurred Power Automate cloud flow diagram visible on a monitor in the background

The Power Automate API Request Limits That Actually Matter

Most teams that have heard of Power Automate throttling think of it as a single ceiling. In practice there are three separate mechanisms stacked on top of each other, and hitting any one of them produces the same frustrating symptom: a flow that stops making forward progress without a clear error.

The first is the 24-hour rolling entitlement, calculated per user for licensed accounts and pooled at the tenant level for application users and service accounts. A user with a standard Power Automate per-user or Dynamics 365 base license carries a 40,000 request allowance in any trailing 24-hour window. That window doesn’t reset at midnight. It slides continuously, so a burst of activity at 9 a.m. today is still being counted against the limit at 9 a.m. tomorrow, and any requests left unused simply expire rather than carrying forward.

The second is a five-minute burst cap of 100,000 requests, which applies independently of how much daily entitlement remains. A flow with a per-flow Process license carrying 250,000 requests per day can still get throttled mid-run if it tries to push too many of those requests through in a short burst, which is exactly what happens when an integration flow processes a large batch without pacing itself.

The third, and the one with the sharpest teeth, is continuous throttling over time. A flow that stays in a throttled state for 14 consecutive days gets turned off automatically. It can be reactivated, but if the underlying request pattern hasn’t changed, it cycles back into the same state. For a scheduled integration that runs nightly, two weeks of silent throttling is enough time for a genuinely broken process to look, from the outside, like nothing more than a slow week.

Architecting Integrations to Survive Enforcement

None of this means Power Automate is a poor choice for high-volume Dynamics 365 integration work. It means the flows need to be built with request budgets in mind from the start rather than retrofitted after a production incident.

Batching is the highest-leverage change available to most teams. Dataverse supports native batch operations that bundle multiple create, update, or delete operations into a single request rather than issuing one request per record. A flow rewritten to batch 100 record updates into a handful of batch calls instead of 100 individual actions can cut its request footprint by well over ninety percent for that segment of the process. This is worth doing even on flows that aren’t currently near any limit, because the same restructuring also improves run time and reduces the blast radius of a partial failure.

Child flows deserve more architectural attention than they usually get. Breaking a single monolithic flow into a parent that orchestrates and several children that each handle a bounded chunk of work makes it possible to apply concurrency control and pacing at a granular level, rather than trying to throttle an entire end-to-end process as one unit. Concurrency control settings on the trigger, often left at their defaults, are one of the more overlooked levers here: capping how many instances of a flow can run in parallel directly controls how fast it can burn through the five-minute burst allowance.

Trigger conditions matter more than most teams treat them. A flow that fires on every Dataverse row update and then checks conditions inside the flow body has already consumed a trigger execution and started accumulating requests before it decides the record doesn’t actually need processing. Moving that filtering logic into the trigger condition itself, evaluated before the flow run even starts, is free request savings that costs nothing to implement.

For flows that are genuinely high-volume by design, such as a real-time integration syncing order status between D365 Finance and Operations and an external logistics platform, the right answer may simply be licensing rather than architecture. A per-flow Process license carries a 250,000 request daily allowance on its own, and multiple Process licenses can be stacked on a single flow inside a solution, each one adding another 250,000 to that flow’s dedicated entitlement. For tenants not ready to change licensing, the Power Platform Request Capacity add-on adds 50,000 requests per 24 hours per pack and can be layered onto existing entitlements as a stopgap.

Get Ahead of the Reporting Gap

The Power Platform admin center’s usage reports are still catching up to the complexity of the limits themselves. Current reporting covers Power Automate API requests reasonably well but doesn’t yet give a clean picture of Dataverse, Copilot Studio, or Power Apps consumption in the same view, which means a team relying solely on the admin center dashboard is working from an incomplete picture of its actual request footprint. Until that reporting matures, the more reliable approach is instrumenting flows directly: logging request counts per run, watching for 429 responses in run history, and treating a spike in run duration as an early warning sign rather than waiting for a flow to get switched off.

Organizations we’ve worked with on Dynamics 365 and Power Platform integration architecture are increasingly building request budgeting into the design review for any flow expected to process more than a few thousand records a day, the same way they’d review a database query plan before it goes to production. That habit is worth adopting now, while the transition period still offers room to fix a poorly architected flow before enforcement makes the fix urgent instead of optional.


#PowerAutomate #APIRequestLimits #DynamicsIntegration #PowerPlatformGovernance #IntegrationArchitecture #EnterpriseAutomation

Power Platform Pipeline Extensibility Changes Where Your ALM Logic Actually Lives

Solution architect reviewing an abstract Power Platform pipeline deployment diagram with an approval gate on an office monitor at dusk

Every Power Platform admin who has rolled out native pipelines has run into the same wall eventually. The tool is genuinely good at the thing it was built for: letting a maker click “Deploy” and move a solution from development to test to production without learning Azure DevOps YAML or touching a service connection. What it has never let you do, until recently, is put anything of your own between that click and the deployment itself. No custom validation before export. No compliance check before the artifact lands in production. No way to route the actual deployment through a service principal instead of the requester’s own credentials. If your organization needed any of that, the answer was to abandon native pipelines and rebuild the whole thing in Azure DevOps or with the community powerplatform-actions GitHub Action, which meant losing the low-friction maker experience that was the point of adopting pipelines in the first place.

Microsoft’s new Power Platform pipeline extensibility closes that gap, and it is worth understanding closely before you turn it on, because the way it is built shapes what kinds of governance logic actually belong there versus what still belongs in your existing CI/CD stack.

What pipeline extensibility actually adds

The mechanism is Dataverse business events. Power Platform pipelines now emit a defined set of events at each stage of a deployment, and a Power Automate cloud flow sitting in the pipelines host environment can subscribe to those events using the ordinary “When an action is performed” trigger from the Dataverse connector, filtered to the Power Platform Pipelines category. There are seven distinct trigger actions you can hook: OnDeploymentRequested, OnApprovalStarted, OnApprovalCompleted, OnPreDeploymentStarted, OnPreDeploymentCompleted, OnDeploymentStarted, and OnDeploymentCompleted. OnDeploymentRequested fires for every deployment regardless of configuration, and it is also the event a pre-export validation flow hooks into. The approval and pre-deployment pairs only fire at all if you have explicitly enabled the corresponding extension on that pipeline stage, so a flow subscribed to OnPreDeploymentStarted simply never triggers on a stage that hasn’t turned that gate on.

Abstract illustration of a deployment pipeline with connected stage nodes and a glowing approval gate checkpoint

Three gated extension points sit on top of those events, and each one solves a different problem rather than being interchangeable flavors of “add a step.”

Pre-export step required

This is the earliest gate. It runs when a maker submits a deployment request, before the solution is even exported from the development environment, and Microsoft explicitly restricts it to the first stage of a pipeline. That restriction matters more than it looks: once a solution is exported, the pipelines host stores the managed and unmanaged artifacts and promotes that exact same artifact version through every downstream stage. You cannot re-validate or re-export at stage two. Whatever checks you want to run against the source solution, whether that is a naming convention audit, a check for unmanaged customizations, or a call out to an internal change-approval system, have to happen here or not at all.

Is delegated deployment

This extension solves a different problem: identity. Without it, a deployment runs under the requesting maker’s own credentials, which means that maker needs write access to the target environment, something plenty of organizations are uncomfortable granting to anyone below an admin for a production environment. With delegated deployment enabled, the actual deployment executes under a service principal instead, provided the pipeline stage owner is configured as an owner of that service principal in Microsoft Entra ID. A maker can request a production deployment, get it approved, and never hold standing access to production at all. For any organization that has been quietly working around this by granting temporary System Administrator roles before a release and revoking them after, this is the fix that was missing.

Pre-deployment step required

This is the last gate, sitting after approval but before the deployment itself actually runs. This is where a final compliance check, a change-freeze lookup, or a notification to a service desk system belongs, since by this point the deployment has already been approved and you are deciding only whether to let it proceed right now.

Wiring a flow to it

The implementation pattern is consistent across all three extension points. You build a cloud flow, in the pipelines host environment specifically, not in the source or target environment, using the Dataverse “When an action is performed” trigger. You can scope the trigger with a condition against the output parameters, most commonly DeploymentPipelineName or DeploymentStageName, so that a single environment does not end up running every organization’s validation logic against every pipeline. Inside the flow you run whatever logic you need, whether that is a call to an external API, an approval step, or a lookup against a governance table, and then you close the loop with an unbound Dataverse action: UpdatePreExportStepStatus or UpdatePreDeploymentStepStatus, setting the status to 20 for complete or 30 for rejected. A rejected status fails the deployment outright rather than leaving it hanging. Microsoft ships two sample managed solutions, Pipelines Extensibility Samples and Delegated Deployment Samples, that are worth installing into a sandbox before writing anything from scratch, since they cover the trigger and action wiring in a working state rather than leaving you to reverse-engineer the output parameter names from documentation alone.

Where this still falls short

None of this replaces a pro-code CI/CD pipeline, and it is not trying to. The GitHub Actions and Azure DevOps paths for Power Platform still own the things extend pipelines does not touch: source-controlled solution unpacking, automated build artifacts, and static analysis through the solution checker as part of a pull request gate rather than a deployment-time check. What extend pipelines is actually good at is inserting governance and identity control into the maker-facing deployment experience without forcing every citizen developer through a developer-grade toolchain. That is a narrower job, and treating it as a replacement for real CI/CD is the most common mistake I would expect teams to make with it.

The rollout itself is also worth flagging before you plan around it. As of this writing, Microsoft describes the extensibility features as being rolled out gradually across regions, and existing pipelines customers may need to update the Power Platform pipelines application through the admin center before any of these extension points even appear as configurable options. If you check a production tenant and do not see pre-export or pre-deployment settings on a pipeline stage, that is very likely a rollout or update-application issue rather than a misconfiguration on your end, and it is worth confirming with a support ticket before spending time debugging a flow that was never going to fire.

A few operational limits are worth building into your rollout plan from day one. Personal pipelines created inside make.powerapps.com cannot be extended at all, so any governance requirement has to be enforced through admin-managed pipelines rather than personal ones if extensibility is part of the plan. Makers retain the ability to cancel a pending deployment request, but only up until the final deployment step actually begins, so a long-running pre-deployment check is not a safe place to also expect cancellation to work cleanly. And because the exported artifact is immutable across all downstream stages, any pre-export validation logic needs to be strict enough to catch problems before that first export, since there is no second chance to reject the same artifact further down the pipeline.

For architects who have been asking Microsoft for a middle ground between no governance hooks at all and abandoning native pipelines for full Azure DevOps, this is that middle ground. At Routeget Technologies, this is the kind of gap our Power Platform ALM engagements have historically had to close with custom Azure DevOps pipelines, so a native option worth building a proof of concept around is a welcome addition. It is worth testing against a sandbox pipeline now, both to get ahead of the regional rollout and to work out which of the three extension points actually maps to a real control gap in your current deployment process, rather than instrumenting all three reflexively the day they become available in your tenant.


#PowerPlatformPipelines #ALMGovernance #DataverseBusinessEvents #DelegatedDeployment #PowerAutomate #EnterpriseAutomation

Power Automate’s Desktop Flow Version Control Reached GA. It Isn’t the Git Workflow You Expected.

Solution architect reviewing a workflow version comparison on a monitor in a modern office

Last quarter, a client’s unattended invoice-processing bot broke in production after a maker “fixed” a selector on a Friday afternoon and republished without telling anyone. There was no way to see what had changed, no way to diff the working version against the broken one, and no way to roll back except by rebuilding the flow from a screenshot someone had taken three weeks earlier. That is not a hypothetical: it is the normal operating condition for most Power Automate desktop flow estates, and it is the exact gap Microsoft’s new desktop flow version control feature was built to close.

Desktop flow version control reached general availability on May 13, 2026, alongside a companion capability, compare flow versions, released the same day. A related feature, test subflows with test suite, followed in June 2026. Together they represent the most significant governance shift Power Automate for desktop has had since unattended runs first shipped, and for solution architects who have spent years explaining to security and change-management teams why their RPA estate has none of the source-control discipline their .NET or Java pipelines take for granted, this is worth understanding in detail, not just filing away as a changelog entry.

What Desktop Flow Version Control Actually Shipped, and What It Isn’t

The instinct when you hear “version control for desktop flows” is to picture Git: branches, merges, pull requests, a commit graph. That is not what Microsoft built, and treating it as a Git replacement will set you up for a bad rollout conversation with your development team. The underlying storage is Dataverse, not a distributed version-control system. Every draft and published version of a desktop flow is stored there in a compressed format, and Microsoft’s documentation is explicit that there is no configurable cap on how many versions accumulate, though versions older than twelve months are automatically purged, with the exception of the latest published version, which is retained indefinitely.

The model itself is linear rather than branching. A maker saves incremental changes as a draft, which has no effect on whatever is currently running in production. When the maker is satisfied, they publish, which creates an official version available for execution from the console or from a triggering cloud flow. Publish is deliberately disabled until the flow contains at least one enabled action, a small guardrail against accidentally shipping an empty shell. Every prior published version remains accessible as a read-only, previously-published entry, and a maker can restore any of those older versions, which pulls it back in as the current draft rather than silently reinstating it as production. That distinction matters operationally: restoring a version is a deliberate, two-step act, not a one-click rollback that could be triggered by accident.

There is no merge conflict resolution because there is no merging. If two makers edit the same flow concurrently, Microsoft’s guidance is essentially to coordinate manually and avoid overlapping edits, which is a meaningfully different discipline than what a development team accustomed to feature branches will expect. If your organization runs a centralized Center of Excellence model where a small number of makers own each flow, this limitation is mostly academic. If you have distributed ownership across multiple business units touching shared subflows, it is a real constraint you need to design around before you tell anyone this “solves” your governance problem.

Compare Flow Versions: What the Diff Actually Shows

The comparison tool is where this feature starts to feel like genuine engineering tooling rather than a glorified undo button. Selecting any two saved versions opens a read-only comparison view, with the designer locked from editing while the comparison window is open, and the most recent version by timestamp used as the reference baseline. The right-hand pane acts as a change filter: clicking an entry highlights the corresponding element directly in the flow canvas, so you are not scrolling through the whole flow trying to spot what moved.

The scope of what gets diffed is broader than a simple action-by-action list. It surfaces added, removed, and renamed subflows; changes to action configuration and parameters; variable type, name, and value changes; updates to UI element selectors, which is precisely the category of change that silently breaks unattended runs most often; and additions or removals of image assets used for image-based automation. For a team that has ever spent an afternoon trying to figure out why a previously stable flow started failing, having selector changes surface explicitly in a diff view is arguably the single most practically useful part of this release, more so than version control’s headline framing suggests.

Abstract illustration of workflow nodes with a version comparison branch and a passed test checkmark

Subflow-Level Testing Closes a Real Gap

Before this release, testing a Power Automate desktop flow meant running the entire parent flow end to end, because there was no supported way to validate a subflow’s logic in isolation. That forced teams into a familiar bad pattern: either skip meaningful pre-deployment testing because a full run is slow and environment-dependent, or build brittle manual test scripts outside the platform entirely. Test subflows with test suite, which reached general availability in June 2026, extends the existing desktop-flow test framework down to the subflow level, using the same behavior-driven-development structure, defined inputs, expected outputs, and assertions, that the parent-flow test suite already used.

This is not glamorous, but it is the piece that actually makes version control operationally useful rather than just a historical record. A version history without a way to verify that a candidate version behaves correctly before you publish it is an audit trail, not a quality gate. With subflow-level tests, a maker can validate the specific piece of logic they changed, independent of the surrounding flow, and get a pass or fail result recorded in the console and designer before that version ever reaches an unattended runtime. Combined with the comparison tool, you now have a workflow that resembles, even if it doesn’t literally replicate, a real pre-merge review: see exactly what changed, run a targeted test against the changed logic, then publish deliberately.

The Caveats That Change Your Rollout Plan

A handful of details in Microsoft’s documentation will change how you deploy this, and skipping them is how a promising governance feature turns into a support ticket. Self-healing, the capability that lets a desktop flow automatically repair a broken UI selector at runtime, is disabled whenever a flow is running from a saved draft rather than a published version. If your team gets in the habit of testing directly against drafts in a production-adjacent environment, understand that you have also quietly turned off a reliability feature you may be depending on elsewhere.

Enabling the feature requires the prvReadcomponentchangesetpayload privilege, which is included by default for the Environment Maker role but must be added explicitly to any custom security role your organization uses for minimum-permission configurations, a step that is easy to miss if your RPA governance model already deviates from Microsoft’s defaults. Import conflicts are another real-world snag: importing a published flow into an environment that already has an unpublished draft throws an error about an unmodified active context with an existing unpublished row, and the fix is to delete the pending draft before the import runs, which has implications for how you structure ALM pipelines that move flows between dev, test, and production environments. Finally, once version control is turned on for an environment, it cannot be turned off, which argues for enabling it first in a genuinely lower, disposable sandbox rather than directly in whatever environment your team currently treats as “dev.”

What This Means for How You Structure RPA Delivery

None of this makes desktop flow governance equivalent to modern application development practice, and it shouldn’t be sold to a client or an internal stakeholder that way. But it does close the two gaps that have made RPA estates genuinely hard to govern at scale: an unauditable history of what changed and when, and no supported way to test a piece of logic before it reaches an unattended machine. Teams that adopt both capabilities together, disciplined draft-and-publish habits paired with subflow tests run before every publish, will get a meaningfully more defensible answer the next time an auditor or a CISO asks how changes to an automation that touches financial or customer data actually get reviewed. Teams that enable version control and stop there, treating it as a rollback insurance policy rather than a discipline, will find it useful during an incident and largely irrelevant the rest of the time.

Routeget Technologies has been building governance frameworks around Power Automate and Power Platform estates for clients moving from pilot-stage RPA into production-scale automation, and the pattern above, comparison-driven review paired with subflow testing before publish, is close to what we now recommend as a baseline practice rather than an aspirational one. The tooling finally supports it; the discipline still has to be built deliberately.


#PowerAutomate #DesktopFlows #RPAGovernance #ALM #ProcessAutomation #EnterpriseAutomation

Power Automate Error Handling: Why Your Approval Flows Fail Silently

IT professional reviewing a Power Automate approval workflow dashboard on a monitor in a modern office

A finance manager submits a purchase requisition through a Power Automate approval flow on a Friday afternoon. The flow’s run history shows a clean green checkmark. Nobody gets an error notification. Nobody gets paged. And nobody notices that the requisition is still sitting in “Waiting for approval” three weeks later, because the connection that created the flow belonged to an employee who left the company the same week the flow ran. The flow didn’t crash. It just stopped being able to reach the approver, and the default configuration had no mechanism to tell anyone that had happened. This is the gap that Power Automate error handling, done properly, is supposed to close, and it’s a gap that most approval flows in production today were never built to cover.

This is the failure mode that makes approval flows uniquely dangerous among Power Automate use cases. A malformed SharePoint update or a broken HTTP call to an external API tends to fail loudly and immediately, inside a run that someone is watching because they just triggered it. An approval flow fails quietly, often days or weeks after it started, to an audience that has already moved on to something else. Power Automate error handling for approval-heavy processes has to account for that gap between when something breaks and when a human would otherwise notice, and the out-of-the-box behavior of a cloud flow does very little to close it.

What Actually Breaks an Approval Flow

Before building an error-handling pattern, it helps to know what you’re actually defending against, because the failure modes for approvals are more specific than generic connector errors. Microsoft’s own troubleshooting documentation for flow approvals names two conditions directly tied to the connection that created the approval: ApprovalConnectionOwnerNotFoundInGraph, which fires when the account that owns the Approvals connection has been deleted from Microsoft Entra ID, and ApprovalConnectionOwnerNotEnabledInGraph, which fires when that account still exists but has been disabled. Both are common consequences of ordinary offboarding, and both will stop an approval flow cold with no warning to the requester or the intended approver.

A second cluster of failures involves timing. ActionTimedOut occurs when a “Wait for an approval” action’s configured timeout expires before a decision is made, and OperationTimedOut shows up on longer-running processes that exceed the platform’s maximum flow run duration of thirty days. Left at their defaults, many approval actions simply run until someone acts on them or the flow hits that ceiling, which means a request can sit unresolved for weeks without the flow itself ever reporting an error, because from the platform’s perspective nothing has technically gone wrong yet.

A third category sits at the connection layer more broadly: InvalidConnection and ConnectionAuthorizationFailed errors, which surface when a password reset, an expired OAuth token, or a Conditional Access policy change invalidates the credentials a flow depends on. Microsoft’s guidance on broken connections is blunt about the underlying cause, noting that connections tied to individual user accounts break whenever that account’s password changes or the account is disabled, which makes personal connections a structurally poor choice for anything running unattended in production.

Why Power Automate Error Handling Doesn’t Happen by Default

The reason none of this shows up as a visible incident is that Power Automate’s default run-after configuration only wires one path: continue if the previous action succeeded. There’s no branch for failure unless you explicitly add one, and there’s no notification unless you explicitly build it. A flow that fails at the approval step simply shows a red icon in a run history that, realistically, nobody is checking unless they already suspect something is wrong. For a process with dozens or hundreds of concurrent approval instances across an organization, that’s not a monitoring gap. It’s the absence of monitoring entirely.

This is precisely the situation Microsoft’s own coding guidance addresses through Run After configuration, and it’s worth treating as the non-negotiable baseline for any approval flow that matters to the business, not an optional hardening step reserved for critical systems.

Abstract illustration of a broken chain link being reconnected by gears, representing Power Automate error handling and recovery

Building the Scope-Based Try, Catch, Finally Pattern

The standard architecture for this, and the one Microsoft’s guidance points toward, wraps the core approval logic in three scopes. The first, a “Try” scope, contains the actual approval request, the wait, and whatever downstream actions execute once a decision comes back. The second, a “Catch” scope, is configured through Run After to execute when the Try scope has failed, has timed out, or was skipped, which are the three states that indicate something went wrong rather than simply concluded. Inside the Catch scope, the result() expression combined with a Filter Array action pulls the specific error code and message out of the failed action, which is what lets a notification say “the approval connection owner was removed from Entra ID” instead of a generic “something failed.”

A third scope, often labeled “Finally,” is configured to run after the Catch scope regardless of outcome, meaning after it has succeeded, failed, timed out, or been skipped. This is where cleanup and status logging belong, because it executes whether the Try scope worked cleanly or not, which keeps your audit trail complete instead of only recording the failure path.

For notification and logging, Microsoft’s guidance is explicit that Application Insights should be the default target rather than writing to a SharePoint list or a Dataverse table with a dedicated logging flow, both because it avoids the performance cost of excessive custom logging and because it consolidates monitoring across many flows into one queryable location instead of scattering it flow by flow. The workflow() function is useful here too, since it returns the run’s ID and environment metadata, which you can use to build a direct link to the failed run and drop it straight into a Teams message or an email to whoever owns the process.

Hardening the Approval Action Itself

Beyond the general try/catch pattern, approval actions specifically benefit from three adjustments that are easy to skip during initial flow design. First, set an explicit timeout on the “Wait for an approval” action rather than leaving it at the default, and pair that timeout with a Run After branch that fires on “has timed out.” That branch should escalate, typically to a backup approver, a manager one level up, or a distribution list, rather than simply notifying that the deadline passed and leaving the request unresolved. Second, configure retry policies on the connector actions surrounding the approval, using an exponential backoff pattern (an initial interval that doubles or triples with each attempt, up to a defined cap) so that transient throttling from Microsoft Graph or Dataverse doesn’t get treated the same as a permanent failure.

Third, and most important given how often it’s the actual root cause, move production approval flows off personal connections entirely. A connection reference paired with a service principal, rather than a connection tied to whoever happened to build the flow, means the flow keeps running when that person changes teams, resets a password, or leaves the company, which directly eliminates the ApprovalConnectionOwnerNotFoundInGraph and ApprovalConnectionOwnerNotEnabledInGraph failure modes described earlier. This is also an offboarding process question as much as a technical one: whoever manages user departures needs to know which production flows depend on that person’s connections before the account gets disabled, not after an approval silently stalls.

Testing Failure Paths on Purpose

None of this is verified until you’ve actually watched it fail. Before a flow goes into production, it’s worth deliberately breaking it: disable a test account that owns a connection and confirm the Catch scope actually catches it, set an artificially short approval timeout and confirm the escalation branch fires, and revoke a connection mid-run to see whether the resulting error surfaces somewhere a person will actually see it. Teams tend to build the happy path carefully and assume the failure path will behave the same way, which is rarely true the first time it’s tested. A flow checker pass and a clean test run through the approval itself tell you almost nothing about how the flow behaves once something upstream goes wrong, and that’s exactly the scenario a production approval process will eventually face.

The Takeaway

Approval flows fail differently than most other automation, because the cost of an undetected failure compounds silently while everyone assumes the process is working. The fix isn’t exotic: Run After branching, a Try/Catch/Finally scope structure, retry policies with backoff, connection references instead of personal accounts, and centralized logging through Application Insights. What it requires is treating error handling as part of the initial build rather than a patch applied after the first incident. At Routeget Technologies, the approval flows we get called in to fix almost never fail because the underlying logic was wrong. They fail because nobody built a path for the flow to tell anyone it had a problem.


#PowerAutomate #ApprovalWorkflows #FlowErrorHandling #ConnectionOwnership #PowerPlatformGovernance #EnterpriseAutomation

Power Automate’s Object-Centric Process Mining Is GA. Your Bottleneck Data Still Needs a Pipeline First.

A finance operations leader reviewing a process mining dashboard showing connected order, invoice, and payment flows

A finance operations director running Dynamics 365 Finance and Operations recently walked into a budget review with a straightforward automation pitch: build Power Automate flows to shorten the order-to-cash cycle. The CFO’s response was less straightforward. Before funding new flows, she wanted proof of where the cycle actually breaks down, not an assumption based on which team complains loudest. That question, where is the process actually stalling and why, is precisely what Microsoft’s object-centric process mining capability in Power Automate was built to answer. It reached general availability on June 5, 2026, and it changes what a process mining exercise can tell a finance or operations leader. It also comes with a data engineering requirement that most teams have not budgeted for yet.

A finance operations leader reviewing a process mining dashboard showing connected order, invoice, and payment flows

Why Case-Centric Process Mining Kept Missing the Real Bottleneck

Power Automate has offered process mining for several years, and Dynamics 365 Supply Chain Management customers on version 10.0.35 and later already have a purpose-built entry point: a warehouse material movement analysis template that reads closed warehouse work records straight out of Dataverse, no custom configuration required. That capability is genuinely useful, and it works because it treats a process as a single, well-defined case, such as one warehouse work order moving through a fixed sequence of steps.

The limitation shows up the moment a process stops being a clean sequence. An order-to-cash cycle is not one case moving through one lane. A single sales order can spawn multiple shipments, each shipment can be tied to more than one invoice, and a payment can settle across several invoices at once. Traditional case-centric mining forces all of that into one case identifier, which means analysts either duplicate events across cases to preserve accuracy, or they flatten the relationships and lose the very dependency that caused the delay. Microsoft’s own framing of the problem is direct: a shipment held up because an unrelated invoice on the same customer account went unpaid is exactly the kind of cross-object dependency that a single-case view cannot represent cleanly. Object-centric process mining, or OCPM, is built to keep orders, invoices, payments, and shipments as separate but linked object types within one process map, so an analyst can see where those flows intersect and where the actual delay originates.

What Object-Centric Process Mining Changes Once It’s Running

The practical difference for a finance or supply chain leader is that root cause analysis stops requiring a manual reconciliation project. Instead of pulling separate reports for orders, accounts receivable, and logistics and asking an analyst to manually trace where they intersect, OCPM keeps those relationships intact in the underlying data model from the start. Microsoft describes the intended outcome as compressing root cause investigations that used to take weeks down to hours, along with the more familiar benefits of shorter cycle times, lower operational cost, and better resource utilization once the actual constraint is identified rather than guessed at.

For a CFO evaluating where to spend the next automation budget, that matters more than it might first appear. A process improvement initiative built on a flattened, case-centric view risks automating the wrong step: speeding up invoice approval, for instance, when the true constraint is a shipment reconciliation process three steps downstream that only becomes visible once orders, invoices, and shipments are analyzed together. Object-centric process mining is designed to surface that kind of hidden dependency before a Power Automate build begins, which is a materially better position than discovering it after a flow has already been deployed and the expected cycle-time improvement doesn’t show up.

An abstract illustration of connected order, invoice, and payment objects intersecting in a process map

The Data Pipeline Nobody Is Budgeting For

Here is the part that tends to get skipped in the pitch. The Dataverse-native warehouse analysis template mentioned earlier works because case-centric process mining can read Dataverse tables directly. Object-centric process mining, as it stands today, does not offer that same direct connection to Dataverse or to Dynamics 365 tables. It ingests data as a CSV file structured according to Microsoft’s object-centric event log, or OCEL, format, stored in either Azure Data Lake Gen2 or OneLake. Fabric Lakehouses with schema support enabled are explicitly not yet supported as a source, which rules out one path some teams might assume would work.

Building that OCEL file is not a trivial export. The mapping step requires at least one activity attribute, at least one start event attribute, and at least two object type attributes, with optional end event, resource, and additional event or object-level attributes layered on for richer analysis. In practice, that means someone, whether an internal analytics team or an implementation partner, needs to design an extraction and transformation process that pulls order, invoice, payment, and shipment events out of Dynamics 365 and Dataverse, aligns them to a shared activity and object model, and lands the result as a correctly structured CSV before OCPM can analyze anything. That is a real data engineering task, and it is separate from, and in addition to, the Power Automate Premium licensing already required to use process mining at all.

What the Licensing Actually Covers

On the cost side, process and task mining are bundled into the Power Automate Premium per-user license, which includes both capabilities along with a starting capacity pool: each licensed user contributes 50 MB toward a shared tenant-wide limit that caps at 100 GB. Organizations that outgrow that pool can add the Power Automate Process Mining add-on, priced at the tenant level, which adds another 100 GB of process mining capacity along with additional Dataverse database and file storage. Customizing the reporting layer against your own Power BI workspace requires a separate Power BI Premium license. None of that licensing changes because a team chooses object-centric analysis over case-centric analysis, which means the incremental cost of adopting OCPM is almost entirely the data pipeline work, not the software itself.

What’s Coming That Should Factor Into Timing

Two features on Microsoft’s own roadmap are worth factoring into a rollout decision rather than treating OCPM as a finished, static capability. Support for exporting object-centric process mining data to a Microsoft Fabric semantic model is planned for August 2026, which would let this data flow into existing Power BI and Fabric reporting rather than staying siloed inside the process mining tool itself. Normalized schema import support for data ingestion, also targeted for August 2026, is intended to ease some of the current data preparation burden, though it has not been detailed in enough depth yet to know how much of the CSV construction work it actually removes. A broader Process Intelligence Studio experience is set to preview in September 2026 and reach general availability the following month, consolidating process mining, task mining, and related analysis into a single workspace. Teams weighing whether to invest in the manual OCEL pipeline now versus waiting a quarter for these dependencies to mature have a legitimate reason to ask that question before committing engineering time.

Where This Leaves a Decision-Maker Today

None of this argues against object-centric process mining. It argues for treating it as what it is: a genuinely more accurate way to see how a multi-object process like order-to-cash or procure-to-pay actually behaves, paired with a data preparation cost that is easy to underestimate when the feature is pitched as simply “available now.” Before funding an OCPM initiative, it is worth confirming which specific cross-object process is causing the most cost or delay, whether that process’s underlying data already exists in a form close to the OCEL structure or will require meaningful transformation work, and whether waiting for the Fabric export and normalized schema import features changes the math on doing this now versus later this year. Routeget Technologies has walked several Dynamics 365 clients through exactly this kind of data readiness assessment before committing to a process mining build, and the pattern holds consistently: the mining tool itself is rarely the bottleneck. The data getting to it is.


#PowerAutomate #ProcessMining #AutomationROI #OrderToCash #DataverseIntegration #PowerPlatform

Power Automate’s Self-Healing Desktop Flows: What Gets Fixed, and What Still Breaks

IT operations engineer monitoring automated workflow dashboards on multiple monitors

A desktop flow that has run clean for eight months can start failing on a Tuesday morning for reasons that have nothing to do with the flow itself. A vendor portal repaints its login page during a routine update, a button that used to sit at a fixed set of pixel coordinates shifts three rows down, and the automation that finance has relied on for month-end reconciliation throws “Element not found” at 6 a.m. with nobody watching. This is the specific kind of fragility that Power Automate’s newly introduced self-healing desktop flows capability is built to reduce, and it is worth understanding precisely what the feature does before assuming it solves a problem it was never designed to solve.

IT operations engineer monitoring automated workflow dashboards on multiple monitors

Why UI Automation Breaks in the First Place

Desktop flows built around UI and browser automation actions work by capturing a selector, essentially a description of where an element lives inside an application’s structure, and replaying that description at runtime to find the same button, field, or menu again. That approach has always been reliable right up until the moment it isn’t. A web app ships a design refresh. A desktop application renames a control during a patch. A browser update changes how a page renders just enough that the original selector no longer resolves to anything. None of these changes touch the business logic of the flow at all, yet they are historically among the most common reasons a production RPA process stops overnight. They are also the reason RPA teams spend a disproportionate share of their maintenance time on selector repair rather than on building anything new.

What Self-Healing Desktop Flows Actually Do

Self-healing entered public preview on March 31, 2026, as an agentic capability scoped specifically to UI and web automation actions inside Power Automate for desktop, version 2.66 and later. It is not a general reliability feature, and it does not run continuously in the background. It activates only at the moment a specific action throws an Element not found error on the primary or secondary screen, or a Window not found error on the main screen, and only for actions involving a single UI element interaction such as a click or a checkbox selection.

When that failure occurs, the flow’s existing retry policy still runs first. Self-healing sits as a fallback step after retries are exhausted and before whatever error handling rules a maker has configured downstream, things like setting a variable or running a subflow. At that point, the desktop flow captures a screenshot of the missing element’s expected location, the parent window’s title, and a full image of the desktop, then passes that context to two large language models working in combination: GPT-4.1 mini and Claude Sonnet 4.5. The models attempt to identify a UI element that plausibly matches what the original selector was looking for, propose it as a substitute, and let the flow continue. If neither model can produce a confident match, the flow falls through to normal error handling exactly as if self-healing were not enabled at all.

That single design choice, using self-healing purely as a recovery mechanism rather than a permanent correction, matters more than it might first appear. The feature does not rewrite the flow’s stored selector once it recovers. Every future run of that same action will hit the same missing-element error and go through the same self-healing detour again, which means self-healing reduces the visible symptom of a broken selector without eliminating the underlying maintenance debt sitting behind it.

Where the Coverage Actually Stops

Teams evaluating this feature tend to assume it covers more ground than it does, and the gaps are specific enough to matter for planning. Self-healing does not apply to window or screen handling actions, so a flow that fails because an entire application window can’t be located, rather than a single control inside it, gets no help here. It does not extend to multi-element interactions like drag-and-drop, which remain exactly as brittle as before. It has no effect during designer test runs, applying only to console and cloud runs in attended or unattended mode, so a maker debugging inside the desktop flow designer won’t see it engage at all. And because the underlying models work from a screenshot and a window title rather than the application’s actual DOM or object model, self-healing is inherently probabilistic. Microsoft’s own documentation is direct about this: the models can occasionally identify the wrong element, which for a click action on a financial approval screen is not a theoretical risk worth shrugging off.

Close-up of a laptop screen showing a workflow diagram with one error node highlighted

There is also a visibility gap worth planning around before rollout rather than discovering during an incident. The Power Automate portal does not currently surface self-healing activity inside standard action-level run logs. The desktop flow run page shows a rollup of up to three successful self-healing attempts, but anyone who wants a full audit trail has to fall back to a registry setting that writes a repairWithAIInfo property into local log files on the machine running the flow. That is a meaningfully more manual process than most teams are used to for production RPA monitoring, and it is worth building into a rollout checklist rather than assuming the standard portal view will show everything.

Turning It On

Enabling self-healing is not a single toggle, and the chain of prerequisites is easy to get partway through and assume is finished. It starts in the Microsoft 365 admin center, under Copilot settings, where Anthropic has to be enabled as an approved AI subprocessor. This is already the default for most commercial cloud tenants, but it is worth confirming rather than assuming, especially in regulated environments where subprocessor lists get reviewed on a fixed schedule. From there, the same approval has to be granted a second time inside the Power Platform admin center, under Copilot settings, where external models are configured at either the environment or environment group level. A tenant using non-US regions also needs to explicitly allow data to move across regions under that environment’s generative AI features, since the underlying model calls are not necessarily processed in-region otherwise. Only after those three settings are in place does a fourth toggle, Copilot in Power Automate under the same admin settings, need to be switched on before the capability becomes available to makers at all.

At the flow level, the configuration is much simpler by comparison. Inside the desktop flow designer, a maker opens the error handling settings on a supported UI or web automation action and switches on self-healing for that specific action, one action at a time rather than as a flow-wide setting. This granularity is a genuine advantage for a phased rollout. A team can enable self-healing selectively on the handful of actions in a flow that interact with the least stable third-party interfaces, such as a vendor portal outside the organization’s control, while leaving internal, well-governed applications on standard error handling until there is a clearer track record to point to.

Fitting This Into an Error-Handling Strategy, Not Replacing One

The practical risk with a feature like this is not that it fails to work as documented. It is that a maker treats a preview capability with known gaps as a substitute for the selector discipline, monitoring, and testing that RPA has always required, and quietly stops doing that harder work because the flow appears to keep running. The teams getting real value from self-healing so far are treating it as one layer in a broader error-handling stack, sitting below a solid retry policy and above a documented escalation path, rather than as the whole strategy. That means still designing selectors deliberately instead of accepting whatever the recorder captures by default, still monitoring flow run history instead of assuming silence means success, and still budgeting time for the registry-level log review needed to catch a self-healing attempt that quietly picked the wrong element on a screen nobody double-checked afterward.

Used that way, self-healing does what its name suggests for a specific and fairly narrow category of failure: it buys time and reduces the volume of after-hours pages caused by a button that moved six pixels to the left. It does not, and by Microsoft’s own account is not meant to, remove the need for an RPA program that treats maintenance as part of the design rather than an afterthought to it. Routeget Technologies has been walking clients through exactly this kind of phased rollout, piloting self-healing on the least stable external-facing actions in a flow before deciding how far to extend it. That sequencing, more than the feature itself, is usually what determines whether a preview capability like this earns a permanent place in production.


#PowerAutomate #SelfHealingFlows #DesktopFlows #RPAGovernance #PowerPlatform #AutomationReliability