Building Custom API Connectors for Dataverse: Designing Extensible Integration Patterns for Enterprise Scenarios

Custom API connectors in Microsoft Dataverse represent a fundamental shift in how organizations architect integrations at scale. Instead of building point-to-point connectors for each new system, teams can now standardize on Dataverse-native extensibility patterns that simultaneously serve Power Automate, Power Apps, and external applications. This architectural approach reduces maintenance overhead and creates a reusable integration backbone, but only if the connector design itself follows proven patterns around security, throttling, and error handling.

Most teams building their first custom connector make a similar mistake: they treat it as a direct passthrough to a backend API, implementing minimal validation and no circuit-breaking logic. Six months later, when a downstream system experiences degradation or an API contract changes, the connector cascades failures across dozens of dependent workflows. The solution isn’t more testing; it’s designing the connector with resilience baked in.

Understanding the Custom API Connector Model

Dataverse custom API connectors are serverless functions deployed via Azure Functions or Logic Apps that Dataverse registers as callable, authenticated endpoints. Unlike plug-ins that execute within Dataverse’s database transaction scope, custom APIs run outside the database and return results asynchronously, making them ideal for long-running integrations, third-party synchronization, and scenarios where you need to invoke external services without blocking Dataverse transactions.

The connector receives incoming requests from Power Automate cloud flows, canvas apps, or direct REST calls. It validates the input payload, applies any necessary transformations, calls external systems, and returns structured results back to the caller. This separation of concerns matters because it allows you to retry, log, and audit independently of Dataverse operations.

Security and Authentication Patterns

Authentication between Dataverse and your custom API should never rely on connection strings or API keys hardcoded in Power Automate flows or stored unencrypted in Dataverse configuration tables. Instead, use Azure Key Vault to store credentials, and authenticate your custom API using either managed identities (if running on Azure infrastructure) or client credentials with OAuth 2.0.

For incoming callers, restrict custom API invocation to authenticated principals. Dataverse allows you to define API access based on security roles, so only users or service principals with specific roles can trigger the connector. This enforcement happens at the Dataverse level before your code even executes. Verify the caller’s context in your connector function and implement role-based authorization on the specific action being requested: a connector that deletes records should require a different permission level than one that reads data.

When your custom API calls external services, use system-to-system authentication (OAuth 2.0 or client credentials) rather than user-delegated authentication, since the operation is happening on behalf of a data system, not an individual user. Implement automatic token refresh so that token expiration doesn’t silently cause failures hours or days later.

Building for Idempotency and Retry Resilience

External API calls fail. Networks drop. Timeouts occur. The question is not whether your connector will encounter failures, but whether it can recover gracefully. Idempotency is the mechanism that makes retry-safe: if the same request arrives twice, the second invocation produces the same result as the first, not a duplicate operation.

Design your custom API to accept a unique idempotency key from the caller (typically a GUID generated by Power Automate or the calling app). Store this key alongside the operation result in a call log table or external database. When a request arrives, check whether you’ve already processed this idempotency key. If you have, return the cached result. If not, proceed with the operation, and log the key and result before returning.

Implement exponential backoff on retries: if your first call to an external API fails, wait a short interval before retrying, then increase that interval on each subsequent retry. Don’t retry instantly; give the remote service time to recover. Set a maximum retry count so that transient failures don’t cause infinite loops consuming your connector’s quota.

Throttling and Quota Management

Dataverse limits the frequency at which custom APIs can be invoked, and external services often impose their own rate limits. A connector that doesn’t account for these constraints becomes a bottleneck that prevents entire workflows from running. Implement a simple quota tracking mechanism: record each API invocation timestamp and count how many have occurred in the current window (typically per minute or per hour, depending on your service’s SLA). If you’re approaching the limit, return a throttled response and let the caller back off, rather than making the call and receiving a 429 (Too Many Requests) error.

For external service throttling, catch the 429 response, extract the Retry-After header if provided, and schedule a delayed retry. If you’re calling a bulk operation API that accepts large batches, check the API documentation for per-request limits and batch your calls accordingly. A connector that submits a thousand records at once will be throttled; one that chunks the submission into batches of 100 will succeed and complete faster overall.

Error Handling and Observability

Custom API failures should be observable. Log every significant operation: request arrival, authentication success, external API calls, response parsing, and final result. Include context like the caller’s user ID, the operation type, and any relevant IDs (account numbers, transaction IDs). Store logs in Azure Application Insights or similar observability platform so you can query and alert on failure patterns.

Distinguish between retryable errors (network timeouts, 5xx responses from external services, transient database locks) and permanent failures (invalid input, authentication rejection, resource not found). For retryable errors, return a structured response that indicates the operation is incomplete and can be retried. For permanent failures, return an error message that allows the caller to understand what went wrong and take corrective action.

Implement a dead-letter mechanism: if a request fails all retries, log it to a separate queue or table for manual review. Don’t silently drop failed requests; make them visible so you can identify patterns and fix root causes.

Versioning and Backward Compatibility

Dataverse custom APIs evolve. You’ll add new input parameters, change output schemas, or refactor internal logic. A connector that breaks all dependent workflows when you release a new version creates friction. Design your API contract with versioning in mind: accept a version parameter or header, and handle multiple schema versions simultaneously for a transition period.

When changing an input parameter, add the new parameter as optional and default to the old behavior if it’s not provided. When changing output structure, add new fields alongside existing ones; don’t remove or rename fields in existing client code that depends on them. Document these contracts clearly so consumers know which versions are supported and which are deprecated.

Deployment and Testing

Deploy custom connectors via infrastructure-as-code (ARM templates, Terraform, or Azure Bicep) so that connector definitions, function code, and Key Vault policies are version-controlled and reproducible across environments. Test the full integration locally before deploying: mock external API responses, test your retry and timeout logic, and verify that error cases produce sensible output.

Integration tests should include scenarios like external API timeouts, malformed responses, and authentication failures, not just the happy path. Automated testing reduces surprise failures in production and gives you confidence that refactoring doesn’t break the contract.

Why This Matters in Practice

Teams that invest in robust connector architecture report 40-60% fewer integration-related incidents in production. When a downstream system experiences an outage, properly designed connectors degrade gracefully rather than cascading failure across dependent workflows. Idempotency and idempotent retry logic mean that transient network issues self-heal without manual intervention. Observability means you spot problems minutes after they occur, not hours later when someone reports a missing data sync.

Custom API connectors are foundational to a resilient integration strategy. The upfront investment in architecture patterns pays for itself multiple times over through reduced troubleshooting, faster onboarding of new integrations, and lower operational burden.

#CustomAPIConnectors #DataverseIntegration #IntegrationArchitecture #APIDesignPatterns #ExtensibilityProDev #AzureFunctions


Building Resilient Business Central Integrations: API Best Practices, Retry Logic, and Handling Data Inconsistencies During Cloud Migration

Migrating Business Central to the cloud exposes a fundamental truth about integration architecture: the patterns that work for on-premises systems begin to fail the moment you introduce unreliable networks, asynchronous processing, and distributed endpoints. APIs that behaved predictably behind a corporate firewall now encounter timeouts, throttling, transient failures, and the occasional complete outage. Your integration layer, which ran successfully in test environments and pilot rollouts, now shows its weaknesses under production load.

The challenge is not technical complexity alone. It is the gap between what developers know works locally and what actually survives in the cloud. Most Business Central integrations fail not because the API calls are incorrectly structured, but because integrations assume things will always work on the first try. In production, they rarely do.

Understanding the Real Failure Modes

When you move Business Central to the cloud, three failure patterns emerge almost immediately. First, transient failures: temporary network hiccups, momentary API unavailability, or throttling responses that a local system would never encounter. A three-second timeout that is completely fine for testing becomes unacceptable when the network is congested and Dataverse queues are deep. Second, partial failures: an integration processes 1,000 records, succeeds on 987, and encounters an error on record 988. You have data on both sides of a failure boundary, and no clear way to determine what actually synced and what did not. Third, cascading failures: one failing integration causes downstream systems to stop processing, which creates backpressure into Business Central, which causes performance to degrade further, which causes timeouts in yet another system.

These failures are not bugs in your code. They are properties of the cloud environment itself.

Implementing Retry Logic That Actually Works

The first line of defense is intelligent retry logic. Not the naive retry loops that double-size the problem by attempting the same request repeatedly without variation. Retry logic that understands which errors are worth retrying and which mean “give up, something is fundamentally wrong.”

Business Central API responses fall into three categories. Transient errors (HTTP 429, 503, 504, or occasional 500s with a retry-after header) should be retried with exponential backoff. Permanent errors (400, 401, 403, 404 for most resources, or explicit API validation failures) should fail immediately because retrying will not fix a bad request structure or missing resource. Ambiguous errors (some 500s, timeouts, connection resets) require judgment: retry a limited number of times, but not endlessly.

The standard pattern uses exponential backoff with jitter. After the first failure, wait 100 milliseconds before retry one. After the second failure, wait 200 milliseconds before retry two. After the third, wait 400 milliseconds. Add random jitter to prevent the thundering herd problem where all clients retry simultaneously and overwhelm the service. Most integrations should retry between three and five times for transient errors; beyond that, you are waiting longer than it would take to resolve the underlying issue through other means.

Implement retry logic at the API call level, not at the entire integration flow level. A single Business Central record update may require multiple API calls (fetch current version, validate changes, update). Retrying the entire flow risks re-processing successful steps. Retrying individual API calls gives you fine-grained control and better visibility into which step is failing.

Handling Partial Failures and Data Consistency

Transient retries help with temporary glitches, but they do not solve partial failure. If an integration processes 1,000 records from Business Central and sends them to a third-party system, and that process fails after 750 records are written, you now face a data consistency problem. The source and destination are out of sync, and your integration logic cannot restart cleanly because it does not know which records were actually written.

The solution is idempotent API design. Every request to Business Central should be structured so that if you send the exact same request twice, the second request has no effect (or produces the same result as the first request). Use unique external IDs or timestamps as natural idempotency keys. When pushing data from Business Central to a third-party system, tag each request with a correlation ID. If the request fails, retry with the same correlation ID. The third-party system should recognize the correlation ID and return “already processed” instead of creating a duplicate record.

For large batch integrations, implement a reconciliation step. After pushing a batch of records to an external system, fetch back a summary of what was actually written. Compare the summary to your input. If counts match and all IDs are present, mark the batch complete. If there are gaps, identify which specific records failed and retry only those. This approach trades latency for reliability.

Store intermediate state in Business Central itself. Add fields to track integration status: “pending,” “sent to system X,” “acknowledged by system X,” or “failed.” When an integration runs, it reads this status, processes only relevant records, and updates status as each step completes. If the integration crashes halfway through, restarting it picks up where it left off, processes the remaining records, and skips those that already succeeded. This pattern prevents re-processing and provides clear visibility into which records are stuck.

Throttling and Rate Limits

Business Central’s API has rate limits. The exact limits depend on your licensing tier and the specific endpoint, but the principle is universal: push too much traffic at once and the API will refuse new requests until load decreases. Integrations that do not respect rate limits can trigger automatic throttling that affects all users of your instance, not just the offending integration.

Implement a queue-based pattern. Instead of launching hundreds of parallel API calls, use a queue (even a simple in-memory queue if your integration is running in-process) to limit concurrency. Process ten records at a time, wait for all ten to complete (success or permanent failure), then move to the next ten. This approach reduces the peak load on Business Central and makes it easier to handle individual failures without cascading effects.

Monitor actual response times and throttling headers. When you receive a 429 (Too Many Requests) response or a retry-after header, respect it precisely. Do not ignore the guidance and retry immediately; you will only make the throttling worse. Instead, pause for the duration specified in the retry-after header (or use a conservative default such as five seconds), then resume.

Monitoring and Alerting

Integrations fail silently until you add visibility. Implement logging at the API call level. Log the request (sanitized of sensitive data), the response status, the response body (or at least the error message), and the timestamp. When debugging later, these logs will save hours of investigation.

Set up alerting for specific failure patterns. Alert when an integration processes zero records in a given run (sign that the data source is unavailable or the query is broken). Alert when the retry count exceeds a threshold (sign of persistent API issues or misconfigurations). Alert when partial failure rates exceed a tolerance (sign of data quality issues or upstream system problems). Alert when the integration cycle time increases significantly (sign of throttling or degraded performance).

Dashboards should show not just “integration succeeded” but data-level metrics: how many records were attempted, how many succeeded on the first try, how many succeeded after retries, how many failed permanently, and how many remain unprocessed. This granularity helps you distinguish between “the integration ran but made no progress” (upstream data issue) and “the integration ran but encountered failures” (API reliability issue or data validation failure).

Practical Migration Scenario

When migrating Business Central from on-premises to cloud, integrations are the first casualty. Third-party systems that connected to your on-premises instance now connect to the cloud version, often for the first time seeing realistic traffic patterns and reliability expectations. APIs that seemed solid in a test migration (where load and duration are both limited) suddenly show weaknesses.

Start migration by implementing basic retry logic and idempotency even if your on-premises integrations never needed it. Cloud deployments are not forgiving of naive assumptions. Monitor closely during the first week post-migration; this is when cascading failures are most likely to surface. Tune concurrency, retry thresholds, and monitoring based on what you observe.

For large migrations involving millions of records, implement staged batch processing. Process a subset of records (1,000 to 10,000 depending on record size), verify consistency, then move to the next batch. This reduces the blast radius of failure and makes partial recovery far simpler than trying to replay an entire production dataset.

Closing Perspective

Resilient integrations are not built by assuming best-case scenarios. They are built by understanding failure modes, implementing defenses against each one, and monitoring to catch problems before they cascade. Business Central’s cloud platform demands this discipline. Integrations built with this rigor will survive cloud migration, handle production load, and require far less firefighting than those built on the assumption that “it will just work.”

Hashtags: #BusinessCentralIntegration #CloudMigrationStrategy #APIRetryPatterns #DataConsistency #IntegrationArchitecture #ResiliencePatterns

Azure Synapse Link for Dataverse: Real-Time Analytics Architecture and Optimization Patterns

Your analytics pipeline breaks at midnight on the first of every month. A scheduled data sync from Dynamics 365 and Dataverse into your data lake times out after two hours. By the time it completes, your Power BI refresh cycle has already failed. Morning comes, and finance teams still don’t have yesterday’s actuals. You’re running parallel jobs, increasing compute resources, and the cost keeps climbing. Yet latency doesn’t improve. The bottleneck isn’t bandwidth anymore. It’s the batch-oriented ETL model itself.

Azure Synapse Link for Dataverse changes this equation. Rather than extracting data on a fixed schedule, Synapse Link captures changes in real time. It lands them continuously in your Azure Data Lake Gen2 storage. Your analytics pipeline consumes fresh data minutes after it’s entered, not hours later. For organizations running Dynamics 365 Finance and Operations, Business Central, or any Power Platform solution backed by Dataverse, this represents a fundamental shift in how quickly business intelligence responds to operational change.

This guide addresses the architecture patterns, configuration decisions, and optimization strategies that make Synapse Link work reliably in production. When data volumes are large, table schemas change frequently, and analytics must stay current without creating unmanageable infrastructure debt, these patterns separate success from costly rework.

How Synapse Link Works: The Architecture

Synapse Link operates as a continuous export service. When you enable the link for a Dataverse table, Microsoft provisions a lake database (a logical container in your Synapse workspace) and begins writing all rows and changes to that database in delta format. Every create, update, and delete against the source table flows through automatically. There’s no polling, no batch cycles, no missed updates during downtime.

The architecture sits in three layers. The source layer is Dataverse itself, the single system of record. The transport layer is Synapse Link’s background sync service, running in Microsoft’s infrastructure. This service watches for changes and writes them to your data lake. The consumption layer is your Synapse analytics workspace. SQL, Spark, or Power BI queries run against the lake databases created by Synapse Link, consuming data that’s typically fresher than five minutes old.

The critical architectural advantage is that your data lake becomes a near-real-time reflection of Dataverse state. There’s no need for custom connectors, scheduled pipeline dependencies, or manual trigger management. Synapse Link handles the mechanics, so your architecture can focus on analytics, not plumbing. For organizations with tens or hundreds of tables across Finance, Operations, Sales, and Service modules, that simplification is substantial.

Configuration: Enabling Synapse Link Strategically

Not every table needs Synapse Link enabled. Organizations often enable the link for high-priority tables that drive analytics. Examples include general ledger transactions, customer orders, inventory movements, and service cases. Meanwhile, they leave audit tables and transaction logs in traditional export pipelines. This stratified approach balances real-time freshness where it matters with infrastructure cost where it doesn’t.

When enabling Synapse Link, you’ll encounter three key decisions. First, lake database naming. Synapse Link automatically creates a lake database with a naming convention, but you can customize the name to align with your data lake governance. Choose a naming scheme that integrates with existing bronze/silver/gold layer conventions. This helps downstream consumers and builders understand the data’s origin and processing stage.

Second, table filtering. You can export specific columns rather than entire tables. For compliance or performance reasons, excluding sensitive columns, system-generated audit columns, or rarely-used fields reduces storage footprint and simplifies schema. However, be deliberate about this. Once you exclude a column, you’ll need to reconfigure if you later need historical data from before the exclusion date. Document every filter decision so future team members understand why certain fields don’t appear in the lake.

Third, delta table format. Synapse Link writes to delta tables by default, which is the right choice for Synapse analytics. Delta format provides ACID transactions, time-travel capabilities, and unified read/write paths across Spark and SQL. If your organization runs other tools against the data lake, confirm those tools can consume delta format natively or through delta shims. Many can, but older workflows sometimes assume Parquet only.

Schema Evolution: Handling Table Changes

Dataverse table schemas change. A developer adds a new column to capture additional context. Someone renames a field for clarity. A business requirement leads to a new custom attribute. In the immediate aftermath of these changes, your Synapse Link export path will fail if the configuration hasn’t been updated.

The pattern to prevent outages is declarative schema management. When a Dataverse table schema changes, Synapse Link notifies you via Azure Event Grid. Event Grid triggers an Azure Function or Logic App that updates the table configuration in Synapse to include the new column, then resumes the export. This automation means schema changes propagate to analytics within minutes, without manual intervention.

Without this automation, your team discovers the problem when the scheduled Synapse Link export fails. This typically happens hours after the schema change occurred. By then, analytics queries have stalled, dashboards are broken, and you’re in firefighting mode. Build the event-driven schema sync as part of your initial deployment, not as a hotfix months later.

Partitioning and Query Performance

Synapse Link writes data to delta tables partitioned by change date. This partitioning scheme makes time-range queries efficient. Selecting all changes since yesterday will scan only yesterday’s partition, not the entire table. For tables with millions of rows added daily, this partition-pruning cuts query time and cost dramatically.

However, if your analytical queries filter by other columns, the partition structure doesn’t help. Selecting all customers in a region, or all orders for a specific product, requires secondary partitioning strategies. Create Spark jobs that reorganize Synapse Link data into silver-layer tables partitioned by business-relevant columns. Alternatively, use Synapse SQL serverless pools to create external tables with clustering hints.

The pattern is to treat Synapse Link output as a bronze layer. The raw lake data is correct and complete but not optimized for end-user queries. A scheduled Spark or Data Factory pipeline runs against the bronze Synapse Link tables, applies business logic, aggregates, and writes to a silver layer organized by business domain. This silver layer has the partitioning, indexing, and schema structure that makes operational and analytical queries fast.

Cost and Quota Management

Synapse Link pricing depends on the volume of changes exported. A table with millions of static rows but only thousands of daily updates costs far less than a high-churn table with constant inserts and updates. For large Dynamics 365 Finance implementations, tables like GeneralJournalEntry or SalesOrderLine can generate significant export volume.

To manage costs, export only the tables and columns you actually analyze. Use Synapse Link’s built-in filtering to exclude audit columns, system columns, and deprecated fields. Monitor your lake storage growth over the first month and adjust the table set if export volume exceeds budget.

Also monitor Synapse capacity. A Synapse workspace provisioned for light analytics may hit query limit constraints when hundreds of users begin running reports against real-time Synapse Link data. Plan capacity headroom as more teams adopt the analytics platform, especially for organizations moving from monthly batch reporting to daily or real-time dashboards. Real-time analytics consumption patterns differ significantly from batch. Queries run continuously rather than on a schedule, so workspace capacity must account for concurrency, not just peak load.

Implementing Data Quality Safeguards

Real-time data makes bad data move faster. If a calculation error slips into an operational system, Synapse Link exports that error immediately to analytics. Your analytics don’t catch it until someone notices the number is wrong.

Build data quality checks into your silver-layer pipeline. After Synapse Link data lands in the bronze lake, a Spark or Data Factory pipeline validates totals, checks for orphaned records, and confirms business rule compliance before writing to silver. These checks prevent corrupted data from reaching dashboards and reports.

Also implement data lineage tracking. Record which Dataverse records contributed to each analytical result, so if an error is discovered, you can trace it back to the source transaction and correct it. This traceability is essential in regulated industries and for audit trails.

Monitoring and Alerting

Synapse Link runs in the background, so visibility into its operation is easy to miss. Set up alerts for three failure modes. First, if the link falls behind (if the delta between current Dataverse records and exported records exceeds your SLA window), an alert should fire. Second, if a schema change causes an export failure, you want to know immediately, not when a dashboard goes blank. Third, if Synapse workspace query performance degrades, an alert helps you diagnose whether the issue is Synapse Link volume, query design, or workspace sizing.

Azure Monitor and Log Analytics integrate with Synapse Link, so you can query export history, track latency, and set up alerting without custom instrumentation. Invest time early in configuring these dashboards. The investment pays off when you need to troubleshoot issues at 2 AM.

Conclusion

Azure Synapse Link for Dataverse shifts data analytics from a scheduled batch process to a continuously-updated system of record. For Dynamics 365 organizations running complex financial, operational, and sales analytics, this shift unlocks near-real-time decision-making without the infrastructure complexity of custom APIs or scheduled ETL jobs.

The implementation steps are straightforward: enable the link for priority tables, automate schema management through event-driven updates, build a bronze-to-silver pipeline that optimizes for end-user query patterns, monitor cost and workspace capacity, implement data quality validation, and configure alerting for failure scenarios.

The competitive advantage isn’t in the technology itself. Synapse Link is a managed service. The advantage is in architecting analytics to exploit real-time data. Organizations that move quickly from batch reporting to real-time analytics gain information advantage. They see problems before they become crises and opportunities before competitors catch on.

Routeget Technologies has helped dozens of Dynamics 365 Finance and Dataverse implementations deploy real-time analytics strategies that cut financial close cycles by weeks and unlock daily operational visibility where monthly batch reporting once stood in the way. If your organization is building a modern analytics platform, Synapse Link deserves a central place in that architecture.


#SynapseLink #DataverseLakeDatabase #RealTimeAnalytics #AzureDataArchitecture #DataQuality

Building Custom APIs in Business Central: A Developer’s Guide to Extending Integration Capabilities

Developer workspace with multiple monitors showing AL code and API documentation

# Building Custom APIs in Business Central: A Developer’s Guide to Extending Integration Capabilities

Business Central’s Power Automate connector and standard OData endpoints cover a wide range of integration needs. For a mid-market company syncing a handful of cloud services, these out-of-the-box capabilities are often sufficient. But the moment you need to expose Business Central data to a proprietary third-party system, enforce complex business logic at the API boundary, or build a consistent integration layer that multiple services depend on, you’ll quickly discover the limits of connector-based approaches.

Custom API endpoints in Business Central provide a way out. Unlike the Power Automate connector, which exposes a read-only view of standard entities, custom APIs let you control exactly what data flows into and out of your system, apply authorization rules at the endpoint level, and define the exact REST semantics your downstream systems expect.

Developer workspace with multiple monitors showing AL code and API documentation

## When Standard Connectors Stop Working

The Power Automate connector and OData endpoints both serve important purposes, but they operate under constraints that custom APIs remove. The Power Automate connector simplifies workflow automation by automatically discovering Business Central tables and fields, but this convenience comes with limited flexibility around response formats, pagination, and error handling. OData endpoints provide more control but still expose the underlying data model directly, which means any future schema changes can ripple into dependent systems.

A custom API, by contrast, sits between your Business Central data layer and external systems. It acts as a versioned contract that isolates external consumers from internal schema changes. If you add a field to a table, rename a lookup, or refactor your data structure, the API’s public interface remains stable as long as the underlying business logic does.

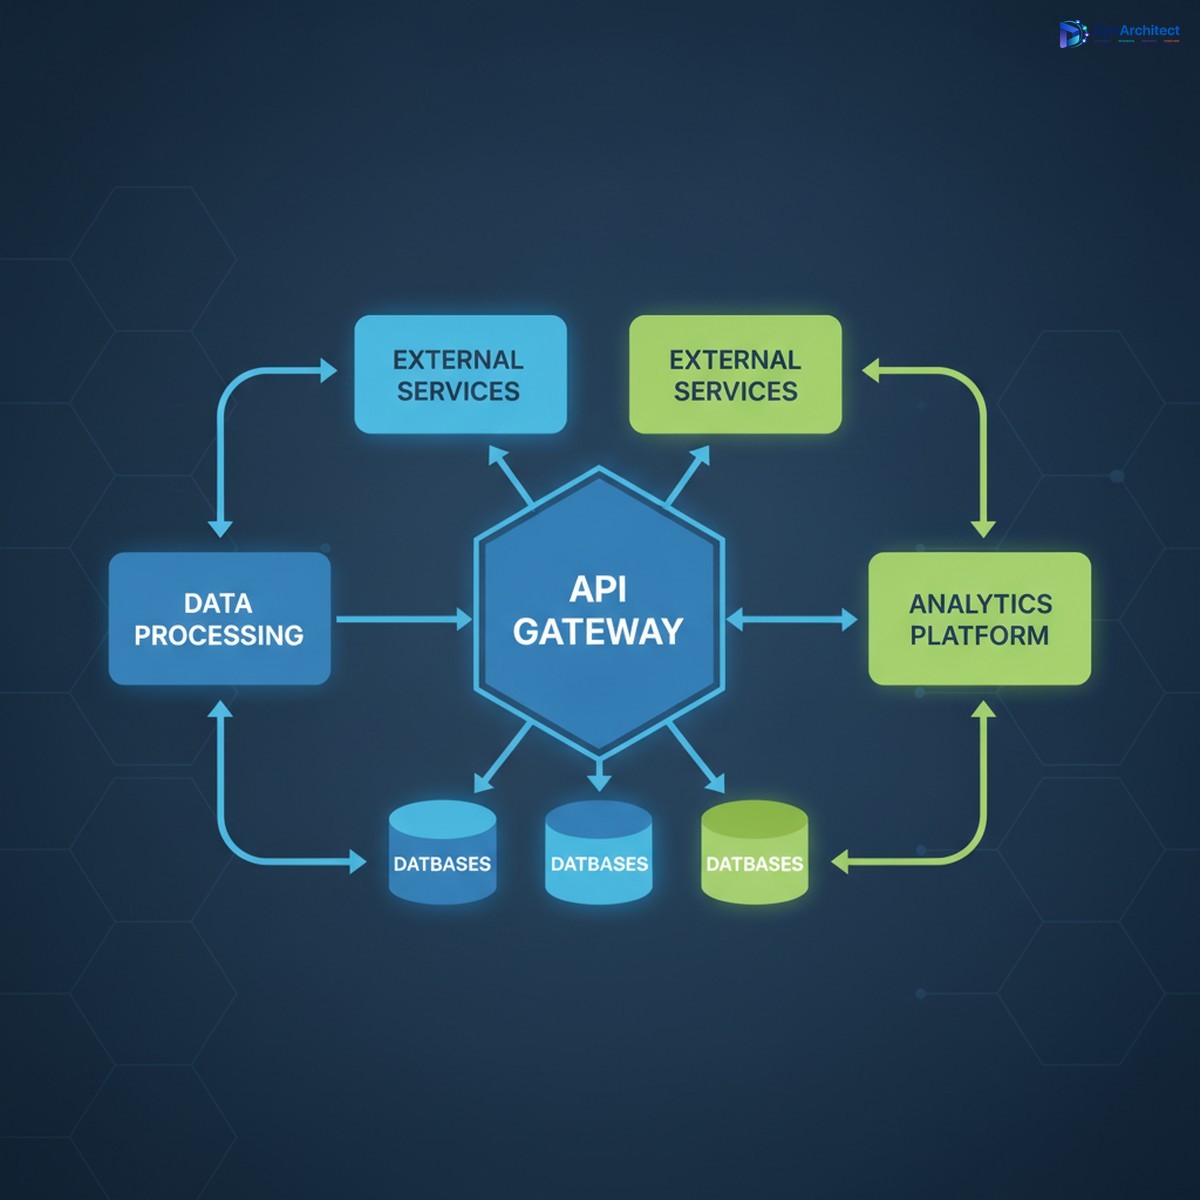
Cloud architecture diagram showing API gateway with multiple integrated systems

## Building Your First Custom API in AL

In Business Central, custom APIs are built using AL, the business application language. The core construct is an API page, which combines the declarative benefits of page design with REST exposure. Here’s the basic pattern:

A custom API page declaration specifies an entity name, which becomes the REST resource path (/api/custom/v1/orders, for example), and then maps AL fields to the underlying Business Central tables. Unlike a traditional page, which is designed for user interaction, an API page focuses on data structure and response shape.

“`
page 50100 OrderAPI
{
PageType = API;
EntityName = ‘Order’;
EntitySetName = ‘Orders’;
…
}
“`

From this declaration, Business Central automatically exposes a REST endpoint. A POST request creates a record, GET retrieves records, PATCH updates, and DELETE removes records, following standard HTTP semantics.

## Controlling the Request Surface

One of the key advantages of building custom APIs is control over the data you expose. You’re not forced to expose every field on a table. Instead, you explicitly declare which fields appear in the API, rename them if needed for compatibility, and define read-only vs. read-write properties.

This becomes essential when integrating with legacy systems or third-party services that expect a specific data structure. If your external partner’s API expects a field called `CustomerOrderID` but Business Central calls it `BillToCustomerNo`, the custom API layer translates between them. This translation insulates both systems from breaking changes on the other side.

Equally important is the ability to hide internal details. Not every field a Business Central user needs to see belongs in an external API. You can expose only order headers, hide internal cost allocations, and require that all modifications go through specific validation routines your custom API enforces.

## Authentication and Authorization at the API Level

All Business Central APIs, custom or standard, authenticate via Azure AD (Entra ID) OAuth. Your calling system requests a token using a service principal or delegated credentials, and Business Central validates the token before allowing access to the API.

However, custom APIs let you layer additional authorization logic on top of Azure AD authentication. You might check that the caller’s organization ID matches the data they’re requesting, or enforce that only a specific external system can modify orders within certain value ranges.

This can be implemented in the page’s trigger code, before any data is returned or modified:

The API code can inspect the authenticated caller’s identity, query Business Central tables to determine if access is allowed, and reject the request with a specific HTTP status and error message if not.

## Versioning Your API Without Breaking Clients

Over time, your API contract will evolve. You’ll add new fields, deprecate old ones, or change the structure of nested objects. Custom APIs handle this through explicit versioning.

The standard approach is to include a version number in the API path itself: `/api/custom/v1/orders` vs. `/api/custom/v2/orders`. This allows you to support legacy clients on the v1 endpoint while new clients use v2. You might even run both endpoints simultaneously, pointing v1 to an older page definition and v2 to an updated one, ensuring that existing integrations don’t break.

Alternatively, you can deprecate individual fields by keeping them in the response but marking them in documentation as no longer updated. This gives calling systems time to migrate to newer fields before you remove them entirely.

## Testing and Monitoring Your Custom API

A custom API is only as good as its reliability in production. Before deploying to a live environment, test the API endpoints thoroughly using tools like Postman or custom scripts that simulate your downstream systems. Verify that create, read, update, and delete operations all work as expected, that error responses include meaningful messages, and that rate limits and timeouts behave predictably.

Once deployed, monitor the API’s health through Business Central’s telemetry and logging infrastructure. Log each API call with caller identity, HTTP status, and execution time, so you can diagnose performance issues or unexpected errors after the fact. If an external system starts making requests at an unusual rate or fails repeatedly, your logs will reveal it quickly.

## A Practical Example: Order Sync Between Business Central and an ERP Partner

Consider a scenario where your organization uses Business Central as the primary system of record for financial data, but integrations with a warehouse management system (WMS) require real-time updates whenever an order ships. A custom Order API exposes the minimum fields the WMS needs: order number, line items, quantities, and ship-to address.

The API page includes trigger code that, on insert or modify, validates that quantities are non-negative, ship-to addresses are complete, and the order type is supported by the WMS integration. If validation fails, the API returns a 400 error with a message explaining what was missing or invalid. This prevents the WMS from receiving half-formed orders that it cannot process.

When the order is ready to ship, the WMS sends a PATCH request to the same endpoint with shipping carrier and tracking information. The custom API updates Business Central with those details, logs the update for audit purposes, and returns a 200 response confirming success.

## Common Pitfalls to Avoid

One frequent mistake is exposing too much data in a single API endpoint. A page that joins ten tables and returns dozens of fields might seem comprehensive, but it becomes slow, difficult to version, and hard to secure. Instead, design lean APIs that return only what the caller needs, and create separate endpoints for different use cases.

Another pitfall is inadequate error handling. If your custom API hits an exception in AL code and doesn’t catch it, the response will be a generic 500 error with a stack trace. External callers have no idea what went wrong. Always wrap business logic in try-catch blocks, translate exceptions into meaningful HTTP status codes (400 for bad requests, 409 for conflicts, 422 for validation failures), and include a human-readable error description.

Finally, don’t overlook throttling. If you don’t set rate limits on your API endpoints, a poorly behaved client or a denial-of-service attack can consume all available Business Central resources. Use Business Central’s built-in throttling policies to cap the number of requests per minute per caller.

## Moving Forward

Custom APIs transform Business Central from a closed system to an extensible platform. They enable you to control the shape of your data, enforce business rules at the boundary, and maintain a stable contract with external systems even as your internal architecture evolves.

If you’re currently wiring integrations together with Power Automate flows and OData endpoints, custom APIs might be the missing piece that gives you the control and clarity your architecture needs. At Routeget Technologies, we’ve helped organizations design and implement custom API strategies that streamline integrations and reduce long-term maintenance burden.

—

**#BusinessCentralAPIs #CustomIntegration #ALDevelopment #BusinessCentralExtensibility #APIDesign #IntegrationArchitecture #DevelopmentPatterns**

#BusinessCentralAPIs #CustomIntegration #ALDevelopment #BusinessCentralExtensibility #APIDesign #IntegrationArchitecture #DevelopmentPatterns

Power Automate API Request Limits Are Losing Their Grace Period. Most Dynamics 365 Integrations Aren’t Ready.

IT solutions architect reviewing a Power Automate integration flow dashboard on a large screen in an enterprise operations center

A finance operations lead watching a month-end close dashboard notices something odd: a batch of vendor invoices has been sitting in “waiting” status for eleven minutes. No error message, no failed run in the flow history, just silence. The Power Automate flow pulling records from Dataverse and pushing them into a document management system hasn’t crashed. It has been throttled, and almost nobody on the team knows that’s a distinct condition from a broken flow, let alone what triggers it or how long it lasts.

That gap in understanding is about to matter a lot more. Microsoft has spent the better part of the last two years quietly running Power Automate’s API request limits in what it calls a transition period: real entitlements exist on paper, actual enforcement is loose, and most tenants are running well past their official limits without consequence. That period has a stated end point, tied to when Power Platform Request usage reporting in the admin center reaches general availability, plus roughly six months. Teams that built integration flows assuming today’s permissive behavior is permanent are going to have an uncomfortable conversation with their CIO when enforcement tightens.

What Actually Counts Against Your Limit

The mental model most consultants carry around, that a “request” means one API call your flow makes to an external system, undersells how quickly limits get consumed. Every action in a flow run generates a request, whether it succeeds or fails. An action sitting inside an Apply to Each loop generates one request per item processed, not one request for the loop as a whole. Pagination counts separately too, so a flow that queries a Dataverse table with 50,000 rows and pages through results in batches of 5,000 will burn ten requests just retrieving data it hasn’t done anything with yet.

This is where a lot of Dynamics 365 integration flows get into trouble without anyone noticing during development. A flow built and tested against a sandbox environment with a few hundred sales order records behaves completely differently once it hits production volume. The loop that ran fine at fifty iterations in UAT becomes five thousand iterations against the live sales order table, and each of those iterations might trigger two or three downstream actions: a lookup, a field update, a notification. What looked like a lightweight automation in testing turns into a five-figure daily request count in production.

Developer typing on a laptop with a blurred Power Automate cloud flow diagram visible on a monitor in the background

The Power Automate API Request Limits That Actually Matter

Most teams that have heard of Power Automate throttling think of it as a single ceiling. In practice there are three separate mechanisms stacked on top of each other, and hitting any one of them produces the same frustrating symptom: a flow that stops making forward progress without a clear error.

The first is the 24-hour rolling entitlement, calculated per user for licensed accounts and pooled at the tenant level for application users and service accounts. A user with a standard Power Automate per-user or Dynamics 365 base license carries a 40,000 request allowance in any trailing 24-hour window. That window doesn’t reset at midnight. It slides continuously, so a burst of activity at 9 a.m. today is still being counted against the limit at 9 a.m. tomorrow, and any requests left unused simply expire rather than carrying forward.

The second is a five-minute burst cap of 100,000 requests, which applies independently of how much daily entitlement remains. A flow with a per-flow Process license carrying 250,000 requests per day can still get throttled mid-run if it tries to push too many of those requests through in a short burst, which is exactly what happens when an integration flow processes a large batch without pacing itself.

The third, and the one with the sharpest teeth, is continuous throttling over time. A flow that stays in a throttled state for 14 consecutive days gets turned off automatically. It can be reactivated, but if the underlying request pattern hasn’t changed, it cycles back into the same state. For a scheduled integration that runs nightly, two weeks of silent throttling is enough time for a genuinely broken process to look, from the outside, like nothing more than a slow week.

Architecting Integrations to Survive Enforcement

None of this means Power Automate is a poor choice for high-volume Dynamics 365 integration work. It means the flows need to be built with request budgets in mind from the start rather than retrofitted after a production incident.

Batching is the highest-leverage change available to most teams. Dataverse supports native batch operations that bundle multiple create, update, or delete operations into a single request rather than issuing one request per record. A flow rewritten to batch 100 record updates into a handful of batch calls instead of 100 individual actions can cut its request footprint by well over ninety percent for that segment of the process. This is worth doing even on flows that aren’t currently near any limit, because the same restructuring also improves run time and reduces the blast radius of a partial failure.

Child flows deserve more architectural attention than they usually get. Breaking a single monolithic flow into a parent that orchestrates and several children that each handle a bounded chunk of work makes it possible to apply concurrency control and pacing at a granular level, rather than trying to throttle an entire end-to-end process as one unit. Concurrency control settings on the trigger, often left at their defaults, are one of the more overlooked levers here: capping how many instances of a flow can run in parallel directly controls how fast it can burn through the five-minute burst allowance.

Trigger conditions matter more than most teams treat them. A flow that fires on every Dataverse row update and then checks conditions inside the flow body has already consumed a trigger execution and started accumulating requests before it decides the record doesn’t actually need processing. Moving that filtering logic into the trigger condition itself, evaluated before the flow run even starts, is free request savings that costs nothing to implement.

For flows that are genuinely high-volume by design, such as a real-time integration syncing order status between D365 Finance and Operations and an external logistics platform, the right answer may simply be licensing rather than architecture. A per-flow Process license carries a 250,000 request daily allowance on its own, and multiple Process licenses can be stacked on a single flow inside a solution, each one adding another 250,000 to that flow’s dedicated entitlement. For tenants not ready to change licensing, the Power Platform Request Capacity add-on adds 50,000 requests per 24 hours per pack and can be layered onto existing entitlements as a stopgap.

Get Ahead of the Reporting Gap

The Power Platform admin center’s usage reports are still catching up to the complexity of the limits themselves. Current reporting covers Power Automate API requests reasonably well but doesn’t yet give a clean picture of Dataverse, Copilot Studio, or Power Apps consumption in the same view, which means a team relying solely on the admin center dashboard is working from an incomplete picture of its actual request footprint. Until that reporting matures, the more reliable approach is instrumenting flows directly: logging request counts per run, watching for 429 responses in run history, and treating a spike in run duration as an early warning sign rather than waiting for a flow to get switched off.

Organizations we’ve worked with on Dynamics 365 and Power Platform integration architecture are increasingly building request budgeting into the design review for any flow expected to process more than a few thousand records a day, the same way they’d review a database query plan before it goes to production. That habit is worth adopting now, while the transition period still offers room to fix a poorly architected flow before enforcement makes the fix urgent instead of optional.


#PowerAutomate #APIRequestLimits #DynamicsIntegration #PowerPlatformGovernance #IntegrationArchitecture #EnterpriseAutomation