Handling Long-Running Operations in Dataverse Plugins: Async Processing Patterns and Monitoring High-Volume Batch Jobs

Long-running operations in enterprise Dataverse environments present a consistent challenge. A synchronous bulk import that takes seven minutes blocks user interactions for seven minutes. A validation rule that queries 50,000 related records across subsidiaries times out and fails silently. A financial posting process that updates 15,000 journal entries locks user access and leaves the system unresponsive. These are not edge cases or theoretical problems; they represent the difference between a predictable, scalable system and one that feels brittle under actual load.

The Dataverse asynchronous (async) processing model exists precisely because these patterns are inevitable in real-world implementations. Understanding how async operations work, when to use them, and how to monitor them is foundational for any developer or architect responsible for high-volume or long-running data operations.

Why Synchronous Processing Fails Under Load

Synchronous operations execute immediately in the calling thread, blocking until completion. For most operations this is fine. A validation plugin that runs in 50 milliseconds does not materially impact the user. But three things happen when operations cross a certain time threshold.

First, the user’s request hangs. A form save takes seven seconds instead of 500 milliseconds. The application appears frozen. Users click buttons again. Connections time out. The business process stalls.

Second, database locks accumulate. Long-running updates hold locks on affected rows. Concurrent operations queue behind those locks. Queries that should take 100 milliseconds now take 10 seconds waiting for locks to release. The performance problem cascades across unrelated processes.

Third, plugin execution context serializes certain operations, creating bottlenecks. The platform enforces timeout limits on synchronous plugin execution (two minutes in most configurations). Exceed that, and the operation fails. If your plugin processes 10,000 records per invocation and crosses the timeout, the entire transaction rolls back. All work is lost, leaving data partially updated.

Asynchronous processing solves this by removing the blocking behavior entirely. Work is queued, executed in the background, and does not block the original request.

How Dataverse Async Operations Work

When an asynchronous plugin or workflow executes, Dataverse follows this sequence. First, the event occurs and synchronous plugins run to completion. Then, the platform serializes the execution context (the data object that the async operation will receive) and creates an AsyncOperation record in the system jobs table. That record enters a queue, ordered by creation date. When background resources become available, the system picks up the AsyncOperation record and executes the async plugin as if it were a synchronous operation running in its own isolated context.

This architecture has important implications. The async operation runs completely independently. It cannot see changes made to the original record after the async job was queued. It cannot throw exceptions that bubble up to the user; the user’s transaction completes successfully regardless of whether the async job eventually fails. If the async job fails, the failure does not cascade to the original data modification. The system records the failure in the AsyncOperation table, but the original record update stands.

The queue is first-in, first-out by default, but the system evaluates resource availability continuously. A job can remain suspended if the system is resource-constrained. High-volume environments often experience queuing, where jobs wait in the ready state until resources open up. Monitoring these queues is essential.

Async Patterns for High-Volume Operations

The dependency token pattern enables serialized async execution when order matters. Two async jobs created with the same DependencyToken value execute serially in creation order rather than in parallel. This is critical for scenarios where later work depends on earlier work completing first. For example, if job A aggregates revenue and job B calculates cost of goods sold based on job A’s output, assigning both the same dependency token ensures B waits for A.

However, dependency tokens apply only to async plugins that the system creates automatically. If your code manually enqueues async work, this mechanism does not apply. In those cases, custom coordination logic is necessary.

For truly high-volume scenarios, consider batching patterns. Instead of creating one async job per record, group records into batches and create one job per batch. A financial posting process might create one async job for every 500 journal entries rather than one job per entry. This reduces queue size, improves efficiency, and simplifies monitoring. The tradeoff is that if a batch fails, all records in that batch require reprocessing.

Monitoring AsyncOperation records is not optional in high-volume environments. Set up automated queries to track job states. Dataverse groups jobs into states: Ready (waiting for resources), Suspended (paused or waiting for dependencies), Locked (currently executing), and Completed (either succeeded, failed, or canceled). A consistently high count of jobs in the Ready or Suspended state signals a bottleneck. It may indicate that the system is resource-constrained, or that a particular job type is failing and retrying repeatedly.

Practical Monitoring Approach

Build queries that segment jobs by type, state, and duration. This query identifies workflow jobs stuck in progress:

GET /api/data/v9.2/asyncoperations?$filter=(operationtype eq 10 and statecode eq 2)&$select=asyncoperationid,name,createdon,startedon,executiontimespan,message&$orderby=createdon desc

Run this daily. Jobs that have been in progress for more than an hour warrant investigation. Long execution times indicate either genuine long-running work (which may be acceptable) or hung jobs that need manual intervention.

Similarly, track failed jobs:

GET /api/data/v9.2/asyncoperations?$filter=(statuscode eq 31)&$select=asyncoperationid,name,createdon,errorcode,message,friendlymessage&$orderby=createdon desc&$top=50

Group failures by error code. A spike in a particular error code indicates a systemic problem. For example, a sudden spike in error code 0x80040213 (record not found) suggests an upstream process is deleting records that dependent async jobs expect to exist.

Error Handling and Retry Logic

Dataverse retries failed async jobs automatically based on the operation type and error. By default, most operations retry up to three times. However, this default is not always optimal. A job that fails due to a transient network timeout may succeed on retry. A job that fails because of invalid business logic will fail on every retry, wasting resources.

Custom plugins can handle this differently. Dataverse serializes the exception information into the AsyncOperation table. Your monitoring logic can examine the error and decide whether to manually trigger a retry or escalate to a support queue. Do not rely on automatic retry for all scenarios; be intentional about which operations should retry and under what conditions.

The FriendlyMessage column provides user-readable error text. Use this for alerting and dashboards. The Message column contains technical detail. Both are valuable in troubleshooting.

Maintenance and Cleanup

Successful async operations remain in the AsyncOperation table indefinitely unless explicitly deleted. High-volume environments can accumulate millions of completed records. This creates three problems: table growth (performance degrades as the table scales), storage consumption, and noise in monitoring queries (finding actual failures becomes harder).

Implement scheduled bulk deletion jobs targeting successful operations older than a retention period. A typical retention policy keeps the last 30 days of successful jobs and deletes older records. Failed jobs are retained longer (90 days is common) so that patterns can be analyzed and root causes understood.

Register async plugins with automatic deletion enabled where the operation is fire-and-forget. This setting tells Dataverse to delete the AsyncOperation record as soon as the job completes successfully. This is safe when you do not need audit trails of the async work, but dangerous if you need to track whether the work occurred.

Conclusion

Long-running operations and high-volume data processing are not fringe use cases in enterprise Dynamics 365 environments; they are normal. Synchronous plugins work fine for most validation and update logic, but the moment you touch more than a few dozen records or engage in complex orchestration, the synchronous model breaks down.

Async operations move these workloads out of the user’s request path, allowing the application to remain responsive and scalable. But async brings complexity: you lose immediate feedback, you must monitor job states, and failures can be silent. The difference between systems that run reliably at scale and systems that collapse under load often comes down to whether developers understand async patterns and build proper monitoring from the start.

Start by identifying your long-running operations. Audit your plugin implementations for anything that touches more than a handful of records or makes multiple external calls. If you find them, plan to move that work async and set up monitoring before the load increases. Waiting until your system is slow is too late.

—

Handling high-volume Dataverse operations is a core competency for enterprise implementations. Routeget Technologies has guided developers and architects through async architecture decisions and implementation patterns on dozens of large-scale Dynamics 365 deployments. Understanding when to move to async, how to monitor effectively, and what patterns prevent cascading failures is what separates systems that scale cleanly from ones that collapse under load.

#DynamicsDataverse #AsyncPlugins #PluginDevelopment #DataverseArchitecture #D365DevOps #EnterpriseIntegration


Azure Synapse Link for Dataverse: Real-Time Analytics Architecture and Optimization Patterns

Your analytics pipeline breaks at midnight on the first of every month. A scheduled data sync from Dynamics 365 and Dataverse into your data lake times out after two hours. By the time it completes, your Power BI refresh cycle has already failed. Morning comes, and finance teams still don’t have yesterday’s actuals. You’re running parallel jobs, increasing compute resources, and the cost keeps climbing. Yet latency doesn’t improve. The bottleneck isn’t bandwidth anymore. It’s the batch-oriented ETL model itself.

Azure Synapse Link for Dataverse changes this equation. Rather than extracting data on a fixed schedule, Synapse Link captures changes in real time. It lands them continuously in your Azure Data Lake Gen2 storage. Your analytics pipeline consumes fresh data minutes after it’s entered, not hours later. For organizations running Dynamics 365 Finance and Operations, Business Central, or any Power Platform solution backed by Dataverse, this represents a fundamental shift in how quickly business intelligence responds to operational change.

This guide addresses the architecture patterns, configuration decisions, and optimization strategies that make Synapse Link work reliably in production. When data volumes are large, table schemas change frequently, and analytics must stay current without creating unmanageable infrastructure debt, these patterns separate success from costly rework.

How Synapse Link Works: The Architecture

Synapse Link operates as a continuous export service. When you enable the link for a Dataverse table, Microsoft provisions a lake database (a logical container in your Synapse workspace) and begins writing all rows and changes to that database in delta format. Every create, update, and delete against the source table flows through automatically. There’s no polling, no batch cycles, no missed updates during downtime.

The architecture sits in three layers. The source layer is Dataverse itself, the single system of record. The transport layer is Synapse Link’s background sync service, running in Microsoft’s infrastructure. This service watches for changes and writes them to your data lake. The consumption layer is your Synapse analytics workspace. SQL, Spark, or Power BI queries run against the lake databases created by Synapse Link, consuming data that’s typically fresher than five minutes old.

The critical architectural advantage is that your data lake becomes a near-real-time reflection of Dataverse state. There’s no need for custom connectors, scheduled pipeline dependencies, or manual trigger management. Synapse Link handles the mechanics, so your architecture can focus on analytics, not plumbing. For organizations with tens or hundreds of tables across Finance, Operations, Sales, and Service modules, that simplification is substantial.

Configuration: Enabling Synapse Link Strategically

Not every table needs Synapse Link enabled. Organizations often enable the link for high-priority tables that drive analytics. Examples include general ledger transactions, customer orders, inventory movements, and service cases. Meanwhile, they leave audit tables and transaction logs in traditional export pipelines. This stratified approach balances real-time freshness where it matters with infrastructure cost where it doesn’t.

When enabling Synapse Link, you’ll encounter three key decisions. First, lake database naming. Synapse Link automatically creates a lake database with a naming convention, but you can customize the name to align with your data lake governance. Choose a naming scheme that integrates with existing bronze/silver/gold layer conventions. This helps downstream consumers and builders understand the data’s origin and processing stage.

Second, table filtering. You can export specific columns rather than entire tables. For compliance or performance reasons, excluding sensitive columns, system-generated audit columns, or rarely-used fields reduces storage footprint and simplifies schema. However, be deliberate about this. Once you exclude a column, you’ll need to reconfigure if you later need historical data from before the exclusion date. Document every filter decision so future team members understand why certain fields don’t appear in the lake.

Third, delta table format. Synapse Link writes to delta tables by default, which is the right choice for Synapse analytics. Delta format provides ACID transactions, time-travel capabilities, and unified read/write paths across Spark and SQL. If your organization runs other tools against the data lake, confirm those tools can consume delta format natively or through delta shims. Many can, but older workflows sometimes assume Parquet only.

Schema Evolution: Handling Table Changes

Dataverse table schemas change. A developer adds a new column to capture additional context. Someone renames a field for clarity. A business requirement leads to a new custom attribute. In the immediate aftermath of these changes, your Synapse Link export path will fail if the configuration hasn’t been updated.

The pattern to prevent outages is declarative schema management. When a Dataverse table schema changes, Synapse Link notifies you via Azure Event Grid. Event Grid triggers an Azure Function or Logic App that updates the table configuration in Synapse to include the new column, then resumes the export. This automation means schema changes propagate to analytics within minutes, without manual intervention.

Without this automation, your team discovers the problem when the scheduled Synapse Link export fails. This typically happens hours after the schema change occurred. By then, analytics queries have stalled, dashboards are broken, and you’re in firefighting mode. Build the event-driven schema sync as part of your initial deployment, not as a hotfix months later.

Partitioning and Query Performance

Synapse Link writes data to delta tables partitioned by change date. This partitioning scheme makes time-range queries efficient. Selecting all changes since yesterday will scan only yesterday’s partition, not the entire table. For tables with millions of rows added daily, this partition-pruning cuts query time and cost dramatically.

However, if your analytical queries filter by other columns, the partition structure doesn’t help. Selecting all customers in a region, or all orders for a specific product, requires secondary partitioning strategies. Create Spark jobs that reorganize Synapse Link data into silver-layer tables partitioned by business-relevant columns. Alternatively, use Synapse SQL serverless pools to create external tables with clustering hints.

The pattern is to treat Synapse Link output as a bronze layer. The raw lake data is correct and complete but not optimized for end-user queries. A scheduled Spark or Data Factory pipeline runs against the bronze Synapse Link tables, applies business logic, aggregates, and writes to a silver layer organized by business domain. This silver layer has the partitioning, indexing, and schema structure that makes operational and analytical queries fast.

Cost and Quota Management

Synapse Link pricing depends on the volume of changes exported. A table with millions of static rows but only thousands of daily updates costs far less than a high-churn table with constant inserts and updates. For large Dynamics 365 Finance implementations, tables like GeneralJournalEntry or SalesOrderLine can generate significant export volume.

To manage costs, export only the tables and columns you actually analyze. Use Synapse Link’s built-in filtering to exclude audit columns, system columns, and deprecated fields. Monitor your lake storage growth over the first month and adjust the table set if export volume exceeds budget.

Also monitor Synapse capacity. A Synapse workspace provisioned for light analytics may hit query limit constraints when hundreds of users begin running reports against real-time Synapse Link data. Plan capacity headroom as more teams adopt the analytics platform, especially for organizations moving from monthly batch reporting to daily or real-time dashboards. Real-time analytics consumption patterns differ significantly from batch. Queries run continuously rather than on a schedule, so workspace capacity must account for concurrency, not just peak load.

Implementing Data Quality Safeguards

Real-time data makes bad data move faster. If a calculation error slips into an operational system, Synapse Link exports that error immediately to analytics. Your analytics don’t catch it until someone notices the number is wrong.

Build data quality checks into your silver-layer pipeline. After Synapse Link data lands in the bronze lake, a Spark or Data Factory pipeline validates totals, checks for orphaned records, and confirms business rule compliance before writing to silver. These checks prevent corrupted data from reaching dashboards and reports.

Also implement data lineage tracking. Record which Dataverse records contributed to each analytical result, so if an error is discovered, you can trace it back to the source transaction and correct it. This traceability is essential in regulated industries and for audit trails.

Monitoring and Alerting

Synapse Link runs in the background, so visibility into its operation is easy to miss. Set up alerts for three failure modes. First, if the link falls behind (if the delta between current Dataverse records and exported records exceeds your SLA window), an alert should fire. Second, if a schema change causes an export failure, you want to know immediately, not when a dashboard goes blank. Third, if Synapse workspace query performance degrades, an alert helps you diagnose whether the issue is Synapse Link volume, query design, or workspace sizing.

Azure Monitor and Log Analytics integrate with Synapse Link, so you can query export history, track latency, and set up alerting without custom instrumentation. Invest time early in configuring these dashboards. The investment pays off when you need to troubleshoot issues at 2 AM.

Conclusion

Azure Synapse Link for Dataverse shifts data analytics from a scheduled batch process to a continuously-updated system of record. For Dynamics 365 organizations running complex financial, operational, and sales analytics, this shift unlocks near-real-time decision-making without the infrastructure complexity of custom APIs or scheduled ETL jobs.

The implementation steps are straightforward: enable the link for priority tables, automate schema management through event-driven updates, build a bronze-to-silver pipeline that optimizes for end-user query patterns, monitor cost and workspace capacity, implement data quality validation, and configure alerting for failure scenarios.

The competitive advantage isn’t in the technology itself. Synapse Link is a managed service. The advantage is in architecting analytics to exploit real-time data. Organizations that move quickly from batch reporting to real-time analytics gain information advantage. They see problems before they become crises and opportunities before competitors catch on.

Routeget Technologies has helped dozens of Dynamics 365 Finance and Dataverse implementations deploy real-time analytics strategies that cut financial close cycles by weeks and unlock daily operational visibility where monthly batch reporting once stood in the way. If your organization is building a modern analytics platform, Synapse Link deserves a central place in that architecture.


#SynapseLink #DataverseLakeDatabase #RealTimeAnalytics #AzureDataArchitecture #DataQuality

Dataverse Environment Strategy: Consolidation Versus Segregation

Dataverse consolidation vs segregation architecture comparison

When you first deploy Dataverse, the storage bill arrives as a small surprise. When you deploy your tenth instance, it arrives as a budget problem. This escalation is not accidental. It reflects a choice you likely did not consciously make: the decision to separate Dataverse environments.

Most organizations start with a single development environment, then add a staging environment for UAT, then a production environment for the main line of business. Six months later, there’s a second production environment for a parallel business unit. A year in, IT has provisioned separate Dataverse instances for finance, operations, customer service, and a pilot project that “just needed a sandbox space.” Each instance accrues storage costs, backup overhead, governance complexity, and security review burden. The organization paid for all of it. Few asked whether they needed to.

The question “Should we consolidate or segregate?” never came up because it felt obvious: production should be separate from development. But that clarity evaporates once you have multiple business units, overlapping data needs, and genuine compliance constraints. Consolidation looks cost-efficient until you calculate the management burden. Segregation looks secure until you realize your core customer data lives in four places and nobody knows which is authoritative.

The answer is neither pure consolidation nor pure segregation. It is strategy.

Understanding the Cost and Governance Tensions

Dataverse pricing ties directly to storage consumption and the number of instances you maintain. A 10 GB storage license costs roughly 100 USD per year. An organization with ten segregated Dataverse environments, even with light usage, pays backup, redundancy, and management overhead across each one. The cloud infrastructure beneath Dataverse (Azure) charges for compute, storage durability, and replication regardless of how full your instance is. A mostly empty Dataverse environment costs nearly as much as a full one.

Segregation creates what appears to be security clarity: production data stays in production, development in development, finance data in finance. This isolation has genuine value. A misconfigured Power Automate flow in a development sandbox cannot accidentally update live customer records. A security breach affecting one environment need not compromise all of them. But segregation imposes a hidden cost: data synchronization, duplicate records, inconsistent customer views, and reconciliation overhead. If customer records live in both a finance Dataverse and an operations Dataverse, which is the source of truth when they conflict? Who owns the resolution process?

Consolidation eliminates that duplication. A single Dataverse instance holding all enterprise data means one source of truth for customer records, one master file for products, one system of record for financial transactions. You skip the synchronization overhead, the reconciliation disputes, and the headache of knowing which Dataverse has the current information. The cost per record drops. But the security model becomes more complex. Consolidation means granting broader data access to more users and applications, requiring tighter role-based access control, field-level security rules, and auditing to prevent accidental or malicious data leakage. A single misconfigured permission model puts more data at risk than a segregated approach would.

Business team reviewing Dataverse environment strategy and cost metrics

When Segregation Makes Economic Sense

Segregation is the right strategy when regulatory compliance or data residency mandates isolation. A healthcare organization subject to HIPAA cannot store patient records alongside non-protected business data in the same system without additional access controls that approach the complexity of separate systems anyway. A financial services firm with customer data subject to SOX or PCI compliance, or an organization operating in multiple countries with GDPR or localization requirements, often finds segregation is mandated by policy rather than chosen for efficiency.

Segregation also makes sense when a subsidiary or business unit operates as a distinct legal entity with its own data ownership and governance. If your organization acquired a company and that company operates with its own finance department, separate Dataverse instances may be required during the integration phase and might remain appropriate long term to respect the subsidiary’s operational autonomy, even if they cost more.

Segregation further proves necessary when the organization lacks the governance maturity to enforce consistent security policies across shared data. If your Power Platform practice is young, permissioning discipline is inconsistent, and no one has ownership over a unified data governance framework, adding data to a consolidated Dataverse risks creating visibility into sensitive information that should remain restricted. In that case, segregation by business unit or application buys time for your governance practice to mature.

When Consolidation Reduces Total Cost of Ownership

Consolidation is strategically sound when you have multiple business units sharing core data, such as customers, products, and suppliers. The finance department’s customer master should be the same record your sales team references. The supply chain’s product master should be the source of truth for the pricing your finance team uses in invoicing. Consolidation eliminates the cost and risk of maintaining parallel records and reconciling discrepancies when they diverge.

Consolidation also makes sense when your organization has established governance discipline and a clear data stewardship model. If you have defined data ownership (finance owns the general ledger, supply chain owns inventory, sales owns opportunities), have role-based security groups mapped to those functional areas, and have audit mechanisms in place to catch permission violations, a consolidated Dataverse becomes a platform strength rather than a security risk. Your cost per record drops, your data consistency improves, and you simplify the user experience by giving people access to the unified information they need rather than requiring them to navigate to separate systems.

Consolidation further makes sense for organizations with mature ALM (application lifecycle management) practices. Consolidated Dataverse allows you to deploy solutions and flows to shared data layers without the release complexity of managing separate instances. Your development, staging, and production environments can all point to logically separated Dataverse spaces within a single instance, reducing provisioning overhead and backup complexity.

Hybrid Models and Environmental Separation Within a Single Instance

Many organizations land on a hybrid approach: one or two consolidated production Dataverse instances for the main business, with a separate development/test environment reserved for experimental solutions and non-production use.

This model recognizes that some segregation is necessary (development must be isolated from production), while consolidation of core business logic and shared data eliminates duplication and cost. Within a single Dataverse production instance, you use solution layers and environment variables to manage configuration differences for different business units or applications, avoiding the need for separate instances.

The Operational Complexity Multiplier

Many organizations underestimate the operational cost of managing multiple Dataverse instances. Each instance requires backup policies, disaster recovery testing, access control reviews, security patching coordination, and licensing reconciliation. Each instance needs monitoring for performance issues. Each introduces a potential point of data quality failure. If you have ten Dataverse environments with inconsistent master data definitions, ten different backup schedules, and ten separate access reviews, you have essentially maintained ten times the governance surface area compared to one consolidated instance.

Recommendations for Decision-Makers

Before you provision another Dataverse instance, ask whether the request stems from genuine compliance isolation or from organizational convenience. If it is convenience, consider whether investing in your governance model (clearer role definitions, field-level security policies, auditing) would be more cost-effective than the ongoing operational overhead of maintaining a separate instance.

If you already have multiple instances, analyze the actual data sharing patterns. Do core business entities (customers, products, suppliers) need to be synchronized across instances? If so, you are paying the cost of segregation while accepting the complexity of consolidation. A strategic consolidation project to merge those shared entities might cost less over three years than the recurring duplication and reconciliation overhead.

Document your environment strategy explicitly. Do not let instances accumulate by default. Routeget Technologies works with organizations to audit their existing Dataverse footprint, quantify the cost-benefit of consolidation versus continued segregation, and design transition plans that respect compliance constraints while reducing total cost of ownership. The difference between a well-planned environment architecture and an ad-hoc collection of instances often runs to hundreds of thousands of dollars annually for larger deployments.

Hashtags: #DataverseArchitecture #EnvironmentStrategy #PowerPlatformGovernance #EnterpriseDataManagement #DataverseCostOptimization #CloudGovernance #MicrosoftDataverse

Dataverse Calculated Columns and Rollups: When Summary Data Becomes a Bottleneck

Most Dynamics 365 implementations contain at least one field that should not exist. It is usually a number that sums values from child records, or a formula that derives from related data. The reason it exists is always the same: someone wanted real-time access to that information from a parent record, without running a report or opening a separate list.

Dataverse calculated columns and rollup columns promise to solve this problem. Calculated columns apply a formula to one or more fields on the current record, showing the result live without code. Rollup columns sum, count, average, or find min/max values from related records, showing that aggregation on the parent record. Both sound straightforward in a demo. Both become serious performance liabilities in production when misapplied.

The problem is not that calculated columns or rollups are poorly designed. The problem is that their flexibility and ease of configuration make it tempting to create them for every question a user asks, and because Dataverse computes these columns synchronously during record operations, each one you add delays every operation touching that record or its related data. At scale, calculated columns and rollups can turn a fast, responsive system into one where simple form loads lag and mass operations hang.

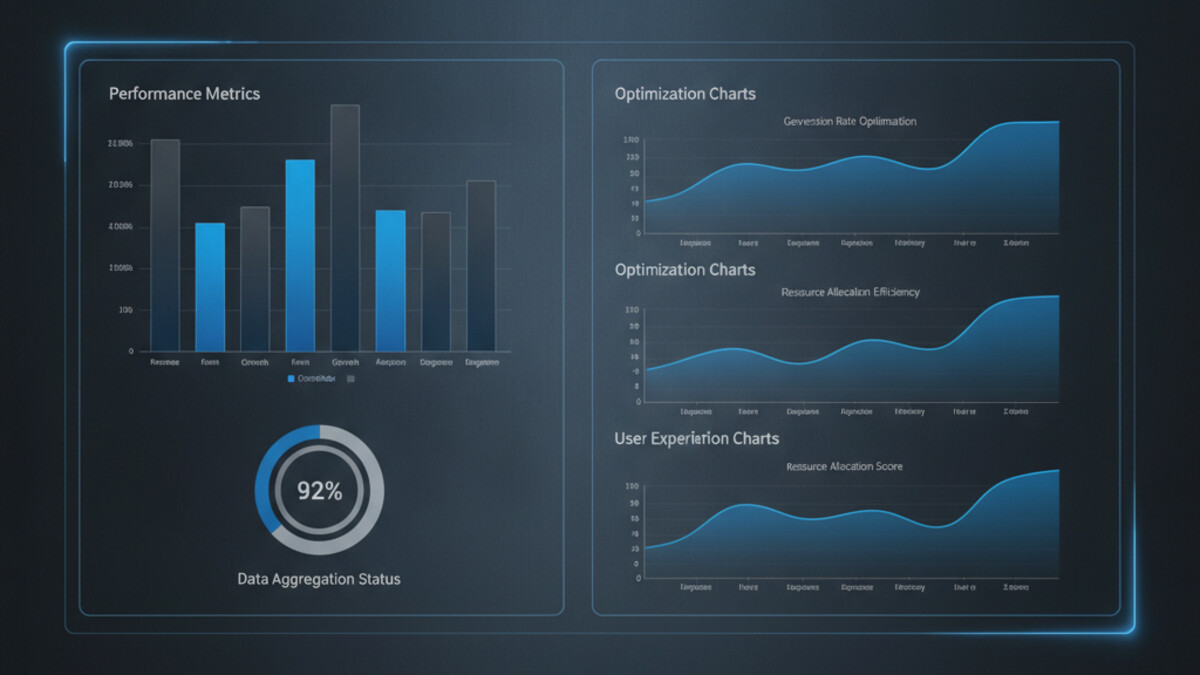
Performance metrics dashboard for database optimization

How Dataverse Calculated Columns and Rollups Actually Work

Calculated columns in Dataverse run when a record is created, updated, or retrieved. Unlike plugin code you can optimize or disable, calculated columns execute on every interaction. If you define a calculated column that divides a budget by a count of child records, that division happens every time anyone loads the form, every time a Power Automate flow retrieves that record, and every time an integration fetches the data via the API.

Rollup columns add another layer of complexity. A rollup does not just read data from related records; it must traverse a relationship, evaluate a condition on each related record, and then compute the aggregation. If you create a rollup that counts all incomplete tasks related to an account, Dataverse must walk through every task record linked to that account, check each one’s status, and return the count. On an account with 50,000 tasks, this query can take seconds.

Both calculated columns and rollups are recomputed on a schedule. Dataverse does not compute them in real-time on demand; instead, the system recalculates them asynchronously in batch jobs. This means that displayed values may not always reflect the absolute latest state of the source data. For a dashboard or a report, this lag is usually acceptable. For a workflow that needs to make a decision based on that value, the delay can cause logic to fail or bypass critical checks.

When Calculated Columns and Rollups Become Problems

Performance issues with calculated columns and rollups typically emerge at one of three trigger points.

First is load time. A form containing multiple calculated columns or rollups can take noticeably longer to render, especially on mobile or slower connections. Users perceive this as a slow or unresponsive system. The impact scales with the number of columns; a form with 2 or 3 calculated fields performs fine, but one with 10 or more can lag visibly.

Second is mass operations. Bulk operations such as Power Automate loops that create or update thousands of records will execute more slowly if those records contain calculated columns or rollups. Each record operation pays the calculation cost, so a loop that would normally complete in 30 seconds might take 3 minutes. Workflows that timeout during scheduled jobs often have calculated columns as a hidden root cause.

Third is query performance. Reports or Power BI dashboards that query many records will hit slowdowns if the records contain expensive calculated columns or rollups. The calculation must complete before the record is returned, so querying 10,000 records with heavyweight calculations forces Dataverse to compute all 10,000 calculations before the query finishes.

A fourth, more subtle issue is the logical inconsistency created by asynchronous recalculation. If a workflow reads a rollup column value, performs business logic based on that value, and then the rollup recalculates a moment later and changes, the workflow has acted on stale data. This can create gaps in audit trails or cause business logic to diverge from the actual state the user sees.

Detecting Bottlenecks

Before optimizing, you need to know if calculated columns or rollups are actually the problem. A few diagnostic approaches work.

Check the Dataverse environment’s performance reports. Look for slow-running queries or forms that take longer than expected. If a form with calculated columns loads in three seconds and the same form without them loads in one second, the columns are adding two seconds of latency. Similarly, check Power Automate run histories for timeouts or slow execution in flows that work with records containing rollups.

Enable Plugin Trace Log (under Settings in your Dynamics environment) and examine traces for records being retrieved with calculated columns. Look at the duration of retrieve operations; if simple record retrievals are taking longer than 500 milliseconds, calculated or rollup columns are a likely culprit.

Query the Dataverse API directly with and without calculated columns in the result set. Use select parameters to request only the columns you need. If adding a calculated column to the query selection significantly increases response time, you have confirmed the issue.

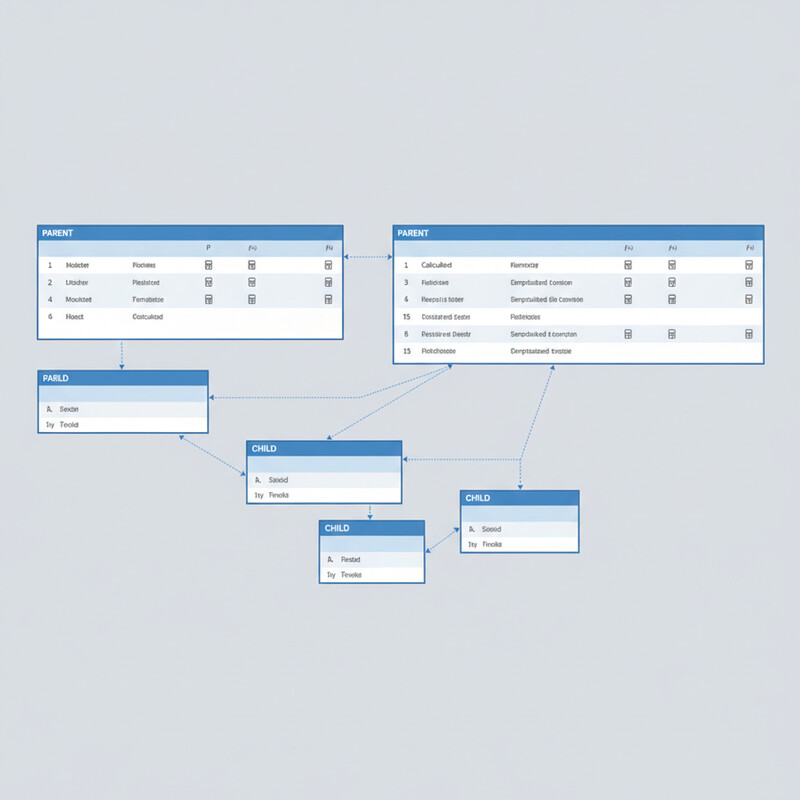
Database schema showing parent-child record relationships and calculation flows

Alternatives to Calculated Columns and Rollups

If you have identified a bottleneck, you have several options. The best choice depends on your specific scenario.

Use plugins or Power Automate to calculate on demand. Instead of computing the value every time a record is retrieved, calculate and store it only when necessary. A plugin triggered on form load can calculate a summary and display it in a banner, showing fresh data without impacting record retrieval. A Power Automate cloud flow can run on a schedule to update rollup values once per hour or once per day, depending on your tolerance for staleness. This approach keeps the permanent record lean.

Move calculations to the reporting layer. Power BI does not care if a column is calculated in Dataverse or computed in the dataset; the result looks the same to an end user. Create a calculated column in a Power BI dataset instead of in Dataverse, and use that column only for dashboards and reports. Forms and integrations get the base data without calculation overhead.

Use views and roll-up jobs sparingly. If you do use rollups, create them for only the most critical summaries. A single rollup that counts open orders on an account is reasonable; four rollups that count open orders, sum order amounts, calculate average order value, and find the date of the latest order should be four separate on-demand calculations in Power Automate or a custom plugin.

Denormalize selectively. For high-cardinality relationships (an account with tens of thousands of related records), consider storing pre-calculated values in a separate summary table updated by a scheduled batch process, rather than relying on Dataverse to calculate them live. This trades a small amount of design complexity for significant performance gains.

Production-Ready Patterns

In practice, high-performing Dataverse implementations keep calculated and rollup columns minimal. A good rule of thumb: if a column is not displayed on a form or used in a critical workflow decision, it should not exist as a calculated or rollup column.

When you do create them, profile the specific form or report where they appear. Measure load time before and after; if latency increases by more than 200 milliseconds per column, investigate alternatives. For rollups, test with realistic data volumes; a rollup that works fine with 100 related records may not work at all with 10,000.

Document which forms, reports, and integrations depend on each calculated or rollup column. This becomes essential when troubleshooting slow operations; knowing that a dashboard uses a particular rollup helps you understand why it is not refreshing quickly.

Finally, review calculated and rollup columns every few months. As your implementation matures and data volumes grow, columns that performed acceptably in early stages may become bottlenecks. Removing a column that no longer serves a critical business purpose often has an immediate, measurable impact on overall system responsiveness.

Calculated columns and rollups are powerful tools when used deliberately. They become performance anchors when used casually. The teams that manage Dataverse best treat them not as convenience features, but as performance decisions that must be justified by real business need and validated through testing at production scale.


#DataversePerformance #CalculatedColumns #RollupOptimization #DataverseTuning #Dynamics365Performance #CloudArchitecture #DataverseArchitecture #SystemPerformance

Standard vs Custom Dataverse Tables: The Schema Decision That Compounds

Solution architect reviewing an entity-relationship diagram of Dataverse tables on a wall-mounted monitor in a modern office

A solution architect reviewing a Dataverse environment for a mid-market industrial services client recently found three separate custom tables, each carrying a different prefix from three different implementation phases, all describing the same thing: a physical site where equipment lived. One had been built by an internal power user modeling “Locations.” Another arrived bundled with an asset management add-on that already shipped a standard table for exactly this purpose. A third was created eighteen months later by a consulting partner who never checked whether either of the first two existed. None of the three synced with each other. Field technicians updated one, finance reported from another, and a Copilot Studio agent built the following year queried a fourth table that didn’t even have the data anyone actually needed.

This is not an unusual story. It is close to the default outcome when the standard vs custom Dataverse tables decision gets made under sprint pressure by whoever is in the room that week, without anyone asking a simple question first: does a standard table already do this?

Solution architect reviewing an entity-relationship diagram of Dataverse tables on a wall-mounted monitor in a modern office

Why the standard vs custom Dataverse tables decision is easy to get wrong

Dataverse ships with hundreds of standard tables (Account, Contact, and Case are the obvious ones, but plenty of others arrive silently through installed solutions like Asset Management, Project Operations, or Customer Service) built on the Common Data Model, Microsoft’s shared schema for representing common business concepts consistently across apps. These tables carry no prefix. A custom table, by contrast, always carries one, whether that’s a publisher prefix like cra_ or a legacy new_. That naming convention is the fastest way to tell which category a table belongs to, but it only helps if someone actually looks.

The reason teams skip that check is rarely laziness. It is usually that building a new custom table feels faster and safer than researching whether a standard one already covers the need, especially early in a project when the backlog is long and the standard table’s full column list and relationship graph aren’t obvious from a quick glance at the maker portal. The problem is that this shortcut doesn’t cost you anything visible in week one. It costs you eighteen months later, when a Fabric Link migration, a cross-application integration between Finance and Operations and Customer Engagement, or a Copilot Studio agent expects the canonical CDM entity and instead finds three partial, disconnected substitutes.

What actually distinguishes standard, custom, and virtual tables

The decision isn’t really binary. There are three categories worth holding in mind, and each answers a different question about who owns the data’s lifecycle.

Standard tables are the right choice when Dataverse itself is the authoritative source for that data and the concept maps to something Microsoft has already modeled: a contact, an account, a case, a work order. Even when a standard table doesn’t fit perfectly out of the box, most standard tables are customizable, meaning you can add columns, choices, and relationships to extend them without forking the concept into a parallel structure. Extending a standard table keeps every existing app, flow, security role, and future Copilot agent that already understands that entity working correctly, because they’re still querying the same canonical table, just with a few more fields on it.

Custom tables earn their place when the data genuinely doesn’t correspond to anything in the Common Data Model and is specific to how your organization actually operates: an internal certification tracking table, a custom approval matrix, something with no reasonable standard analog. The mistake isn’t creating custom tables. It’s creating one before checking whether the concept already has a home.

Virtual tables solve a different problem entirely: they matter when an external system, not Dataverse, remains the true owner of a record’s lifecycle. A virtual table stores only metadata in Dataverse and queries the external source (an ERP system, a warehouse management platform, a legacy line-of-business database) live, through a data provider. This matters more than it sounds like it should, because the alternative, replicating that external data into a standard or custom Dataverse table on a schedule, introduces a staleness window that can turn into a real operational failure. If a warehouse system shows zero units on hand but the last Dataverse sync ran six hours ago and still shows ten, a sales rep can quote stock that doesn’t exist, and the order gets canceled after the customer has already been told it’s on the way. Virtual tables avoid that gap by not caching the data at all, at the cost of depending entirely on the external system’s availability and performance for every query.

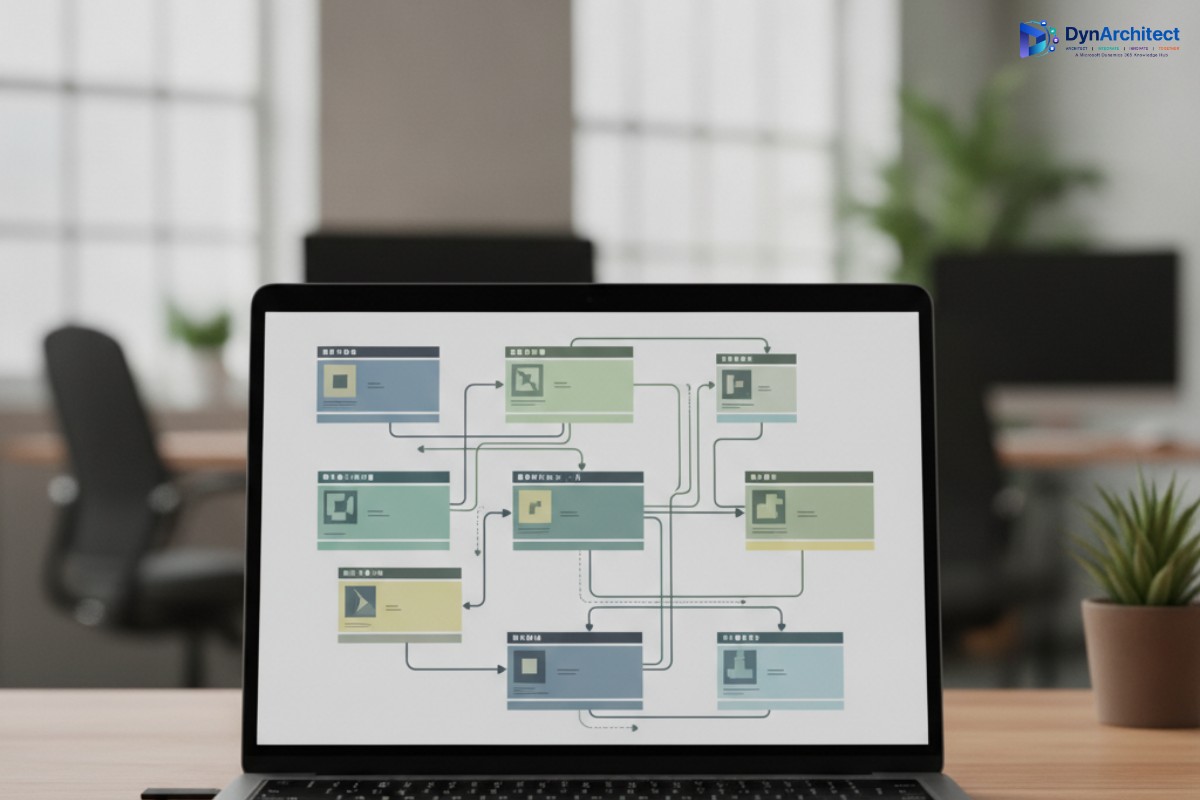
Close-up of a laptop screen showing an abstract database table relationship diagram on a desk

The decision doesn’t stop at the table level

Getting the table category right is only the first layer of the structure question. Once you’ve decided a standard table is the right home for a concept, the choice columns and relationships you add to extend it are where a lot of the same discipline quietly gets abandoned. A choice column added to the standard Case table to capture an industry-specific status, for instance, is a reasonable extension. A parallel custom table built solely to hold a lookup list of those same statuses, connected back to Case through a one-to-many relationship that duplicates logic the choice column could have handled directly, is the same mistake as the duplicate-table problem, just one level down. Relationships matter here too: a standard table’s existing relationships to Account, Contact, or Activity records represent years of Microsoft’s own modeling work and every prebuilt view, form, and security role built around them. Recreating an equivalent relationship structure on a new custom table means none of that inherited tooling applies, and every new integration has to be taught the relationship from scratch. The pattern to watch for is simple: if you’re building a new table or relationship whose only real justification is that it mirrors something a standard table’s fields or connections already do, that’s usually a sign to extend the standard structure instead of building a parallel one next to it.

Where this decision shows up again at the platform level

Microsoft’s own tooling has started reflecting how much this decision matters beyond a single app. Guided table selection for Dataverse-to-Fabric sync, which reached general availability in March 2026, now lets administrators choose which tables get synced to Microsoft Fabric before any data movement happens, rather than syncing everything by default and cleaning up storage and compute costs after the fact. That capability is far more useful, and far cheaper to operate, when the tables being selected are standard, CDM-aligned entities that Fabric, Copilot, and cross-application processes already expect, instead of a scattered set of custom tables that each need to be individually understood, mapped, and maintained by whoever inherits the environment next.

The same logic applies to Copilot Studio agents built against Dataverse. An agent configured to reason over the standard Account or Case table benefits from every piece of existing metadata, relationship, and security context Microsoft has already built around that entity. An agent pointed at a custom table invented to avoid learning the standard schema starts from nothing, and every future integration against that data has to rediscover the same ground.

A practical check before the next table gets created

Before greenlighting a new custom table, it’s worth spending twenty minutes on three checks that would have caught the industrial services example above. First, search the environment for a standard table whose name or description plausibly matches the concept, since standard tables installed by add-on solutions often don’t surface in a maker’s mental model of “what’s already in this environment” the way tables they built themselves do. Second, if a standard table exists but seems incomplete, check whether it’s marked customizable before assuming it needs to be replaced rather than extended, since most standard tables accept new columns, choices, and relationships without any loss of the functionality that came with them. Third, before replicating any externally-owned data into Dataverse on a schedule, ask explicitly whether the business can tolerate a sync delay, because if the answer is no, a virtual table is very likely the more honest architectural choice, even though it takes more setup effort than a straightforward custom table import.

None of this is exciting work, and it rarely shows up as a line item any client asks for by name. But schema decisions are the one architectural choice in a Dataverse implementation that nobody revisits for years, which is exactly why they deserve more scrutiny at the start than they usually get. Routeget Technologies typically includes a standard-table gap analysis as one of the first steps in any new Dataverse engagement, precisely because the cost of fixing a schema mistake grows every quarter it goes unnoticed, while the cost of catching it early is measured in a single afternoon of research.


#DataverseArchitecture #CommonDataModel #PowerPlatformGovernance #DataverseSchema #FabricLink #EnterpriseDataStrategy