Implementing Predictive Lead Scoring in Dynamics 365 Sales: Technical Architecture and Model Training

Sales organizations face a persistent challenge: most leads that enter the pipeline lack sufficient qualification signals, forcing sales teams to invest time and resources pursuing prospects with poor conversion odds. Rule-based lead scoring—manual point assignments for job title, company size, or email opens—falls apart at scale, especially when customer engagement patterns across multiple touchpoints remain isolated in separate systems. The result is wasted effort and extended sales cycles.

Dynamics 365 Sales offers native integration with AI Builder, which enables development teams to build predictive lead scoring models trained on historical customer engagement data within the platform. Unlike black-box SaaS solutions that require data export and integration overhead, this approach keeps customer data within your Dynamics 365 boundary, maintains compliance with data governance policies, and surfaces predictions directly in the sales interface where they influence deal qualification and prioritization decisions. Building and deploying a production predictive model requires understanding how to structure training data, configure model parameters, evaluate model performance, and integrate scoring results back into the sales workflow.

Structuring Data for Predictive Model Training

Predictive lead scoring models rely on historical examples of leads that converted versus those that did not. AI Builder requires a minimum of 100 historical examples in your training dataset, though 500 to 1,000 examples typically produce more stable, generalizable models. You must first decide which entity will serve as your training target. Most implementations use the Lead entity itself (marking leads as qualified or disqualified) or the Opportunity entity (marking won versus lost deals). The decision hinges on your business process: if you qualify and convert leads to opportunities separately, train on the Opportunity entity to capture conversion likelihood; if you operate a lead-only model, train on the Lead entity with a binary outcome field (for example, “Lead Status” with values “Qualified” or “Disqualified”).

Once you select your training target, identify the feature columns (predictive variables) that your model will use. These typically include demographic attributes (company industry, company size, lead source), behavioral signals (number of emails opened from marketing campaigns, days since last engagement, number of form submissions), and engagement frequency metrics (contact attempts, phone call outcomes). The model works best when features represent actual customer interactions or attributes that vary meaningfully between converted and unconverted leads. Avoid including target-correlated features (for example, do not include “Deal Closed” as a feature when trying to predict deal closure, since this creates circular reasoning).

Preparing and Configuring the Prediction Model

Within Dynamics 365 Sales, navigate to AI Builder and select “Binary Prediction” (a classification model that predicts one of two outcomes, such as “will convert” or “will not convert”). Upload your training dataset by pointing AI Builder to the entity containing your historical lead or opportunity records. The system automatically detects columns, infers data types, and suggests features. You must then map the target column (the outcome you want to predict) and select which additional columns should be used as features. AI Builder’s interface allows you to include or exclude specific columns; exclude highly correlated columns, columns with sparse data (more than 50 percent missing values), and columns that lack predictive power (for example, internal notes fields that contain unstructured text).

Configure model parameters by specifying the threshold at which the model will classify a lead as “high likelihood to convert.” By default, AI Builder uses 0.5 (50 percent) as the decision boundary, meaning the model must predict a probability of at least 0.5 for the lead to be marked as high-scoring. In practice, you may want to lower this threshold to catch more potential deals (increasing recall at the cost of some false positives) or raise it to be more conservative (increasing precision at the cost of missing some opportunities). Your choice depends on your sales process: if your team has capacity to follow up on all leads, a lower threshold catches more opportunities; if your team is constrained, a higher threshold focuses effort on the most promising leads.

Evaluating Model Quality and Performance

Before deploying a model to production, evaluate its performance using standard classification metrics. AI Builder provides precision, recall, F1 score, and AUC (area under the receiver operating characteristic curve) after training. Precision measures the proportion of predicted high-scoring leads that actually convert; recall measures the proportion of actual converts that the model correctly identified as high-scoring. Aim for a balanced combination: a model with high precision but low recall catches few opportunities, while a model with high recall but low precision floods your team with low-probability leads. The F1 score (harmonic mean of precision and recall) offers a single metric summarizing this balance. An AUC above 0.7 generally indicates useful discrimination; above 0.8 indicates strong model quality.

Importantly, evaluate your model on held-out test data (records not used during training), not on the training set itself. AI Builder automatically splits your dataset for this purpose. If your model performs well on training data but poorly on test data, your model may be overfitting to noise in the training set; in this case, simplify the model by removing non-predictive features or retraining with more diverse historical examples.

Integrating Scoring Results into Sales Workflows

Once your model passes quality checks and you publish it to production, integrate the scoring results into your sales process. AI Builder allows you to invoke the model on demand via a Power Automate cloud flow or as a plug-in on the Lead or Opportunity form. The most common pattern is a Power Automate cloud flow triggered when a lead is created, which calls the prediction model, captures the predicted probability and classification, and updates a custom “Predicted Score” column on the lead record. This score then becomes available in lead views, pipeline analytics, and mobile applications.

From a user experience perspective, surface the predicted score prominently on the sales dashboard and lead detail form so sales reps see the qualification confidence at a glance. Many organizations color-code leads based on predicted score (green for high probability, yellow for medium, red for low) to guide qualification decisions. Some teams implement a business rule that automatically assigns high-scoring leads to senior reps and routes low-scoring leads to junior reps for initial outreach, thereby optimizing resource allocation based on deal likelihood.

Monitoring Model Drift and Retraining

Predictive models do not remain accurate indefinitely. As your sales process evolves, customer behavior changes, or market conditions shift, the patterns your model learned during training may no longer reflect current conditions (a phenomenon called model drift). Set a quarterly or semi-annual schedule to assess model performance on recent data. If accuracy metrics decline by more than 5 to 10 percent compared to the original test results, retrain the model on a fresh dataset that includes recent leads and opportunities. AI Builder enables retraining as a straightforward operation: select the published model, update the training dataset to include new records, and republish.

Document your model’s feature importance (which inputs the model weights most heavily) so your organization understands what drives scoring decisions. AI Builder provides a feature importance report showing which columns contribute most to the model’s predictions. If your model places high importance on a feature that represents potential data quality issues (for example, “Days Since Last Email” if email tracking is inconsistent), address the data quality problem to improve future model iterations.

Common Pitfalls and Practical Guidance

A frequent mistake is training a model on imbalanced data, where one outcome (for example, “converted”) is much rarer than the other. If 80 percent of your historical leads did not convert, the model may learn to simply predict “no conversion” for all leads, achieving high accuracy but zero business value. To address this, explicitly configure class weights in your training setup (telling the model that conversions should be weighted more heavily) or oversample the minority class during data preparation.

Another pitfall is treating the model as a black box. Sales leaders sometimes interpret predicted scores as absolute probabilities rather than relative rankings. Communicate clearly that a predicted score of 0.8 does not mean “this lead has an 80 percent chance to close”; it means the model ranks this lead among the highest-probability prospects relative to others in your pipeline. The model’s value lies in comparative ranking and resource allocation, not in absolute probability estimation.

Finally, involve your sales leadership and operations team in model design and interpretation. If your organization has complex sales processes (for example, different qualification rules for enterprise deals versus mid-market deals), consider building separate models for each segment rather than a single global model. Similarly, if significant changes occur (a major product launch, a shift in target customer, an acquisition), retrain your model on data that reflects these new conditions.

Conclusion

Predictive lead scoring powered by AI Builder and native Dynamics 365 integration transforms how sales teams allocate effort and prioritize opportunities. By systematically capturing historical conversion patterns and translating them into forward-looking probability estimates, your organization gains visibility into which prospects justify investment and which may be better pursued later. The technical implementation is straightforward for most organizations: structure historical lead and opportunity data, configure an AI Builder classification model, evaluate performance on test data, and integrate results through Power Automate and the sales interface. Retraining quarterly and involving sales leadership in model governance ensures your scoring system remains effective as market conditions and customer behavior evolve. Routeget Technologies has deployed predictive lead scoring across dozens of Dynamics 365 Sales implementations, helping organizations increase pipeline accuracy and accelerate sales velocity through data-driven qualification.

#PredictiveLeadScoring #AIBuilderDynamics365 #SalesIntelligence #DynamicsSalesAI #CustomerInsights #PredictiveAnalytics #SalesEnablement #DynamicsImplementation #EnterpriseAI #SalesDataStrategy


Implementing Predictive Lead Scoring in Dynamics 365 Sales: Technical Architecture and Model Training

Sales organizations face a persistent challenge: most leads that enter the pipeline lack sufficient qualification signals, forcing sales teams to invest time and resources pursuing prospects with poor conversion odds. Rule-based lead scoring—manual point assignments for job title, company size, or email opens—falls apart at scale, especially when customer engagement patterns across multiple touchpoints remain isolated in separate systems. The result is wasted effort and extended sales cycles.

Dynamics 365 Sales offers native integration with AI Builder, which enables development teams to build predictive lead scoring models trained on historical customer engagement data within the platform. Unlike black-box SaaS solutions that require data export and integration overhead, this approach keeps customer data within your Dynamics 365 boundary, maintains compliance with data governance policies, and surfaces predictions directly in the sales interface where they influence deal qualification and prioritization decisions. Building and deploying a production predictive model requires understanding how to structure training data, configure model parameters, evaluate model performance, and integrate scoring results back into the sales workflow.

**Structuring Data for Predictive Model Training**

Predictive lead scoring models rely on historical examples of leads that converted versus those that did not. AI Builder requires a minimum of 100 historical examples in your training dataset, though 500 to 1,000 examples typically produce more stable, generalizable models. You must first decide which entity will serve as your training target. Most implementations use the Lead entity itself (marking leads as qualified or disqualified) or the Opportunity entity (marking won versus lost deals). The decision hinges on your business process: if you qualify and convert leads to opportunities separately, train on the Opportunity entity to capture conversion likelihood; if you operate a lead-only model, train on the Lead entity with a binary outcome field (for example, “Lead Status” with values “Qualified” or “Disqualified”).

Once you select your training target, identify the feature columns (predictive variables) that your model will use. These typically include demographic attributes (company industry, company size, lead source), behavioral signals (number of emails opened from marketing campaigns, days since last engagement, number of form submissions), and engagement frequency metrics (contact attempts, phone call outcomes). The model works best when features represent actual customer interactions or attributes that vary meaningfully between converted and unconverted leads. Avoid including target-correlated features (for example, do not include “Deal Closed” as a feature when trying to predict deal closure, since this creates circular reasoning).

**Preparing and Configuring the Prediction Model**

Within Dynamics 365 Sales, navigate to AI Builder and select “Binary Prediction” (a classification model that predicts one of two outcomes, such as “will convert” or “will not convert”). Upload your training dataset by pointing AI Builder to the entity containing your historical lead or opportunity records. The system automatically detects columns, infers data types, and suggests features. You must then map the target column (the outcome you want to predict) and select which additional columns should be used as features. AI Builder’s interface allows you to include or exclude specific columns; exclude highly correlated columns, columns with sparse data (more than 50 percent missing values), and columns that lack predictive power (for example, internal notes fields that contain unstructured text).

Configure model parameters by specifying the threshold at which the model will classify a lead as “high likelihood to convert.” By default, AI Builder uses 0.5 (50 percent) as the decision boundary, meaning the model must predict a probability of at least 0.5 for the lead to be marked as high-scoring. In practice, you may want to lower this threshold to catch more potential deals (increasing recall at the cost of some false positives) or raise it to be more conservative (increasing precision at the cost of missing some opportunities). Your choice depends on your sales process: if your team has capacity to follow up on all leads, a lower threshold catches more opportunities; if your team is constrained, a higher threshold focuses effort on the most promising leads.

**Evaluating Model Quality and Performance**

Before deploying a model to production, evaluate its performance using standard classification metrics. AI Builder provides precision, recall, F1 score, and AUC (area under the receiver operating characteristic curve) after training. Precision measures the proportion of predicted high-scoring leads that actually convert; recall measures the proportion of actual converts that the model correctly identified as high-scoring. Aim for a balanced combination: a model with high precision but low recall catches few opportunities, while a model with high recall but low precision floods your team with low-probability leads. The F1 score (harmonic mean of precision and recall) offers a single metric summarizing this balance. An AUC above 0.7 generally indicates useful discrimination; above 0.8 indicates strong model quality.

Importantly, evaluate your model on held-out test data (records not used during training), not on the training set itself. AI Builder automatically splits your dataset for this purpose. If your model performs well on training data but poorly on test data, your model may be overfitting to noise in the training set; in this case, simplify the model by removing non-predictive features or retraining with more diverse historical examples.

**Integrating Scoring Results into Sales Workflows**

Once your model passes quality checks and you publish it to production, integrate the scoring results into your sales process. AI Builder allows you to invoke the model on demand via a Power Automate cloud flow or as a plug-in on the Lead or Opportunity form. The most common pattern is a Power Automate cloud flow triggered when a lead is created, which calls the prediction model, captures the predicted probability and classification, and updates a custom “Predicted Score” column on the lead record. This score then becomes available in lead views, pipeline analytics, and mobile applications.

From a user experience perspective, surface the predicted score prominently on the sales dashboard and lead detail form so sales reps see the qualification confidence at a glance. Many organizations color-code leads based on predicted score (green for high probability, yellow for medium, red for low) to guide qualification decisions. Some teams implement a business rule that automatically assigns high-scoring leads to senior reps and routes low-scoring leads to junior reps for initial outreach, thereby optimizing resource allocation based on deal likelihood.

**Monitoring Model Drift and Retraining**

Predictive models do not remain accurate indefinitely. As your sales process evolves, customer behavior changes, or market conditions shift, the patterns your model learned during training may no longer reflect current conditions (a phenomenon called model drift). Set a quarterly or semi-annual schedule to assess model performance on recent data. If accuracy metrics decline by more than 5 to 10 percent compared to the original test results, retrain the model on a fresh dataset that includes recent leads and opportunities. AI Builder enables retraining as a straightforward operation: select the published model, update the training dataset to include new records, and republish.

Document your model’s feature importance (which inputs the model weights most heavily) so your organization understands what drives scoring decisions. AI Builder provides a feature importance report showing which columns contribute most to the model’s predictions. If your model places high importance on a feature that represents potential data quality issues (for example, “Days Since Last Email” if email tracking is inconsistent), address the data quality problem to improve future model iterations.

**Common Pitfalls and Practical Guidance**

A frequent mistake is training a model on imbalanced data, where one outcome (for example, “converted”) is much rarer than the other. If 80 percent of your historical leads did not convert, the model may learn to simply predict “no conversion” for all leads, achieving high accuracy but zero business value. To address this, explicitly configure class weights in your training setup (telling the model that conversions should be weighted more heavily) or oversample the minority class during data preparation.

Another pitfall is treating the model as a black box. Sales leaders sometimes interpret predicted scores as absolute probabilities rather than relative rankings. Communicate clearly that a predicted score of 0.8 does not mean “this lead has an 80 percent chance to close”; it means the model ranks this lead among the highest-probability prospects relative to others in your pipeline. The model’s value lies in comparative ranking and resource allocation, not in absolute probability estimation.

Finally, involve your sales leadership and operations team in model design and interpretation. If your organization has complex sales processes (for example, different qualification rules for enterprise deals versus mid-market deals), consider building separate models for each segment rather than a single global model. Similarly, if significant changes occur (a major product launch, a shift in target customer, an acquisition), retrain your model on data that reflects these new conditions.

**Conclusion**

Predictive lead scoring powered by AI Builder and native Dynamics 365 integration transforms how sales teams allocate effort and prioritize opportunities. By systematically capturing historical conversion patterns and translating them into forward-looking probability estimates, your organization gains visibility into which prospects justify investment and which may be better pursued later. The technical implementation is straightforward for most organizations: structure historical lead and opportunity data, configure an AI Builder classification model, evaluate performance on test data, and integrate results through Power Automate and the sales interface. Retraining quarterly and involving sales leadership in model governance ensures your scoring system remains effective as market conditions and customer behavior evolve. Routeget Technologies has deployed predictive lead scoring across dozens of Dynamics 365 Sales implementations, helping organizations increase pipeline accuracy and accelerate sales velocity through data-driven qualification.

#PredictiveLeadScoring #AIBuilderDynamics365 #SalesIntelligence #DynamicsSalesAI #CustomerInsights #PredictiveAnalytics #SalesEnablement #DynamicsImplementation #EnterpriseAI #SalesDataStrategy

Project Profitability in Dynamics 365 Project Operations: Why Your Project Margins Fail Without Proper Accounting Setup

Dynamics 365 Project Operations financial dashboard showing project profitability metrics

A professional services firm running Dynamics 365 Project Operations pulls its monthly margin report and finds something that doesn’t match reality on the ground. One fixed-price engagement shows a 60 percent margin despite the delivery team saying they’ve been slammed for weeks. Another time-and-materials project shows a loss even though every hour logged was billed. Nobody misused the system. Nobody entered a wrong number. The transactions are all correct, and the margins are still wrong, because project profitability in Dynamics 365 Project Operations is decided by the accounting setup behind those transactions, not by the transactions themselves.

Dynamics 365 Project Operations financial dashboard showing project profitability metrics

Two Price Lists, One Easy Mix-Up

Project Operations resolves cost and revenue through separate price lists, and the distinction matters more than the name suggests. A cost price list resolves the rates used on cost-type estimate and actual transactions, essentially what a resource actually costs the business. A sales price list resolves the rates used on the billed and unbilled sales side, essentially what gets charged to the customer. Each is set to a context, Cost or Sales, and that context governs how the system looks the record up. Set a list to the wrong context and price resolution simply fails to find a rate where one should exist.

Sales price lists carry another constraint cost lists don’t: they’re locked to the currency defined on the list header, while cost price lists can hold role prices in other currencies through user setup overrides. That asymmetry catches multinational firms more often than it should, particularly when a role price gets added to a sales list in the wrong currency and the transaction silently falls back to a default rate instead of erroring out. Sales price lists also have to be explicitly attached, to a customer’s project price list, a project quote, or a project contract, before they apply to anything; a rate sitting correctly configured but never attached to the contract in play won’t be used. Add date ranges into the mix, since price lists apply based on start and end dates, and a gap between two lists means a stretch of transactions with no applicable rate at all.

Where Margin Actually Gets Decided

Price lists set the numbers going into a transaction. What happens to those numbers on the ledger, which is what actually produces a margin figure, is governed by a separate configuration object: the project cost and revenue profile, found under Project management and accounting, Setup, Posting. This is the part of the setup that gets underinvested in relative to how much leverage it has over reported profitability.

The ledger settings on a profile decide, transaction type by transaction type, hour, expense, item, whether costs post straight to the profit and loss statement or sit on the balance sheet as work in progress until someone runs a separate posting step. They also decide whether on-account, milestone-based invoicing lands in a balance account or a P&L account, and whether unbilled revenue gets accrued to the general ledger at all. None of these settings are visible on the transaction itself. A time entry looks identical whether its hours are configured to post immediately or to wait in WIP, which is exactly why a wrong setting here doesn’t throw an error. It just quietly changes what shows up as margin.

Finance professional reviewing project accounting and cost allocation data

Fixed-Price Work Needs Its Own Logic

Time-and-materials projects recognize revenue roughly as work happens, so the profile settings above cover most of what matters. Fixed-price projects need an additional layer, because the billing schedule and the actual delivery pace are two different things, and the whole point of the accounting setup is to keep them from contaminating each other. Project Operations offers three methods here. Completed contract holds all revenue and cost recognition until the project finishes, carrying everything as WIP in the meantime. Completed percentage accrues revenue periodically based on how much of the project is actually done, using cost templates to group transactions for the percentage-complete calculation and period codes to set how often that calculation runs. No WIP skips the deferral entirely and is meant for short engagements where invoicing and cost recognition happen close enough together that deferral adds nothing but complexity.

A firm running long, milestone-heavy fixed-price engagements under a “no WIP” setup, because that was the default nobody revisited, will see revenue and cost recognized in whatever period the invoice happens to fall in rather than the period the work actually happened in. Margins swing from project to project not because delivery efficiency is inconsistent, but because the accounting method assumes short-cycle work being applied to long-cycle contracts.

Five Specific Ways This Goes Wrong

A handful of misconfiguration patterns show up repeatedly enough to be worth naming directly. A billing method mismatch, where time is set to fixed-price logic on what’s actually a time-and-materials engagement, or the reverse, throws off exactly when hours or expenses hit revenue relative to when they’re billed. A missed manual step is just as damaging: when hour or expense costs are set to post to a balance account rather than profit and loss, someone has to run the “post costs” function to move them into P&L, and if that step is skipped, costs simply never show up against revenue, producing a margin that looks better than it is. A mismatched revenue recognition method does similar damage from the other direction, completed contract selected on the profile while revenue is somehow still being accrued on a monthly cadence, which mismatches costs and revenue by period and makes margins swing without any real change in delivery.

The accrual settings create a subtler trap. Revenue accrual turned on for a time-and-materials engagement whose cost posting is set to “no ledger” produces transactions where revenue is recognized but the matching cost is never posted anywhere, which can show as a margin approaching 100 percent on paper. And on-account invoicing routed to a profit and loss account instead of a balance account recognizes milestone billings as revenue immediately, ahead of the delivery they’re meant to represent, front-loading margin into whichever period the invoice happens to land in.

Getting Project Profitability Right Before the Numbers Matter

None of this is complicated once it’s named, but it has to be checked deliberately rather than assumed. Start by confirming which billing method, time-and-materials or fixed-price, is actually assigned to each active profile, and cross-check that against how the contracts using that profile are actually structured. Walk the ledger settings for each transaction type and confirm someone owns the recurring job of running the “post costs” function if any type is set to balance posting, since that step doesn’t run itself. For fixed-price work, match the recognition method to the actual shape of the engagement rather than the platform default, short and simple work can reasonably use no WIP, but anything spanning multiple billing cycles needs completed percentage with cost templates that actually reflect how the project’s cost mix is structured. Finally, verify that profile assignment rules, by contract, project group, or individual project, are actually routing each engagement to the profile that matches how it’s billed, since a firm running several contract types often has profiles that were configured correctly once and then silently misapplied as the portfolio grew.

Routeget Technologies has walked in behind project-based businesses whose delivery teams were being blamed for margin problems that turned out to live entirely in the posting configuration, not the work. Reconciling that gap usually takes a focused audit of the profile settings against a sample of actual contracts, not a re-implementation, and it tends to be one of the highest-leverage half-days a Project Operations environment can spend.


#ProjectProfitability #ProjectAccounting #ProjectOperations #RevenueRecognition #WIPAccounting #CFOStrategy

Dynamics 365 Finance Month-End Close: Why Manual Review Processes Eat Three Weeks of Your Finance Team’s Time

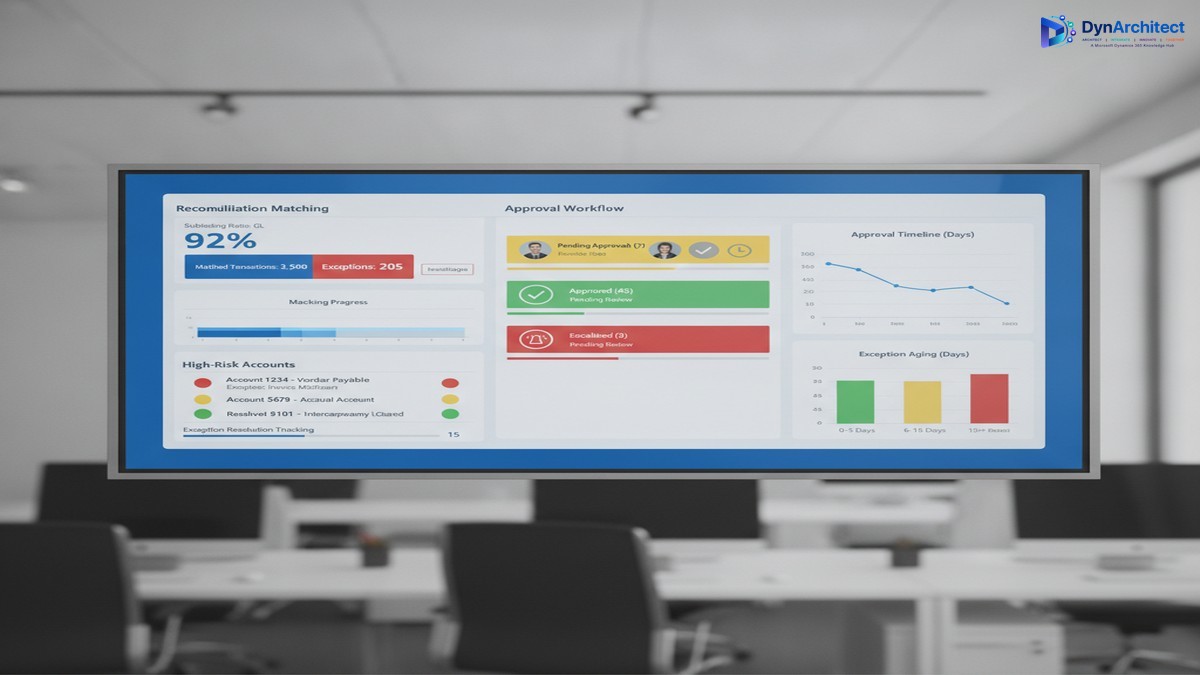
Dynamics 365 Finance month-end close dashboard with reconciliation and approval workflows

Your CFO expects the month-end close to take five business days. Your finance team knows it will take at least three weeks, if nothing breaks. Neither estimate is wrong, but the gap between them exposes a concrete operational problem that Dynamics 365 Finance can address—if you design the close process deliberately rather than simply importing Excel workflows into a new system.

The root cause isn’t Dynamics 365 Finance’s fault. It’s that most organizations have never mapped the actual work their finance team performs during month-end close, and they transfer that unmapped work directly into D365 Finance, where the same manual reviews and exception-handling steps consume the same time, just now in a new interface. This article walks through the hidden work that extends close cycles and the specific D365 Finance capabilities that can compress it without sacrificing control.

The Hidden Work in Month-End Close

Finance teams perform three categories of work during month-end close: transactional, reconciliation, and review and approval. The first category moves quickly in Dynamics 365 Finance because transactional posting, reversal, and period closing are automated. The second category, reconciliation, is where most organizations find that D365 Finance has given them new tools but not a fundamentally different process. The third category, review and approval, is where the real bottleneck sits.

Reconciliation requires matching subledger balances to the general ledger and resolving differences. In Excel, this meant exporting general ledger data to a spreadsheet, exporting subledger data to another spreadsheet, and then manually or with crude formulas, finding and categorizing exceptions. In Dynamics 365 Finance, you have automated reconciliation matching, but it still requires manual exception review if a transaction doesn’t auto-match due to timing, rounding, or data misalignment. Many organizations don’t implement the reconciliation matching engine at all, and instead build custom reconciliation reports that they then export and manually review in Excel. That defeats the purpose. Organizations that do implement reconciliation matching still need a process to review and approve the remaining exceptions. If your exception resolution process is ad-hoc (email threads, informal approvals, updates made directly to the database by whoever has time), month-end close becomes a game of whack-a-mole where resolving one exception creates new work elsewhere.

The review and approval stage is where time collapses. At this stage, the close is technically complete from a system perspective—all journal entries have posted, all subledgers have been reconciled, and all accounts have been reviewed—but finance leadership has not yet signed off. This is where your CFO’s five-day close hits the wall. The approval process usually means compiling reports, distributing them via email, waiting for responses, and manually tracking who has signed off and who is still reviewing. If a reviewer finds an error, the journal entry gets reversed, the approver list gets longer, and the cycle starts again. If multiple reviewers work simultaneously without a structured change-control process, they may unknowingly create conflicting updates.

Dynamics 365 Finance month-end close dashboard with reconciliation and approval workflows

Why Dynamics 365 Finance’s Tools Don’t Automatically Solve This

Dynamics 365 Finance has features that address each of these stages. It has reconciliation matching for subledger-to-GL matching. It has a journal approval workflow that routes entries to approvers. It has role-based security so that only authorized users can post to specific accounts or cost centers. But implementing these features doesn’t automatically translate to a faster close if the underlying process is not designed first.

The most common implementation pattern is this: the team implements D365 Finance features directly as they exist, with minimal process redesign. The reconciliation matching engine gets enabled but with no workflow for resolving exceptions. The journal approval workflow gets configured but with a long approval chain that mirrors the existing email-based approval process—five to ten approvers in sequence, each seeing the full entry list and taking days to respond. The role-based security gets configured but not used strategically to separate data entry from approval, so reviewers still spend time wading through draft entries they didn’t create.

The result is that Dynamics 365 Finance executes the existing process more efficiently at the transactional level but doesn’t reduce the actual elapsed time, because the transactional work was never the bottleneck. The bottleneck is the manual review and approval stage.

Structural Changes That Compress the Close Without Cutting Corners

Three structural changes to your close process, combined with deliberate use of D365 Finance features, can reduce elapsed close time from three weeks to ten to twelve business days while improving control and auditability.

The first change is to separate data entry from approval. Assign data entry (journal posting, subledger reconciliation, exception resolution) to one team and approval to another team that has not touched the data being approved. This isn’t a new idea, but Dynamics 365 Finance makes it operationally feasible. Your reconciliation team can mark exceptions as resolved in the reconciliation matching workspace, but the approval team (the controller, the finance director, or a designated approval group) can see which exceptions were resolved and review them before the general ledger is locked. By structuring permissions so that data entry users cannot post approved entries directly, and approval users see only high-level summaries plus exceptions, you cut the time approvers spend searching for relevant data. A 30-minute approval review of 500 transactions becomes a 10-minute review of 12 exceptions.

The second change is to compress the approval chain. Instead of sequential approval (entry review by the subledger owner, then the cost center manager, then the controller, then the finance director), design approval stages in parallel when possible and in short sequence when approval must be serial. Most organizations can reduce approval stages from five to three without sacrificing control. The subledger owner approves their subledger reconciliation in the reconciliation workspace. The controller approves all entries and reconciliation exceptions at once, using a dashboard that shows high-risk accounts and exceptions flagged by the reconciliation matching engine. The CFO reviews a summary and sign-off letter rather than individual entries. This parallel-where-possible, serial-only-where-necessary structure typically reduces approval cycle time from eight to ten days to two to four days.

The third change is to automate exception escalation. If an exception is not resolved within a specific time window (for example, three days after period end), Dynamics 365 Finance can send an automated alert to the responsible approver. This prevents exceptions from sitting in a queue and blocking closure. The escalation alert also creates an audit trail—it records when the exception was identified, when the alert was sent, and when it was finally resolved. This audit trail is exactly what your auditors want to see, and it removes the need for a manual exception log that has historically been built in Excel and updated sporadically.

The Realistic Implementation Timeline

These changes require careful process design before the configuration work begins. A typical implementation that adds close-process automation to an existing D365 Finance deployment takes three to four months. The first month is spent mapping current close processes, identifying where exceptions occur most often, and defining the data risk thresholds that trigger approval. The second month is spent building the reconciliation matching rules, configuring the approval workflow, and setting up the exception escalation alerts. The third month is spent running parallel close cycles (the old manual process running alongside the new D365 Finance process) so your finance team can validate that nothing is being missed. The month-end close itself becomes faster immediately, but the real efficiency gain comes in the fourth and fifth close cycles, after your team is comfortable with the new workflow.

The cost of this implementation is not primarily in configuration—it’s in the time your finance team spends away from month-end close activities while the process is being redesigned and validated. Expect to allocate one senior accountant and one finance operations person for two to three months. Expect also that your close process will feel slower for the first month or two after go-live, because your team is learning new workflows and validating that every exception has been captured and resolved. This is normal, and it is not a sign that the implementation has failed.

Making the Business Case to Leadership

The case for process redesign around month-end close is straightforward for a CFO: it frees up your most experienced team members from manual review work so they can focus on analysis, forecasting, and planning. It compresses the time it takes to close the books, which gives leadership three extra weeks per quarter to make decisions based on actual financial results rather than waiting for the close to complete. It creates an audit trail for month-end close activities, which strengthens your internal control environment and simplifies external audits. It reduces the error rate in close processes because exception resolution is now tracked and validated rather than handled ad-hoc.

The cost is three to four months of implementation effort plus the finance team’s time during the redesign phase. The benefit is a close process that runs three to four days faster and a finance team that spends ten to twelve fewer days per month on manual reconciliation and approval work. Over the course of a year, that’s enough time for your finance team to take on strategic work that they couldn’t fit before.

Month-end close doesn’t have to be a three-week sprint every month. It can be a structured, partially automated process that your finance team completes in two to three weeks while also having time to analyze variances and support the business. The tooling exists in Dynamics 365 Finance. The missing piece is usually a deliberate process design that aligns the close workflow with your organization’s risk tolerance and approval structure.


About Routeget Technologies: Routeget Technologies helps mid-market and enterprise organizations streamline financial operations with Dynamics 365 Finance. If your finance team’s close process is consistently running longer than expected, contact us for a process assessment that identifies where Dynamics 365 Finance can reduce manual work without cutting corners on control.

#DynamicsFinance #MonthEndClose #FinanceTransformation #FinanceOperations #CFOStrategy #DynamicsImplementation