Implementing Resilient Notification Workflows in Power Automate: Retry Logic, Error Handling, and Fault-Tolerance Patterns

Your notification workflow fails silently. A customer inquiry approval message never reaches the approver. A procurement alert gets dropped during a network hiccup. Three hours pass before anyone realizes the system stopped processing critical notifications, and by then, a delivery is missed and a SLA is breached. The code in your cloud flow looks correct, but production behavior tells a different story.

This problem sits at the intersection of two competing demands in enterprise automation: business processes require notifications to be reliable and traceable, yet cloud environments are inherently unpredictable. Network connectivity varies. External APIs return unexpected status codes. Throttling limits kick in under load. Building notification workflows that survive these failures requires more than trying once and hoping for the best. It demands deliberate architecture.

The Three Failure Modes of Notification Workflows

Before designing a solution, recognize where notification workflows actually break. The first failure mode is transient: the external service is temporarily unavailable, throttled, or experiencing a brief network interruption. A retry seconds or minutes later often succeeds. The second failure mode is permanent: the email address is malformed, the Teams channel ID is invalid, or the service genuinely cannot fulfill the request. Retrying indefinitely wastes resources and masks the real problem. The third failure mode is cascading: a single failed notification blocks subsequent actions, leaving the workflow in an incomplete state with no trace of what happened or what remains to be done.

Cloud flows do not distinguish between these modes automatically. By default, a failed step halts execution and marks the entire flow as failed, creating one large bucket where transient network blips sit alongside configuration errors. Without explicit handling, you lose visibility into what failed, why it failed, and whether retrying makes sense.

Implementing Retry Logic That Works

Power Automate’s native retry policy is a starting point, not the complete solution. You can configure automatic retry on any action: wait a few seconds, then try again, up to a maximum of three attempts by default. This covers many transient failures cheaply without extra code. However, relying on this alone creates a false sense of reliability.

The first limitation is scope. Native retry applies to a single action, not to a logical workflow segment. If your notification workflow involves multiple dependent steps (compose a message, look up the recipient, send via Teams, log the result), a failure in any step halts the sequence. You need retry logic at a higher level, not just at individual actions.

The second limitation is visibility. Retries happen silently. If a notification retries three times and still fails, you have no built-in way to capture that failure, alert an operator, or escalate it for investigation. The flow concludes as failed, but the reason and the scope of impact remain opaque.

The practical approach combines native retry with explicit error handling. Start by enabling automatic retry on actions most likely to hit transient failures: HTTP requests, API connectors, and external service calls. Set retry to two or three attempts with exponential backoff (few seconds, then longer). This handles 80 percent of transient issues with zero extra configuration.

Then wrap critical sequences in a try-catch pattern using Power Automate’s scope and error handling features. A scope action groups related steps into a single unit. Configure the scope to run on success and to run on failure. If any step within the scope fails, the failure branch executes, allowing you to decide what happens next: retry the entire scope with exponential backoff, escalate to a backup notification method, log the failure with context, or all three.

Designing Fault-Tolerant Notification Pipelines

Enterprise notification workflows often have multiple delivery channels: primary email, then Teams, then SMS, then human escalation. Implementing this as a cascade, where each channel fails the entire workflow if it fails, is fragile. Instead, treat each channel as optional with explicit failure handling.

Use a parallel-branching pattern: attempt all channels concurrently, each with its own error handling scope. If email fails but Teams succeeds, the critical notification still reaches the recipient. Log successes and failures separately so you can trace what worked and what did not. This approach trades lower latency (parallel execution) for improved resilience (multiple chances to deliver).

For each notification channel, implement a three-tier escalation. First, attempt the primary delivery method with native retry enabled. Second, if that fails, attempt a backup channel (different service, different account, fallback mechanism). Third, if both fail, trigger an alert to your operations team with full context: who was being notified, what message failed, which channels were attempted, and what error was returned. Do not silently drop notifications that cannot be delivered.

Implementing Distributed Retry With Exponential Backoff

Simple retry on immediate failure is insufficient for workflows that encounter throttling or queue congestion. Distributed retry spreads retry attempts across time, reducing load spikes and improving success rates. The pattern is straightforward: if an action fails, wait a calculated interval (longer each time), then retry, rather than hammering the same endpoint repeatedly within seconds.

Implement this using a compose action that calculates backoff time based on retry count. After the first failure, wait 5 seconds. After the second, wait 15 seconds. After the third, wait 60 seconds. If you want to implement this correctly, the backoff should be exponential or follow a configurable schedule rather than linear, since most transient failures resolve within seconds while congestion-related failures require longer waits.

Store retry metadata (attempt count, last error, timestamp) in a variable or log table. This gives you visibility into how many times each notification was retried and when, which is essential for troubleshooting and for detecting patterns (are certain recipients always failing? is a particular channel consistently timing out?).

Centralized Failure Logging and Alerting

A notification workflow that fails silently is worse than no workflow at all. You must log every notification attempt with outcome, timestamp, error details, and context. Store this in a dedicated table (Dataverse, SQL database, or even a SharePoint list) so you can query it later to answer: which notifications failed? which users were affected? which channels are unreliable?

Structure your logging to capture: the intended recipient (email, Teams ID, mobile number), the notification content or message ID, the primary delivery method attempted, any fallback methods attempted, the final status (success or failed), the specific error (if any), retry count, and total time to resolution. With this data, you can identify patterns and respond proactively when a channel starts degrading.

Implement centralized failure alerting. If a notification fails after all retries are exhausted, trigger an alert to a monitored channel or queue immediately. Do not rely on someone checking a log table tomorrow. Critical notifications that fail require immediate human attention, and that attention must reach someone in minutes, not hours.

Testing Resilience Before Production

Resilient workflows are not magic. They must be tested. Create a test harness that simulates failures: configure a mock endpoint that returns throttling errors, configure a test recipient that always fails, inject errors into specific retry attempts and confirm that the workflow recovers. Test parallel channel execution by failing one channel and confirming the others still complete.

Run chaos testing. Temporarily disable a notification channel and confirm the workflow escalates to backups rather than giving up. Introduce network latency and confirm retry logic triggers appropriately. Test the logging system itself: if a failure occurs while trying to log a failure, can the workflow detect and handle that cascade?

Most importantly, test under load. A workflow that handles single notification failures gracefully may behave differently when processing 10,000 notifications an hour and throttling begins. Exponential backoff patterns that work fine for occasional failures can create thundering herds if applied uniformly across thousands of concurrent retries. Test at realistic scale before deploying.

Moving From Fragile to Reliable

Notification workflows are among the most important automations you build, yet they are often treated as afterthoughts. A flow that sends one message and halts on failure does not serve business processes. Building resilience into notification architecture takes deliberate design, but the investment pays dividends: customers receive approvals on time, teams get alerts they need to act on, and operations teams can trust that critical communications actually reach their destinations.

Routeget Technologies helps organizations architect Power Automate notification systems that are designed to succeed under real-world conditions, with comprehensive error handling, multi-channel delivery, and operational visibility built in from the start.


#PowerAutomateResilience #CloudFlowsErrorHandling #PowerAutomateRetryLogic #EnterpriseAutomation #NotificationWorkflows #PowerPlatformDevelopment #FaultTolerancePatterns #AutomationArchitecture #PowerAutomateIntegration #EnterprisePowerPlatform

Enterprise Power Automate Cloud Flow Architecture: Building Scalable, Fault-Tolerant Automation for Large Organizations

When your automation platform processes millions of records across hundreds of flows, architectural decisions that worked for single-tenant pilots stop scaling. A well-intentioned cloud flow that runs fine for 500 daily transactions suddenly times out when real-world volume hits 50,000. By that point, retrofitting the flow costs more in rework than planning it correctly from the start.

Enterprise-scale Power Automate success depends on how you architect cloud flows to handle the real constraints of production environments. This article walks through the technical patterns and architectural decisions that distinguish flows built for departments from flows built for organizations.

Understanding Power Automate Performance at Scale

Power Automate cloud flows run within Microsoft’s shared infrastructure, which means each flow competes for resources with thousands of others. Understanding these constraints is foundational to architecture decisions.

Cloud flows are subject to service limits: each request timeout is 120 seconds for timeout-based actions, and connector calls are rate-limited based on your tenant’s subscription level. In practice, this means a single action that fetches data from an external API might timeout if the API responds slowly or if your tenant is already near its daily API call quota. For flows running against large datasets, this isn’t a performance problem to ignore. It’s an architectural requirement to respect.

Parallel execution helps, but creates its own complexity. When a flow branches into multiple parallel paths (processing different records, querying different systems), all paths consume resources simultaneously. A flow that runs fine with five parallel branches might fail at scale when ten branches compete for connection pool capacity. Testing flows at the scale you’ll see in production isn’t optional. Testing at 10 percent of expected volume tells you almost nothing about what happens at full scale.

Designing for Throttling and Rate Limits

Every connector in Power Automate has throttling limits defined by the underlying service. Dynamics 365, SharePoint, SQL Server, and third-party APIs each have their own request rate limits. When a flow hits a rate limit, Power Automate queues requests, which introduces unpredictable latency. If your flow architecture assumes synchronous completion within 120 seconds, and the queue adds 30 seconds of waiting, you’ve just created a failure path in production.

Throttle-aware architecture separates flows that need tight timing from flows that can tolerate latency. A flow that needs to complete a transaction synchronously within a user-facing timeout should not depend on calling a heavily rate-limited external API. Instead, offload that call to an asynchronous flow that executes outside the user-facing window. Use variables to track state, store interim results in a database table, and let the user interface update asynchronously.

Connection throttling is often overlooked. If five flows all call the same Dynamics 365 instance simultaneously, they share a connection pool. Exhausting that pool makes subsequent calls queue. Flows that run on schedule should stagger their start times or use queuing patterns to avoid resource contention. Flows that respond to user actions should prioritize execution: a flow triggered by a user clicking a button deserves more resources than a background job that can run at 2 AM.

Error Handling and Graceful Degradation

The difference between a flow that fails silently and a flow that degrades gracefully is measurable in support tickets and customer escalations. Power Automate provides three essential error handling patterns that move flows from unreliable to production-ready.

The try-catch-finally pattern mirrors error handling in traditional programming. A “Try” scope contains actions that might fail. If any action fails, a “Catch” scope runs automatically via a run-after condition, logging the error, retrying if appropriate, or notifying an admin. A “Finally” scope runs regardless of success or failure, cleaning up resources or updating audit logs. This pattern ensures your flow has explicit paths for both success and failure, not just an unhandled exception that leaves flows stuck.

The terminate-with-status pattern goes further. Rather than letting flows end in an ambiguous state, use a boolean variable to track whether critical errors occurred. At the flow’s end, check this variable and call either “Terminate with Success” or “Terminate with Failure” to ensure the flow run reflects actual outcomes in Power Automate’s UI and accessible to downstream logic.

The flow-run-details-URL pattern addresses an operational reality: when flows fail at 2 AM, support teams need to diagnose quickly. Construct a clickable link to the flow run using the `workflow()` function, extracting the environment name, flow ID, and run ID. Include this link in failure notifications so troubleshooting starts with the actual error message, not a generic alert.

Beyond structured error handling, design for graceful degradation. Not every flow failure warrants stopping the entire process. If a flow is sending notifications to ten people and two notification endpoints are temporarily unavailable, the flow should succeed and log the partial failure, not terminate. Use apply-to-each with error handling per item, not all-or-nothing atomic operations.

Testing and Monitoring

Flows that go untested until production are flows that fail at scale. But testing Power Automate flows is different from testing traditional code.

Load testing matters. Run your flow against your target volume in a test environment and measure latency, resource consumption, and failure rates. A flow that completes in 30 seconds with 100 records might take three minutes with 10,000 records. Knowing this before production deployment prevents being surprised when performance degrades.

Timeout testing is often forgotten. Intentionally slow the connectors your flow calls (using test endpoints or delays) to confirm the flow handles the full 120-second timeout window gracefully. A flow that doesn’t handle timeout elegantly will fail without clear error messages.

Monitoring in production should track four dimensions: run count and duration (to spot performance regressions), failure rate and error reasons (to catch systematic issues before they cascade), connector throttling (to identify rate limit pressure), and flow run details (to enable rapid troubleshooting). Don’t wait for users to report that flows are broken. Monitor proactively and alert when metrics deviate from baseline.

Common Architectural Pitfalls

Over-parallelization creates resource contention when branches should run serially. Tight timeouts that don’t account for throttling guarantee failures at scale. Flows that suppress errors “for now” with conditional paths quickly become maintenance nightmares. Missing audit trails make post-mortem analysis impossible.

The most expensive architectural mistake is discovering at deployment time that a flow can’t handle the actual data volume or concurrency levels. This is solved not through clever coding, but through honest testing at scale before release.

Moving to Production

Production-ready Power Automate flows share common traits: explicit error handling with clear failure paths, timeout assumptions aligned with real throttling behavior, monitoring that exposes issues before they impact users, and testing that matches real volume. These aren’t optional refinements. They’re the difference between flows that work for pilots and flows that keep working when users depend on them.

Building at this level requires thinking beyond the flow canvas. It requires understanding the constraints of shared infrastructure, designing for failure, and respecting the difference between happy-path testing and production resilience. That’s how organizations scale from department-level automation to enterprise-grade solutions.


*Routeget Technologies helps enterprise organizations architect Power Automate solutions at scale, designing for the realities of production environments and building automation that survives the transition from pilot to platform.*


#PowerAutomateArchitecture #CloudFlows #EnterpriseAutomation #PowerPlatformDevelopment #FaultTolerance #PowerAutomatePerformance #MicrosoftAutomation

Tags: #PowerAutomateArchitecture #CloudFlows #EnterpriseAutomation #PowerPlatformDevelopment #FaultTolerance #PowerAutomatePerformance #MicrosoftAutomation

Predictive Sales Pipeline: Using AI-Driven Insights to Close Deals Faster in Dynamics 365 Sales

The Forecast Accuracy Problem

Your sales forecast is off by 35 percent. Again. The finance team wants to know next quarter’s revenue within two percent, but your pipeline visibility stops at whether deals exist and how long they’ve been sitting in “negotiation.” You look at spreadsheet tabs from regional managers, each with their own methodology for sizing opportunities and predicting close probability. Some are optimistic, some conservative, none consistent. The disconnect costs real money: cash-flow planning misfires, resource allocation goes sideways, and your board stops trusting the numbers you present.

This scenario repeats across thousands of organizations. Sales leaders inherit forecasting processes that depend entirely on deal volume and a manager’s intuition about velocity. The problem has always been that forecasting requires insight into factors spreadsheets cannot track: how engaged the decision-maker actually is, whether objections have real weight or are routine hesitation, how similar past deals progressed at this exact stage. Collecting that data manually, standardizing it across teams, and applying consistent logic to it exceeds human capacity, especially in enterprises where one forecast might pull together hundreds of open deals across multiple regions.

Dynamics 365 Sales now addresses this directly through predictive analytics built on explainable artificial intelligence. Rather than guess, sales leaders can make pipeline decisions grounded in pattern recognition across historical deal data, engagement signals, and real-time opportunity activity.

How Predictive Analytics Works in Practice

The approach sounds technical but operates transparently. Predictive AI in Dynamics 365 Sales analyzes two key data sources. First, it examines the historical record: past opportunities that closed won or lost, along with every attribute recorded in the CRM during their lifecycle (deal value, customer segment, sales stage, stage velocity, engagement patterns from email and meetings). Second, it observes real-time signals on current opportunities: activity frequency, meeting attendance, email responsiveness, and how quickly deals advance from stage to stage relative to historical norms.

The engine then calculates win probability, churn risk, renewal likelihood, or whatever outcome metric the organization defines. Critically, it explains its reasoning. A prediction of “72 percent win probability” becomes useless without context. But “72 percent because deal value and decision-maker engagement align with past high-probability patterns, though stage velocity trails historical norms” tells a manager something actionable: close timing may slip, but the deal has substance.

This explainability matters enormously to adoption. Sales teams that see black-box scores distrust them. Teams that understand why a deal scores 62 percent instead of 78 percent can act on the gap.

Business Outcomes Worth the Investment

The quantified benefits are substantial. Organizations that implement predictive analytics in Dynamics 365 Sales typically see a 20 to 30 percent reduction in forecast error compared to spreadsheet-driven methods. This translates directly into better cash-flow predictability for finance, more accurate revenue recognition for reporting, and fewer surprises for your board and investors. Some organizations report forecast accuracy improvement of up to 75 percent when moving from intuition-based forecasting to data-backed predictions.

Beyond accuracy, predictive analytics reshapes how sales leadership works. Instead of managing pipeline by volume (“we have 40 open deals worth $8 million”), managers manage by probability and risk (“we have $5.2 million in high-probability deals, $2.1 million at moderate risk, and $700k that needs intervention or should be re-evaluated”). This clarity enables coaching at scale: rather than react when deals slip or close unexpectedly, leaders proactively identify deals moving slower than historical patterns and intervene with targeted support.

Resource allocation improves. When you know which opportunities have the highest win probability relative to effort required, you can direct your best sales reps toward deals with maximum impact potential rather than distributing effort evenly across the pipeline. This is especially valuable for complex enterprise sales where a single rep’s productivity on a high-probability deal can shift quarterly results significantly.

Addressing the Adoption Challenge

Predictive analytics only delivers value if sales teams actually use it. This requires three foundational elements. First, data quality must be real. Garbage predictions come from garbage data. If your sales team is not consistently updating deal stage, recording meeting outcomes, or noting objections, predictive accuracy collapses. Organizations typically spend 4 to 8 weeks ensuring data hygiene before meaningful predictions emerge.

Second, the organization must define what outcomes matter. Dynamics 365 Sales allows you to build different prediction models for different deal types or customer segments. A 2 million dollar software license renewal may have completely different win indicators than a 50 thousand dollar managed services deal. Rather than force one model on both, segment your training data and let AI understand the patterns unique to each. This requires your sales and operations team to think deliberately about what “high-probability” means for their business, not just accept a default.

Third, sales leadership must reinforce the behaviors that improve predictions. If predictive scores show a deal at 48 percent win probability but no rep is taking action on that signal, predictions become noise. Tie rep performance reviews, deal reviews, and sales coaching to signals from predictive analytics, and reps will pay attention. Use the explanations as coaching tools: “Your engagement signal is tracking 15 percent below deals that close at this stage. What’s blocking the buyer’s internal process?”

Practical Implementation Starting Point

Most organizations begin with predictive win probability on their largest opportunities, since high-value deals justify investment in improving forecasting accuracy. Start there, let your team build confidence in the model for 60 to 90 days, then expand to other deal types or predictive outcomes such as churn risk on renewals or ramp time on new customer accounts.

Expect your IT team to validate that Dynamics 365 Sales predictive capabilities align with your governance and compliance requirements, especially around data retention, model transparency, and audit trails. The AI here is not a black box: you can inspect model factors, understand how historical data shaped predictions, and audit decision-making.

The investment required is typically modest. Predictive analytics comes built into Dynamics 365 Sales licensing; additional tooling costs depend on whether you want third-party extensions or need custom prediction models for highly unique deal types. Most returns come from better decisions rather than new infrastructure.

Moving Past Spreadsheet Forecasting

Sales forecasting remains one of the few business processes where most enterprises still rely on manual aggregation and management judgment. Organizations that have modernized forecasting to data-backed predictions consistently report that their board conversations shift. Instead of debating whether a forecast is real or inflated, conversations center on what factors are causing deal velocity to track below or above historical norms and what actions the sales organization should take in response.

Predictive analytics in Dynamics 365 Sales makes this shift possible. It transforms pipeline data from a static snapshot into a continuous source of strategic insight, enabling sales leaders to allocate resources toward high-probability opportunities, identify and coach deals at risk, and deliver forecasts that finance can rely on for planning. For organizations frustrated with forecast accuracy, the improvement is not incremental. It is substantial enough that some CIOs and CFOs view it as a primary driver of the value of Dynamics 365 Sales itself.


Routeget Technologies helps enterprise organizations implement sales-driven Dynamics 365 solutions that connect pipeline visibility with revenue predictability. Our consulting teams have guided forecasting modernization for organizations across manufacturing, distribution, and professional services sectors, ensuring predictive analytics implementations drive both adoption and business results.


#DynamicsSalesAI #PredictivePipeline #SalesForecasting #SalesCloud #DynamicsInsights #CRMStrategy #SalesLeadership

Building Enterprise-Grade Business Central Extensions: AL Language Best Practices, Dependency Management, and Performance Optimization

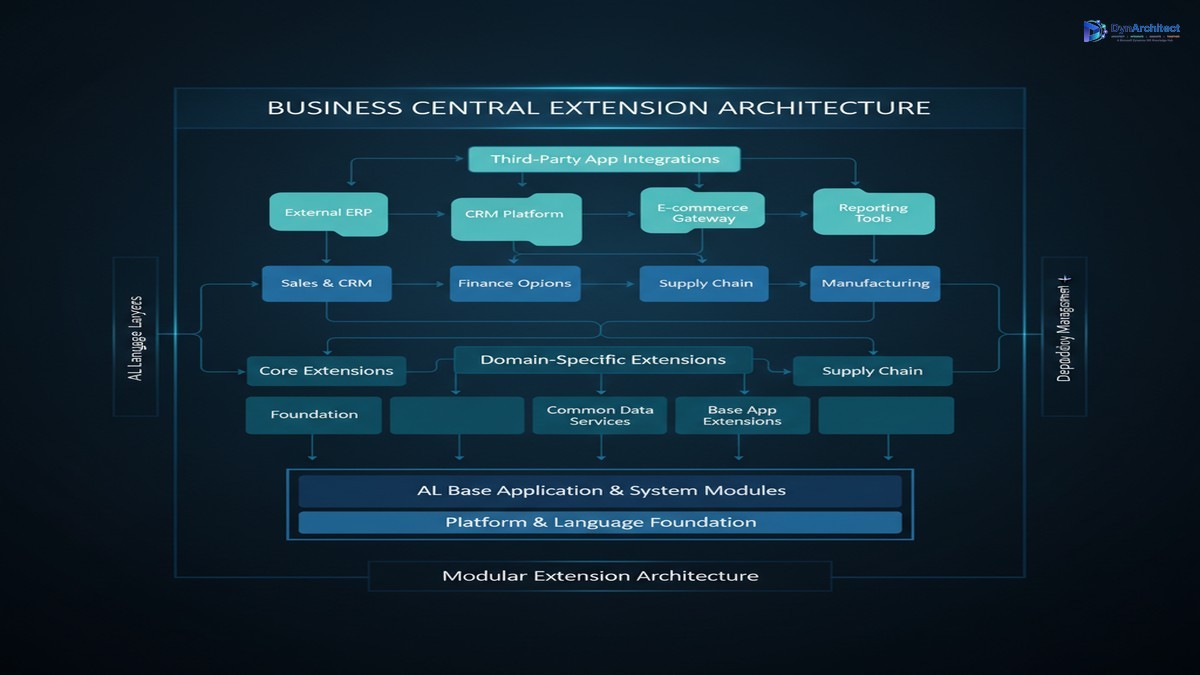
Business Central extension architecture and dependency management diagram with AL language layers and modular integration

The temptation to underestimate Business Central extension complexity is real, especially for teams migrating from legacy systems like Dynamics NAV or Dynamics GP. You get the cloud, you get the Azure-backed infrastructure, and suddenly extension development feels like the easy part. It rarely is. The AL language itself is modern and approachable, but scaling extensions across multi-tenant deployments, managing breaking changes across versions, and keeping runtime performance acceptable requires architectural thinking most teams discover too late.

Business Central extension architecture diagram with AL language layers and modular integration

## The AL Language Layer: Beyond the Syntax

AL is not a thin wrapper over familiar patterns. It is a type-safe, metadata-driven language designed specifically for Dynamics 365 Business Central’s event-driven architecture. This distinction matters. Writing valid AL code is different from writing maintainable extensions that survive updates, integrate with other extensions, and perform predictably under load.

Most teams encounter this when they begin mixing AL patterns across their own extensions. One team member uses procedural code for large batch operations, another chains event handlers expecting sequential execution, and a third builds data structures that clash with AL’s table metadata constraints. These choices do not fail immediately; they fail at scale, or during the next Business Central update, or when a customer deploys your extension alongside a third-party solution that makes similar assumptions.

The foundational discipline is understanding AL’s object model and metadata binding. Every AL object (table, page, report, codeunit) declares its intent at design time, not runtime. A table’s primary key structure is immutable once deployed to production; a field’s data type cannot be changed without data migration; relationships between tables are defined through foreign keys at the metadata level, not through application-level joins in procedural code. Teams that build to this model, treating metadata declarations as contracts, tend to survive updates and extensions conflicts far better than teams that treat AL as a generic imperative language.

## Dependency Management and Extension Composition

As your custom solutions grow, extensions accumulate. You likely have a base extension providing core business logic. You probably have domain-specific extensions for finance, supply chain, manufacturing. You may have third-party solutions from AppSource or custom integrations. Each one loads and runs within the same Business Central instance. Dependencies between them are not optional; they are architectural.

Many teams manage dependencies informally: a naming convention for tables, an unwritten rule about which extensions can call which, or careful manual testing to confirm no conflicts emerge. This works until it does not. You deploy an updated third-party extension, and suddenly your base extension’s event handlers no longer fire as expected because the third-party extension registers handlers on the same objects with different priorities. You add a new custom field to a table, and a report in an existing extension breaks because it makes assumptions about field structure. You rename an event in one extension and the dependent extension fails to bind at runtime because neither extension explicitly declares the dependency.

The right approach is treating extension composition as a design problem, not a deployment logistics problem. Each extension should declare its dependencies in its app.json file explicitly. Each extension should own a well-defined set of tables, pages, and events. Cross-extension calls should flow through clearly defined APIs (integration codeunits, events that other extensions are explicitly invited to subscribe to) rather than directly against tables or internal procedures. When an extension changes, dependent extensions fail to compile or at runtime hook registration fails, and you know immediately rather than discovering problems in customer deployments.

## Event-Driven Architecture and Handler Ordering

Business Central extensions operate in an event-driven model. You do not subclass objects or override methods; you subscribe to events that fire at defined points in the object lifecycle. This is powerful for extensibility and far less fragile than inheritance-based architectures. It is also deceptively easy to misuse.

A common mistake is assuming event handler execution order is deterministic. Two extensions both subscribe to the OnBeforeInsert event of a table. Which handler runs first? The answer is “undefined” without explicit priority declaration. If your logic depends on one handler running before the other, you are building a house of cards. A customer adds another extension, or AppSource releases an update, and handler order shifts. Your business logic breaks silently or produces incorrect results.

The principle is simple: make no assumptions about handler ordering unless you explicitly control it. If your extension depends on data being modified or events being raised in a specific order, declare that dependency. Use event priorities consciously. Consider whether a sequence of handlers can be reorganized into a single orchestration point rather than a chain of unordered event subscriptions.

Similarly, avoid performing long-running operations inside event handlers. Business Central event handlers execute synchronously within the transaction context of the triggering operation. A long-running SQL query, an external API call, or a batch data operation inside an event handler blocks the user interaction and risks transaction timeout. If you need to coordinate complex operations, use scheduled jobs, background tasks, or power integration orchestration outside the event handlers themselves.

## Performance Optimization and Query Patterns

Business Central extensions live in a multi-tenant cloud environment with resource governance. You do not own the database; you rent capacity. Query patterns that perform acceptably on a local single-tenant installation often stumble under load in production because of contention and resource limits.

The fundamentals are straightforward but often overlooked. Write efficient queries: use table keys for filtering, avoid unnecessary fields in SELECT projections, filter data at the database level rather than loading entire tables into AL variables. Use batch operations for bulk changes rather than loops with individual updates. Avoid queries inside event handlers that fire on every transaction. Profile your code using Business Central’s telemetry infrastructure to identify actual bottlenecks rather than optimizing on instinct.

One frequent pattern error is the “load all data then filter” approach. You write a report that loads every sales order in the company and then filters in AL code. This works fine with 500 orders; it fails when you have 500,000. The correct pattern is filtering at the database level using AL’s table filtering syntax, then loading only the rows you need.

Another is the N+1 query pattern. You loop through a set of header records and for each one, you run a query to load related detail records. With 1,000 headers, this becomes 1,001 queries. The correct approach is a single query that retrieves all headers and details in one operation, or two queries that load all data at once and correlate in AL code.

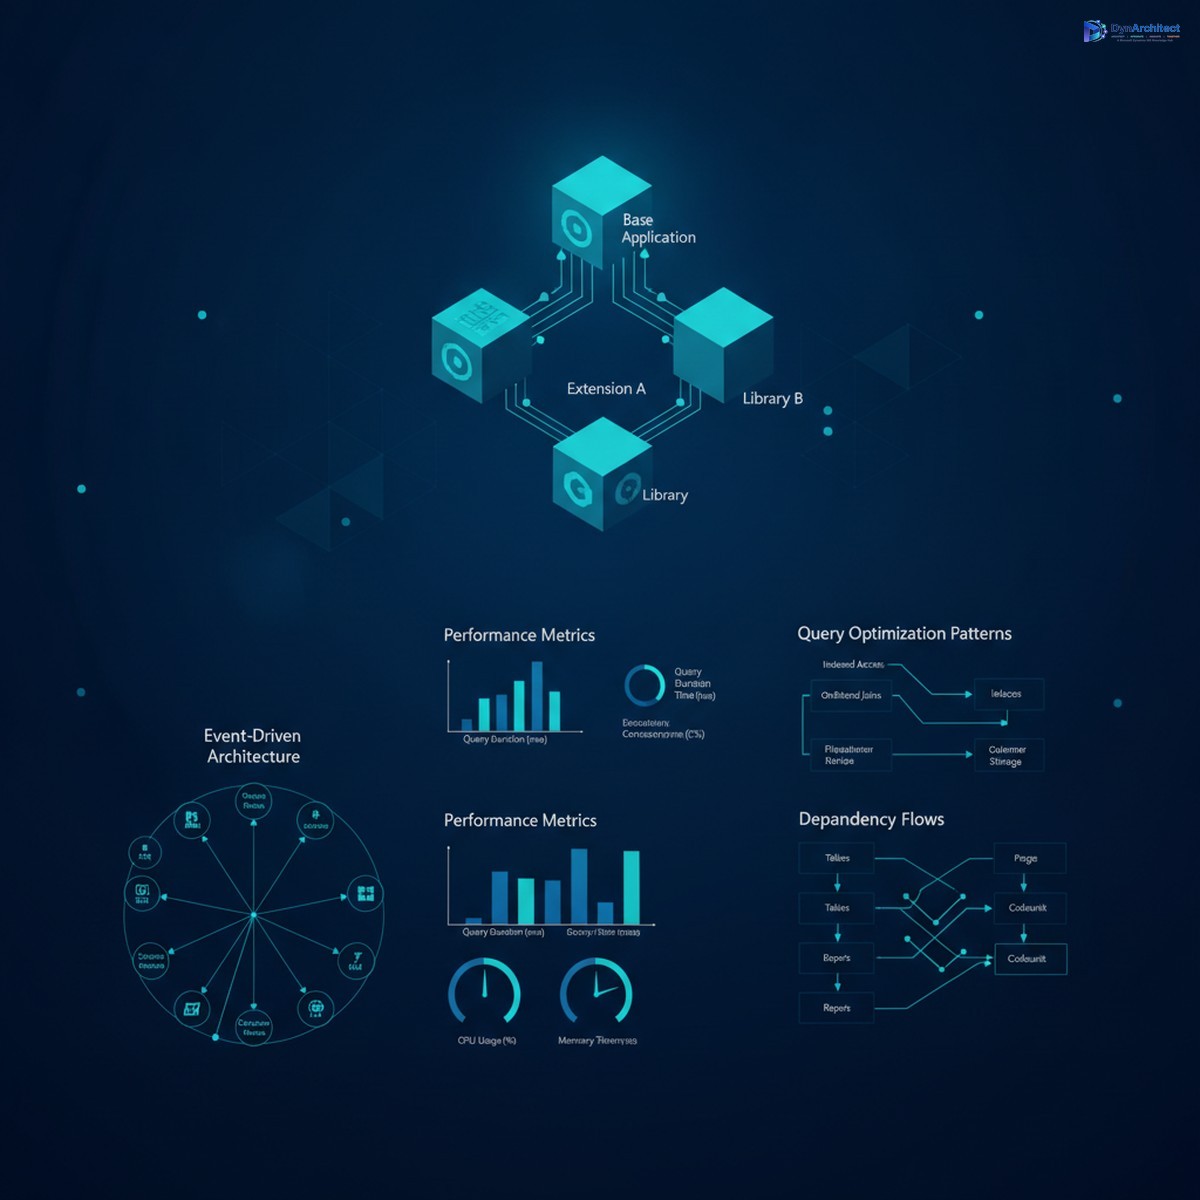
Business Central AL development environment showing code quality patterns and performance optimization

## Version Updates and Breaking Changes

Business Central updates every month. Your extensions must survive these updates. Microsoft maintains backward compatibility for the AL language and most APIs, but they do not guarantee that your custom logic will behave identically. Events might fire in different orders after an update. Performance characteristics might shift. New objects might shadow or conflict with your custom objects.

The practical answer is testing. You should regression test every extension after every Business Central update before deploying to production. Run your critical business flows, confirm that reports produce expected results, verify that integrations still function. This is not optional tooling; it is a requirement for stable production deployments.

You should also stay aware of deprecation announcements. Microsoft signals breaking changes well in advance. Review the release notes before each update. If your extension uses an API marked as deprecated, plan to migrate off it before support ends.

## Deployment Patterns and Lifecycle Management

How you package and deploy extensions matters. Most organizations start by deploying all custom extensions into a single App Package file, or worse, as a single sandbox solution from Visual Studio Code. This works at small scale. At scale, it becomes a bottleneck. A single developer making a small bug fix to one feature must rebuild and redeploy the entire package, potentially blocking deployments by other teams. A customer wants to selectively disable a feature without rebuilding the whole solution.

The mature approach is modular packaging. Core functionality lives in a base extension. Domain-specific logic lives in separate, focused extensions that depend on the base. Third-party solutions integrate through published events and APIs. Each extension is versioned, deployed, and updated independently. Customers can subscribe to updates or defer them based on their readiness, rather than being locked to a monolithic release cycle.

You should also have a clear Application Lifecycle Management (ALM) strategy. Version your extensions. Maintain a change log. Test updates in a staging environment before production. Have a rollback plan if an update causes issues. Business Central app upgrades are designed to handle schema migration and data transformation automatically in many cases, but only if you structure your deployments correctly.

## Path Forward

Building robust Business Central extensions is not about mastering AL syntax; it is about understanding the platform’s model, planning dependencies deliberately, avoiding common performance pitfalls, and treating versioning and deployment as architectural concerns rather than afterthoughts. Teams that succeed do this from the start. Teams that struggle usually discover these principles only after something breaks in production.

If you are starting extension development, adopt these practices early. If you are maintaining existing extensions, audit them against these principles. Refactoring to improve dependency management or performance optimization costs time upfront but pays back almost immediately in reduced support burden and faster deployment cycles.

Building enterprise-grade Business Central solutions requires discipline, but it is entirely achievable if you are intentional about architecture from the outset.

#BusinessCentralAL #DynamicsExtensions #ALLanguagePatterns #ExtensionArchitecture #BCPerformanceTuning #CloudERP

Securing Multi-Tenant Dataverse Deployments: Governance Models and Compliance Strategies for Enterprise Organizations

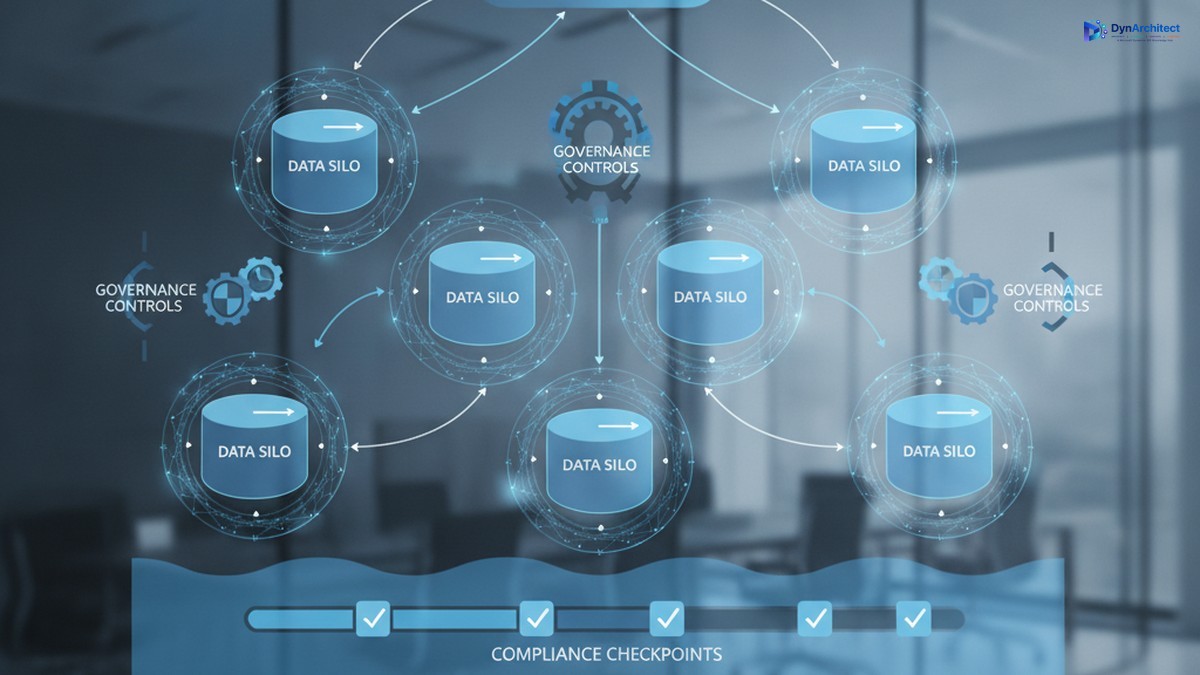
Enterprise data governance dashboard showing Dataverse multi-tenant architecture with secure data silos and compliance controls

When a large manufacturing conglomerate with seven regional subsidiaries decided to consolidate its Dynamics 365 deployments, the IT leadership faced a fundamental question: should each subsidiary run its own independent Dataverse environment, or could they share a single tenant with logical data separation? The answer shaped not just their technical architecture but their compliance posture, operational costs, security model, and ability to scale quickly. It took six months of planning to get it right.

This is the decision every large enterprise faces when moving Dynamics 365 to the cloud. Dataverse gives organizations flexibility in how they structure data and access, but that flexibility demands clear governance thinking. The wrong choice creates either unnecessary costs, security vulnerabilities, or both.

Dataverse Multi-Tenancy: Three Fundamental Models

Enterprise data governance dashboard showing Dataverse multi-tenant architecture with secure data silos and compliance controls

Enterprises typically evaluate three deployment patterns, each with distinct governance and operational implications.

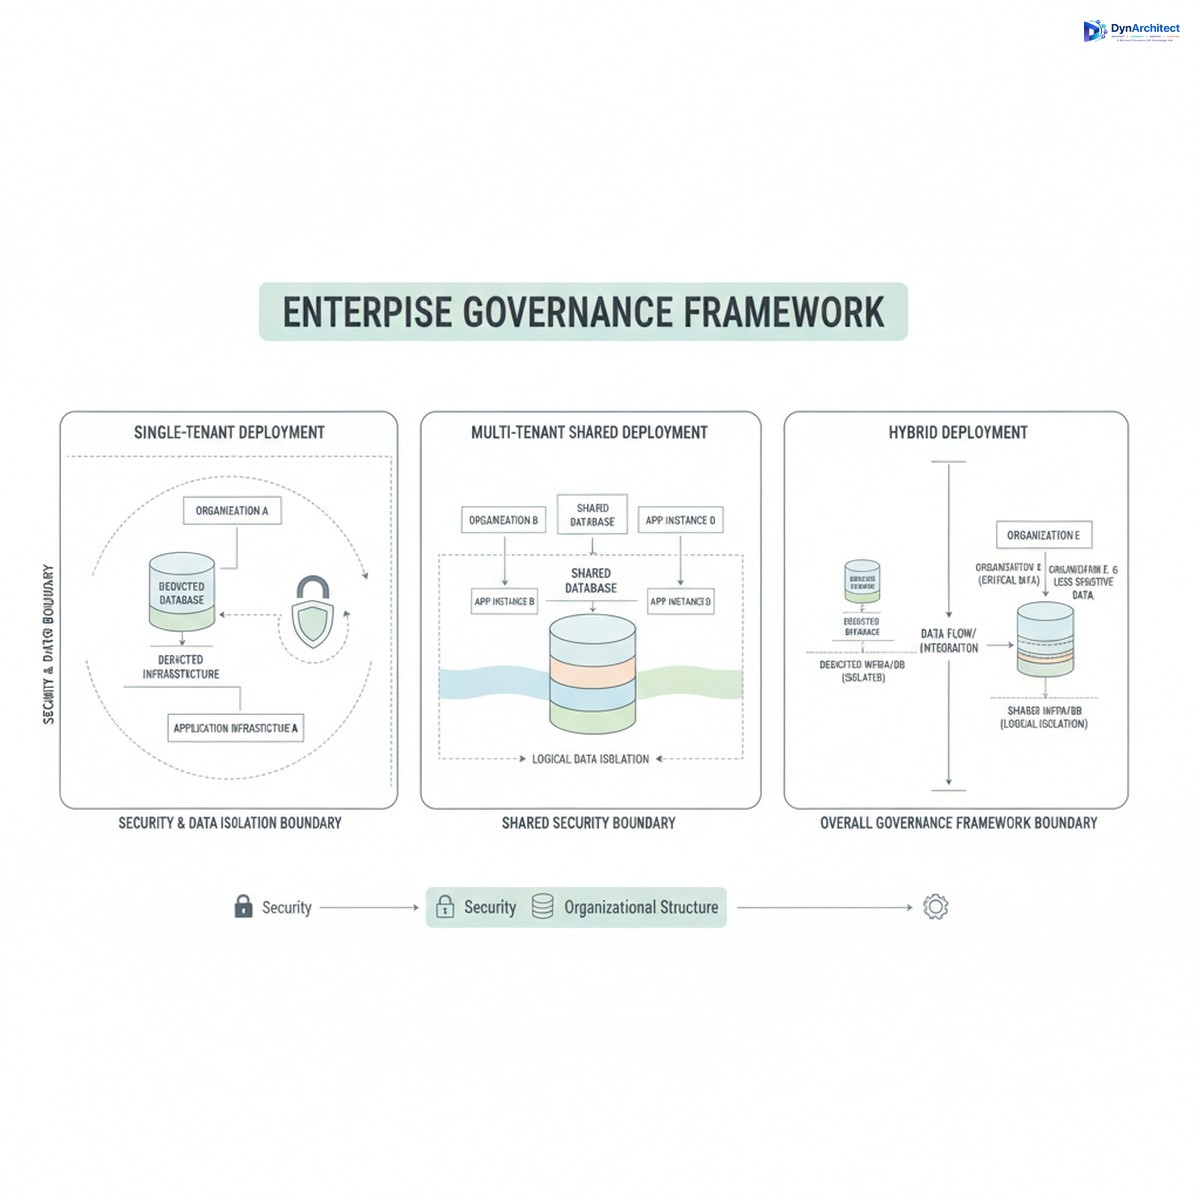
Single-tenant deployment assigns a dedicated Dataverse environment to one business unit or subsidiary. This model simplifies tenant isolation since no shared infrastructure exists by definition. Security boundaries are cleaner. Compliance is straightforward if each tenant operates independently. However, fixed operational costs accrue per environment. Database administration, monitoring, backup, and disaster recovery all require separate infrastructure management. For smaller subsidiaries or regional offices, this overhead becomes difficult to justify financially.

Multi-tenant through shared services consolidates multiple business units into one Dataverse environment. A single application or shared platform manages data for many organizations. The platform itself enforces logical separation through row-level security rules, tenant-scoped data models, and access controls. This dramatically reduces infrastructure costs and operational complexity. A single database serves multiple customers or business units with one support team managing the system. The tradeoff is immediate: the governing application must understand which organization a request belongs to, and that context must remain consistent across every operation, from queries and reports to background jobs and integrations. A single tenant-context error can leak data across organizational boundaries. Compliance teams want evidence that this separation actually works in practice.

Hybrid deployment splits the difference. Some data, like shared employee records or common business reference tables, lives in a truly shared environment. Sensitive or regulated data, integrations requiring stronger isolation, or high-value processes get their own dedicated environments. This approach suits large enterprises with compliance mandates that prohibit certain data sharing while allowing others. It requires governance discipline to maintain two separate data environments and ensure they stay in sync where intended.

The Governance Foundation: Tenant Identity and Isolation

Three tenant deployment models for Dynamics 365 showing single-tenant, multi-tenant shared, and hybrid architectures

Successful multi-tenant deployments rest on one foundational principle: a stable, immutable tenant identifier that serves as the authoritative reference throughout the entire system. This is not the legal entity name, which can change. Not the region code, which can be reorganized. It is a stable, globally unique identifier assigned once to each tenant and never changed.

That identifier must flow consistently through every data operation. Row-level security rules check it to filter records. Integration service calls include it to route data to the correct tenant. Batch jobs and background processing reference it to ensure work stays within tenant boundaries. Logging systems tag every action with it. Reporting queries filter by it. Caching mechanisms key on it. If the tenant context becomes inconsistent anywhere in the system, separation breaks.

Compliance teams increasingly demand evidence that this separation actually works. That evidence includes tenant-attributed logging showing what data each tenant accessed and when, deletion verification confirming that removed records do not appear in other tenants’ data, and incident response procedures demonstrating how the organization would investigate suspected data leakage. Testing tenant isolation is no longer optional for regulated industries.

Governance Structures and Organizational Alignment

Multi-tenant governance requires clear organizational decision-making. Large enterprises typically establish a steering committee with representation from business unit leaders, compliance, information security, and IT operations. This committee makes decisions about which business units share a tenant, who has administrative access, approval processes for data access changes, and how compliance incidents are escalated.

Role-based access control becomes more complex in multi-tenant systems. A user working for Subsidiary A should never see Subsidiary B’s data, even if they have elevated system permissions. Dataverse security roles, business unit assignments, and column-level security all play a part. But the governing application layer above Dataverse must also respect these boundaries. A sales user from one region should not be able to see pipeline data from a different region through an analytics dashboard, even if the underlying queries are technically able to retrieve that data.

For organizations with strict regulatory requirements, the governance model may include physical separation of sensitive data. Regulated or restricted information remains in a dedicated, single-tenant environment with its own security posture, audit trail, and access controls. Non-sensitive shared data, like product catalogs or employee directories, lives in a shared tenant. This hybrid approach reduces operational costs for non-sensitive data while maintaining compliance for sensitive domains.

Compliance and Risk Management Implications

Multi-tenant Dataverse deployments touch several regulatory and risk areas that executives and compliance officers must address before deployment.

Data residency and sovereignty are the first consideration. Some regulations require data to remain in a specific country or region. A shared Dataverse environment across many business units may violate residency requirements if any tenants must store data outside their home region. The governance decision here may force certain subsidiaries into their own environments regardless of cost.

Data retention and deletion become more complex in multi-tenant systems. When a customer or business unit leaves your organization, their data must be removed completely, with no residual traces in shared systems. Testing this process and documenting it is essential for regulatory audits. Shared environments require proof that deletion actually worked and did not accidentally retain records in caches, backup systems, or logs.

User access and entitlements require clear governance. Who approves data access requests? How do you audit who has access to what? Multi-tenant systems need centralized entitlement management where access decisions can be reviewed, revoked, and traced back to business justifications. Integrating with Microsoft Entra ID and governance tools like privileged access management becomes necessary.

Building the Governance Framework

Successful enterprises start governance planning before they write code or configure Dataverse. The planning phase answers five key questions:

First, which data is truly shared, and which data must stay isolated? Not all data requires separation. Employee directories and organizational reference tables can be safely shared. Customer lists, financial records, and intellectual property need isolation.

Second, what tenant model fits the business? Single-tenant is simplest but most costly. Multi-tenant requires discipline but scales efficiently. Hybrid requires the most planning but may be necessary for compliance.

Third, how will you prove isolation works? Logging, testing, and incident response procedures should be planned upfront, not added later.

Fourth, who owns governance decisions? A clear organizational structure with decision rights prevents delays and conflicting policies.

Fifth, how will you monitor and enforce compliance? Automated controls, regular audits, and incident response playbooks should be part of the initial design, not afterthoughts.

Organizations that move Dataverse without this governance foundation often discover problems after deployment. Reorganizations reveal security gaps. Audits uncover poorly documented access controls. System failures expose incomplete backup strategies. The cost of retrofitting governance after deployment far exceeds the cost of planning correctly upfront.

The Path Forward

Dataverse multi-tenancy is not inherently risky, but it demands deliberate governance planning. Enterprises that treat this as a technical infrastructure decision alone will eventually face compliance violations, security incidents, or costly redesigns. Those that treat it as a governance and organizational design problem, with technical architecture supporting that design, build systems that are secure, compliant, and resilient. The most successful implementations started with governance, not with infrastructure.


About Routeget Technologies: Routeget assists enterprises with Dynamics 365 governance, architecture, and deployment strategy, helping organizations structure multi-tenant environments that balance operational efficiency with compliance requirements.

#DataverseGovernance #MultiTenantArchitecture #DynamicsCompliance #DataverseIsolation #EnterpriseDataStrategy #CloudArchitecture #DataGovernance

Optimizing Power BI Premium Capacity Management: Resource Allocation, Query Performance, and Cost Governance

Power BI Premium capacity management dashboard

Most organizations deploying Power BI Premium start with a single capacity and assume the cloud handles the complexity. Within months, they encounter the same problem: reports that were responsive at launch now run slowly, refresh jobs fail intermittently, and the monthly capacity bill climbs without corresponding value. The issue is rarely that Premium itself is insufficient; it is that few teams understand how Premium actually allocates compute, how to monitor that allocation in real time, and how to design workloads that fit the capacity constraints.

This is a technical guide for BI architects, developers, and capacity administrators who need to build production Power BI environments that deliver consistent performance and predictable costs. We will work through capacity planning, workload isolation, query optimization, and the operational patterns that prevent Premium environments from becoming expensive, unreliable systems.

Understanding Power BI Premium Capacity Architecture

Power BI Premium provides a dedicated cloud resource that isolates your organization’s workloads from the multi-tenant shared capacity used by Pro license users. That isolation is the primary value, but it also introduces responsibility: you now own the capacity planning, performance tuning, and cost management that shared capacity users delegate to Microsoft.

A Premium capacity is measured in compute units called virtual cores, or v-cores, priced in tiers from 1 core upward. Each v-core provides a fixed compute budget allocated across query execution, data refresh, and paginated reporting. The budget refreshes hourly. When workloads exceed that budget, Premium applies throttling: queries slow, refreshes delay or fail, and users experience degradation until the current hour’s budget resets.

This is not a failure mode; it is intentional. The throttling is meant to protect the capacity from runaway queries and ensure consistent service levels across all workloads sharing the same capacity. The problem occurs when capacity is undersized relative to the workload, or when workloads are poorly designed and consume disproportionate resources relative to their value.

Capacity Sizing and Workload Assessment

Build an honest inventory of what will run on the capacity. Most organizations plan around a single “average” workload size, then are shocked when peak usage overwhelms that estimate. A realistic approach profiles three scenarios: peak refresh, peak query, and a mixture of both.

Refresh costs depend on semantic model size, refresh frequency, and incremental refresh strategy. A 10 GB model refreshed hourly demands very different compute than a 1 GB model refreshed daily. Measure actual memory consumption and query duration during a test refresh, then multiply by expected concurrency during peak hours.

Query costs are driven by semantic model size, query complexity, and concurrent users. A simple filtered report consumes far less capacity than complex matrix visuals with millions of cross-filtered cells. DirectQuery and real-time data are more expensive than import mode. The capacity is effectively governed by the least-optimized workload; a single slow dashboard can trigger throttling affecting all operations.

Instrument capacity usage with Power BI’s Metrics app or Admin API, measure actual consumption over a production month, and size to the 95th percentile of observed usage, not the average. Most organizations reduce capacity cost by 20 to 40 percent by simply understanding what they actually use.

Workload Isolation and Semantic Model Design

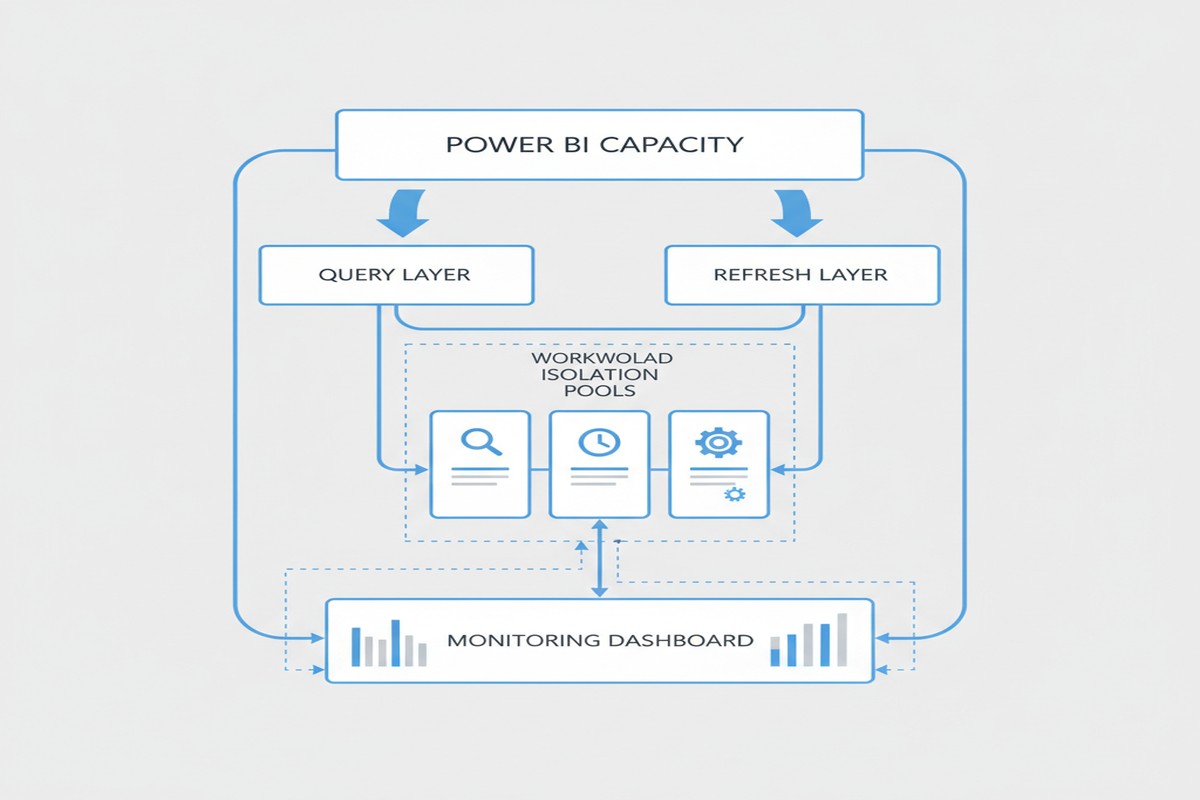
Premium capacity provides a feature called “workload isolation” that allows you to assign different workloads to separate compute pools with independent resource budgets. The most common pattern is to separate refresh workloads from query workloads, or to isolate a single expensive application from the rest of the organization’s reports.

At a technical level, workload isolation is effective because refresh and query operations compete for the same compute and memory on a shared capacity. During peak refresh hours, query performance degrades because the refresh jobs are consuming available vcore budgets. By isolating refresh into a dedicated workload with its own budget, you guarantee that queries will never starve, and vice versa.

Power BI capacity architecture and workload isolation

The decision to isolate workloads depends on whether the cost of isolation (you lose some capacity efficiency by dedicating separate resource pools) is outweighed by the benefit (guaranteed performance for critical queries or refreshes). For most organizations, a single isolated refresh workload is sufficient. Rarely do you need more than two or three workload isolations.

Semantic model design influences capacity efficiency dramatically. A single large model shared across many reports is more efficient than many small, redundant models duplicating the same dimensions and facts. However, large models are harder to maintain, permission, and optimize. Most organizations converge on a “hub-and-spoke” design: a small number of enterprise semantic models (3 to 6) owned by a central BI team, serving as the foundation for business-unit-specific reports and dashboards.

Query Optimization and Real-Time Analysis

Two mechanisms significantly impact capacity consumption: query folding in Power Query and relationship optimization in the semantic model.

Query folding pushes filter and aggregation operations down to the data source rather than pulling all data into Power BI for in-memory filtering. A properly folded query reduces data movement and memory consumption by orders of magnitude. The tradeoff is complexity: folded queries must be executable by the source system, ruling out some Python/R transformations.

For large data volumes or high refresh frequencies, investing in query folding often yields the highest return, reducing refresh time from hours to minutes and freeing up capacity for other workloads.

Relationship optimization includes careful cardinality settings, appropriate many-to-many relationships, and explicit measure branching. A model with thousands of ambiguous relationships forces Power BI to perform expensive relationship resolution on every query. Clean data models with clear relationships and explicit measures are far more efficient.

For real-time scenarios, DirectQuery and Push Datasets lower capacity consumption. DirectQuery queries the source directly but adds latency; the source must respond in hundreds of milliseconds. Push Datasets allow external systems to push data at API speeds, avoiding refresh windows entirely. Both require careful architecture to avoid swamping the data source.

Operational Monitoring and Cost Governance

Premium capacity consumption is measured via the Power BI Admin portal’s Metrics app and the Power BI API, which exposes activity logs and CPU/memory consumption by operation. The Admin API enables custom monitoring dashboards and automated alerting when thresholds are breached.

A mature Premium environment includes automated monitoring for capacity utilization trends, workloads consuming abnormal resources, failed refresh operations, and per-workload cost attribution enabling chargeback.

Governance practices include: quarterly capacity review boards, documented naming standards for models and reports, capacity impact assessment before onboarding new workloads, and performance SLAs backed by monitoring.

Organizations that skip this governance layer often find their Premium environment becomes a black box: costs rise unpredictably and performance degrades without clear cause. Operational tooling and governance practices pay for themselves many times over.

Common Pitfalls and Practical Next Steps

The most common mistakes are: sizing capacity based on theoretical maximum load rather than measured reality, allowing unoptimized queries and large unfolded data imports to run without constraint, mixing enterprise semantic models with personal workloads on the same capacity, and ignoring refresh scheduling and allowing refreshes to overlap.

The path forward is straightforward: measure actual consumption with the Metrics app or Admin API over a production month, document the peak periods and peak workloads, assess which workloads could be optimized with query folding or model redesign, and then right-size the capacity and implement workload isolation for any critically important refresh or query workload. Follow up monthly with utilization reviews and alert on workloads that consume anomalously high resources.

For teams implementing Premium for the first time, a pragmatic starting point is often a single 2 or 4 vcore capacity, one workload isolation for refreshes, and a simple monitoring dashboard tracking hourly utilization. From there, optimization and growth are data-driven: measure, identify bottlenecks, optimize, and only increase capacity when the measured peak approaches the capacity ceiling. Organizations that follow this pattern consistently report 30 to 50 percent lower costs than those that simply throw capacity at performance problems without understanding the underlying workload characteristics.


Routeget Technologies has guided dozens of organizations through Premium capacity design and optimization, from initial sizing through multi-capacity deployments with sophisticated governance. If your Premium environment is facing performance challenges or cost surprises, the root cause is almost always visibility and deliberate design, not capacity limitations.


#PowerBIPremium #CapacityManagement #DataLakeArchitecture #QueryOptimization #PowerBIGovernance #EnterpriseBI #DataEngineering

Building a Sustainable Power Automate Center of Excellence: Governance Without Gridlock

Most organizations that deploy Power Automate do so without any governance structure, then scramble to build one after their citizen developers have created hundreds of inconsistent, poorly monitored automations. The result is predictable: Shadow IT runs deeper, cloud costs spike unpredictably, and IT eventually responds with policies so rigid that the business stops creating new flows and the platform stalls. The tension between speed and control is real, but it does not require choosing one or the other.

A Center of Excellence for Power Automate is simply a structured approach to decision-making: who gets to build flows, what patterns we enforce, how we measure success, and where funding comes from. It is not bureaucracy. It is the difference between a platform that serves business strategy and one that devolves into a cost and compliance liability.

Why Power Automate Centers of Excellence Matter

Before the Cloud, automation meant capital expenditure on licensed tools, IT-owned build processes, and a multi-year return-on-investment narrative. Business units that needed a workflow change submitted requests and waited. Power Automate inverted this model. Individual contributors with no coding background can now build workflows that connect dozens of applications, move data, and execute business logic in minutes rather than months.

This democratization is valuable, but it creates an organizational problem. Without structure, a 500-person organization can quickly accumulate 2,000 flows built by people who do not know about each other’s work, who use different authentication patterns, who log into different cloud environments, and who have no shared understanding of which flows are business-critical versus experimental prototypes. When a flow breaks at 2 a.m. on a Saturday, no one knows why, because the person who built it is no longer with the company. When your automation bill spikes 40% month over month, you cannot explain why, because no one is tracking flow execution patterns.

A CoE provides visibility, standardization, and accountability without becoming an approval bottleneck. It articulates the expectations around flow design, security, data governance, and cost management so that developers can move quickly and IT can sleep at night.

Organizational Structure: Three Patterns That Work

The most effective CoE structures share a common shape: a small central team responsible for standards, enablement, and governance; a distributed network of power users embedded within business units; and clear escalation paths from edge to center.

The central team should be small, typically two to four people, depending on organization size. Its role is not to build flows for every department, but to establish patterns, mentor citizen developers, and make the hard calls when conflicts arise. The team member should come from IT but ideally have business acumen—someone who understands both technical architecture and why the business cares about a given workflow. This role often seats best as a product manager rather than a pure engineer, since the job is as much about communication and change management as it is about technical decisions.

Distributed power users are the actual force multiplier. These are individuals in Finance, Operations, Sales, or HR who have invested time learning Power Automate deeply and can build flows, mentor peers, and serve as the first line of triage when flows behave unexpectedly. Organizations often resist this approach because it seems to decentralize control, but experience shows the opposite. When power users exist within their own departments, flows get built faster, are maintained more reliably, and align better with business context because the builder is embedded in the problem domain. The CoE provides training, sets standards, and holds power users accountable to those standards, but does not make them beg for permission.

Escalation paths matter. If a power user wants to build a flow that touches sensitive financial data, or that orchestrates changes across multiple critical systems, the CoE should have a clear, lightweight process to evaluate the design and approve the build. This is not a veto gate; it is a collaborative design review. Most escalations resolve quickly because the CoE can flag real risks (poor error handling, missing audit trails, data loss exposure) and guide the builder toward a more robust solution. The business gets its flow, and IT maintains reasonable confidence in the architecture.

Governance Framework: Standards Without Bureaucracy

Power Automate governance typically fails in one of two directions: it is either too loose (anything goes, leading to chaos), or too tight (everything requires approval, leading to workarounds). A functional governance framework sits between these poles.

Start with flow taxonomy. Define three categories: production flows (business-critical, require naming conventions and documentation), standard flows (departmental automations that follow company patterns but do not require escalation), and experimental flows (one-off tests and prototypes, deleted after 90 days if not promoted to production). This simple taxonomy lets developers understand expectations immediately and lets IT focus oversight where it matters most.

Establish naming and documentation standards. This sounds bureaucratic but solves real problems. A flow named “P001” tells you nothing. A flow named “Sales-QuoteApproval-VP” immediately tells you the business domain, the function, and the approval level. When a developer checks the existing flows, they can find related work and avoid duplication. When you need to disable a set of flows for maintenance, you can identify all related ones quickly. Documentation templates (one sentence describing what the flow does, the owner contact, the systems it touches) take five minutes to complete and dramatically reduce the knowledge burden when the builder leaves the company.

Data governance rules must be specific to your risk profile. Most organizations should establish: flows that touch Dynamics 365 Finance or HR systems must use managed identities and log all operations to an audit table; flows that create, update, or delete records in any production environment must include error handling and notification to the flow owner on failure; flows that move data between systems must encrypt data in transit and log the data movement event; flows that exceed 50 executions per day should be reviewed quarterly to confirm they still provide business value. These rules are not arbitrary IT gatekeeping; they reflect the business’s real exposure to data loss, compliance violations, and cost overruns.

Funding and Stakeholder Alignment

A CoE that must justify its existence through a departmental budget burns out quickly. Instead, embed the cost in the automation project’s business case. When Finance proposes an automation that will save a manual process, the total cost of ownership includes the CoE’s contribution: the design review, the mentoring, the platform licensing, the monitoring and ongoing optimization. This aligns incentives. If the CoE is too restrictive or slow, the business unit pushes back and the executive sponsor hears about it. If the CoE is too permissive and allows bad automations to proliferate, the operations team sees costs rise and demands better governance.

Create a steering committee that meets quarterly, including representatives from major business units, IT leadership, finance, and compliance. This committee reviews CoE performance (how many flows, what categories, cost per automation), approves new platform features or tool purchases, and arbitrates any major policy changes. This keeps the CoE accountable and prevents it from becoming an insular IT function that loses touch with business needs.

Measuring Success

Set metrics that matter. Track the number of production flows, the average time to build a flow once it is approved, the ratio of successful executions to failures, and the cost per automation. More importantly, survey power users and business unit leaders annually on whether Power Automate is enabling them or creating friction.

A CoE that has reduced flow-creation cycle time from eight weeks (under an old IT process) to three days and has achieved 99.5% execution reliability is delivering value even if it has not eliminated every risk. The point is not perfection; it is enabled business agility coupled with acceptable risk.

Common Pitfalls

Organizations often stumble on a few predictable mistakes. The first is creating a CoE without giving it authority. If the central team cannot enforce naming standards or require design reviews, it becomes an advisory body that developers ignore, and you have gained nothing except an extra cost center. The second is over-investing in tooling before you have clarity on the actual problem. Buy governance software only after you understand what you are trying to govern; often a simple spreadsheet and a SharePoint site suffice. The third is confusing CoE with “IT approval committee.” Governance should be about patterns and risk management, not about gating every creative idea because IT wants to be in control. If a power user’s approach is sound but unconventional, approve it and monitor it; do not reject it because it does not match a template.

Finally, do not neglect the change management dimension. If your organization has relied on Shadow IT for years, a CoE that suddenly requires visibility into all flows will face resistance. Plan for a communication campaign, early wins that demonstrate the value of transparency, and meaningful involvement of power users in CoE decisions from the start.

Moving Forward

Building a Center of Excellence for Power Automate is not a one-time project; it is an organizational capability that evolves as the platform matures. Start by identifying your central team and your first set of power users. Define basic standards around flow naming, documentation, and data handling. Establish your escalation path for production flows. Monitor adoption, cost, and execution reliability. Adjust based on what you learn.

Organizations that take this approach typically report that Power Automate adoption accelerates within six months, not because governance is loose, but because developers know the expectations and can move with confidence. Costs become predictable because you understand what is running and why. And the platform becomes a genuine strategic asset rather than a shadow IT liability.

Routeget Technologies has implemented Power Automate Centers of Excellence for financial services, healthcare, and manufacturing clients, and the patterns that work remain consistent: clear governance that focuses on risk and enablement rather than control; distributed power users who are vested in the business outcome; and a small central team that removes obstacles and sets standards rather than approving every decision. The structure is less important than the commitment to treat Power Automate as a managed platform rather than a free-for-all tool.

#PowerAutomateCOE #FlowGovernance #LowCodeGovernance #ProcessAutomation #AutomationStrategy #EnterpriseAutomation

Implementing Predictive Lead Scoring in Dynamics 365 Sales: Technical Architecture and Model Training

Sales organizations face a persistent challenge: most leads that enter the pipeline lack sufficient qualification signals, forcing sales teams to invest time and resources pursuing prospects with poor conversion odds. Rule-based lead scoring—manual point assignments for job title, company size, or email opens—falls apart at scale, especially when customer engagement patterns across multiple touchpoints remain isolated in separate systems. The result is wasted effort and extended sales cycles.

Dynamics 365 Sales offers native integration with AI Builder, which enables development teams to build predictive lead scoring models trained on historical customer engagement data within the platform. Unlike black-box SaaS solutions that require data export and integration overhead, this approach keeps customer data within your Dynamics 365 boundary, maintains compliance with data governance policies, and surfaces predictions directly in the sales interface where they influence deal qualification and prioritization decisions. Building and deploying a production predictive model requires understanding how to structure training data, configure model parameters, evaluate model performance, and integrate scoring results back into the sales workflow.

Structuring Data for Predictive Model Training

Predictive lead scoring models rely on historical examples of leads that converted versus those that did not. AI Builder requires a minimum of 100 historical examples in your training dataset, though 500 to 1,000 examples typically produce more stable, generalizable models. You must first decide which entity will serve as your training target. Most implementations use the Lead entity itself (marking leads as qualified or disqualified) or the Opportunity entity (marking won versus lost deals). The decision hinges on your business process: if you qualify and convert leads to opportunities separately, train on the Opportunity entity to capture conversion likelihood; if you operate a lead-only model, train on the Lead entity with a binary outcome field (for example, “Lead Status” with values “Qualified” or “Disqualified”).

Once you select your training target, identify the feature columns (predictive variables) that your model will use. These typically include demographic attributes (company industry, company size, lead source), behavioral signals (number of emails opened from marketing campaigns, days since last engagement, number of form submissions), and engagement frequency metrics (contact attempts, phone call outcomes). The model works best when features represent actual customer interactions or attributes that vary meaningfully between converted and unconverted leads. Avoid including target-correlated features (for example, do not include “Deal Closed” as a feature when trying to predict deal closure, since this creates circular reasoning).

Preparing and Configuring the Prediction Model

Within Dynamics 365 Sales, navigate to AI Builder and select “Binary Prediction” (a classification model that predicts one of two outcomes, such as “will convert” or “will not convert”). Upload your training dataset by pointing AI Builder to the entity containing your historical lead or opportunity records. The system automatically detects columns, infers data types, and suggests features. You must then map the target column (the outcome you want to predict) and select which additional columns should be used as features. AI Builder’s interface allows you to include or exclude specific columns; exclude highly correlated columns, columns with sparse data (more than 50 percent missing values), and columns that lack predictive power (for example, internal notes fields that contain unstructured text).

Configure model parameters by specifying the threshold at which the model will classify a lead as “high likelihood to convert.” By default, AI Builder uses 0.5 (50 percent) as the decision boundary, meaning the model must predict a probability of at least 0.5 for the lead to be marked as high-scoring. In practice, you may want to lower this threshold to catch more potential deals (increasing recall at the cost of some false positives) or raise it to be more conservative (increasing precision at the cost of missing some opportunities). Your choice depends on your sales process: if your team has capacity to follow up on all leads, a lower threshold catches more opportunities; if your team is constrained, a higher threshold focuses effort on the most promising leads.

Evaluating Model Quality and Performance

Before deploying a model to production, evaluate its performance using standard classification metrics. AI Builder provides precision, recall, F1 score, and AUC (area under the receiver operating characteristic curve) after training. Precision measures the proportion of predicted high-scoring leads that actually convert; recall measures the proportion of actual converts that the model correctly identified as high-scoring. Aim for a balanced combination: a model with high precision but low recall catches few opportunities, while a model with high recall but low precision floods your team with low-probability leads. The F1 score (harmonic mean of precision and recall) offers a single metric summarizing this balance. An AUC above 0.7 generally indicates useful discrimination; above 0.8 indicates strong model quality.

Importantly, evaluate your model on held-out test data (records not used during training), not on the training set itself. AI Builder automatically splits your dataset for this purpose. If your model performs well on training data but poorly on test data, your model may be overfitting to noise in the training set; in this case, simplify the model by removing non-predictive features or retraining with more diverse historical examples.

Integrating Scoring Results into Sales Workflows

Once your model passes quality checks and you publish it to production, integrate the scoring results into your sales process. AI Builder allows you to invoke the model on demand via a Power Automate cloud flow or as a plug-in on the Lead or Opportunity form. The most common pattern is a Power Automate cloud flow triggered when a lead is created, which calls the prediction model, captures the predicted probability and classification, and updates a custom “Predicted Score” column on the lead record. This score then becomes available in lead views, pipeline analytics, and mobile applications.

From a user experience perspective, surface the predicted score prominently on the sales dashboard and lead detail form so sales reps see the qualification confidence at a glance. Many organizations color-code leads based on predicted score (green for high probability, yellow for medium, red for low) to guide qualification decisions. Some teams implement a business rule that automatically assigns high-scoring leads to senior reps and routes low-scoring leads to junior reps for initial outreach, thereby optimizing resource allocation based on deal likelihood.

Monitoring Model Drift and Retraining

Predictive models do not remain accurate indefinitely. As your sales process evolves, customer behavior changes, or market conditions shift, the patterns your model learned during training may no longer reflect current conditions (a phenomenon called model drift). Set a quarterly or semi-annual schedule to assess model performance on recent data. If accuracy metrics decline by more than 5 to 10 percent compared to the original test results, retrain the model on a fresh dataset that includes recent leads and opportunities. AI Builder enables retraining as a straightforward operation: select the published model, update the training dataset to include new records, and republish.

Document your model’s feature importance (which inputs the model weights most heavily) so your organization understands what drives scoring decisions. AI Builder provides a feature importance report showing which columns contribute most to the model’s predictions. If your model places high importance on a feature that represents potential data quality issues (for example, “Days Since Last Email” if email tracking is inconsistent), address the data quality problem to improve future model iterations.

Common Pitfalls and Practical Guidance

A frequent mistake is training a model on imbalanced data, where one outcome (for example, “converted”) is much rarer than the other. If 80 percent of your historical leads did not convert, the model may learn to simply predict “no conversion” for all leads, achieving high accuracy but zero business value. To address this, explicitly configure class weights in your training setup (telling the model that conversions should be weighted more heavily) or oversample the minority class during data preparation.

Another pitfall is treating the model as a black box. Sales leaders sometimes interpret predicted scores as absolute probabilities rather than relative rankings. Communicate clearly that a predicted score of 0.8 does not mean “this lead has an 80 percent chance to close”; it means the model ranks this lead among the highest-probability prospects relative to others in your pipeline. The model’s value lies in comparative ranking and resource allocation, not in absolute probability estimation.

Finally, involve your sales leadership and operations team in model design and interpretation. If your organization has complex sales processes (for example, different qualification rules for enterprise deals versus mid-market deals), consider building separate models for each segment rather than a single global model. Similarly, if significant changes occur (a major product launch, a shift in target customer, an acquisition), retrain your model on data that reflects these new conditions.

Conclusion

Predictive lead scoring powered by AI Builder and native Dynamics 365 integration transforms how sales teams allocate effort and prioritize opportunities. By systematically capturing historical conversion patterns and translating them into forward-looking probability estimates, your organization gains visibility into which prospects justify investment and which may be better pursued later. The technical implementation is straightforward for most organizations: structure historical lead and opportunity data, configure an AI Builder classification model, evaluate performance on test data, and integrate results through Power Automate and the sales interface. Retraining quarterly and involving sales leadership in model governance ensures your scoring system remains effective as market conditions and customer behavior evolve. Routeget Technologies has deployed predictive lead scoring across dozens of Dynamics 365 Sales implementations, helping organizations increase pipeline accuracy and accelerate sales velocity through data-driven qualification.

#PredictiveLeadScoring #AIBuilderDynamics365 #SalesIntelligence #DynamicsSalesAI #CustomerInsights #PredictiveAnalytics #SalesEnablement #DynamicsImplementation #EnterpriseAI #SalesDataStrategy

Implementing Predictive Lead Scoring in Dynamics 365 Sales: Technical Architecture and Model Training

Sales organizations face a persistent challenge: most leads that enter the pipeline lack sufficient qualification signals, forcing sales teams to invest time and resources pursuing prospects with poor conversion odds. Rule-based lead scoring—manual point assignments for job title, company size, or email opens—falls apart at scale, especially when customer engagement patterns across multiple touchpoints remain isolated in separate systems. The result is wasted effort and extended sales cycles.

Dynamics 365 Sales offers native integration with AI Builder, which enables development teams to build predictive lead scoring models trained on historical customer engagement data within the platform. Unlike black-box SaaS solutions that require data export and integration overhead, this approach keeps customer data within your Dynamics 365 boundary, maintains compliance with data governance policies, and surfaces predictions directly in the sales interface where they influence deal qualification and prioritization decisions. Building and deploying a production predictive model requires understanding how to structure training data, configure model parameters, evaluate model performance, and integrate scoring results back into the sales workflow.

**Structuring Data for Predictive Model Training**

Predictive lead scoring models rely on historical examples of leads that converted versus those that did not. AI Builder requires a minimum of 100 historical examples in your training dataset, though 500 to 1,000 examples typically produce more stable, generalizable models. You must first decide which entity will serve as your training target. Most implementations use the Lead entity itself (marking leads as qualified or disqualified) or the Opportunity entity (marking won versus lost deals). The decision hinges on your business process: if you qualify and convert leads to opportunities separately, train on the Opportunity entity to capture conversion likelihood; if you operate a lead-only model, train on the Lead entity with a binary outcome field (for example, “Lead Status” with values “Qualified” or “Disqualified”).

Once you select your training target, identify the feature columns (predictive variables) that your model will use. These typically include demographic attributes (company industry, company size, lead source), behavioral signals (number of emails opened from marketing campaigns, days since last engagement, number of form submissions), and engagement frequency metrics (contact attempts, phone call outcomes). The model works best when features represent actual customer interactions or attributes that vary meaningfully between converted and unconverted leads. Avoid including target-correlated features (for example, do not include “Deal Closed” as a feature when trying to predict deal closure, since this creates circular reasoning).

**Preparing and Configuring the Prediction Model**

Within Dynamics 365 Sales, navigate to AI Builder and select “Binary Prediction” (a classification model that predicts one of two outcomes, such as “will convert” or “will not convert”). Upload your training dataset by pointing AI Builder to the entity containing your historical lead or opportunity records. The system automatically detects columns, infers data types, and suggests features. You must then map the target column (the outcome you want to predict) and select which additional columns should be used as features. AI Builder’s interface allows you to include or exclude specific columns; exclude highly correlated columns, columns with sparse data (more than 50 percent missing values), and columns that lack predictive power (for example, internal notes fields that contain unstructured text).

Configure model parameters by specifying the threshold at which the model will classify a lead as “high likelihood to convert.” By default, AI Builder uses 0.5 (50 percent) as the decision boundary, meaning the model must predict a probability of at least 0.5 for the lead to be marked as high-scoring. In practice, you may want to lower this threshold to catch more potential deals (increasing recall at the cost of some false positives) or raise it to be more conservative (increasing precision at the cost of missing some opportunities). Your choice depends on your sales process: if your team has capacity to follow up on all leads, a lower threshold catches more opportunities; if your team is constrained, a higher threshold focuses effort on the most promising leads.

**Evaluating Model Quality and Performance**

Before deploying a model to production, evaluate its performance using standard classification metrics. AI Builder provides precision, recall, F1 score, and AUC (area under the receiver operating characteristic curve) after training. Precision measures the proportion of predicted high-scoring leads that actually convert; recall measures the proportion of actual converts that the model correctly identified as high-scoring. Aim for a balanced combination: a model with high precision but low recall catches few opportunities, while a model with high recall but low precision floods your team with low-probability leads. The F1 score (harmonic mean of precision and recall) offers a single metric summarizing this balance. An AUC above 0.7 generally indicates useful discrimination; above 0.8 indicates strong model quality.

Importantly, evaluate your model on held-out test data (records not used during training), not on the training set itself. AI Builder automatically splits your dataset for this purpose. If your model performs well on training data but poorly on test data, your model may be overfitting to noise in the training set; in this case, simplify the model by removing non-predictive features or retraining with more diverse historical examples.

**Integrating Scoring Results into Sales Workflows**

Once your model passes quality checks and you publish it to production, integrate the scoring results into your sales process. AI Builder allows you to invoke the model on demand via a Power Automate cloud flow or as a plug-in on the Lead or Opportunity form. The most common pattern is a Power Automate cloud flow triggered when a lead is created, which calls the prediction model, captures the predicted probability and classification, and updates a custom “Predicted Score” column on the lead record. This score then becomes available in lead views, pipeline analytics, and mobile applications.

From a user experience perspective, surface the predicted score prominently on the sales dashboard and lead detail form so sales reps see the qualification confidence at a glance. Many organizations color-code leads based on predicted score (green for high probability, yellow for medium, red for low) to guide qualification decisions. Some teams implement a business rule that automatically assigns high-scoring leads to senior reps and routes low-scoring leads to junior reps for initial outreach, thereby optimizing resource allocation based on deal likelihood.

**Monitoring Model Drift and Retraining**

Predictive models do not remain accurate indefinitely. As your sales process evolves, customer behavior changes, or market conditions shift, the patterns your model learned during training may no longer reflect current conditions (a phenomenon called model drift). Set a quarterly or semi-annual schedule to assess model performance on recent data. If accuracy metrics decline by more than 5 to 10 percent compared to the original test results, retrain the model on a fresh dataset that includes recent leads and opportunities. AI Builder enables retraining as a straightforward operation: select the published model, update the training dataset to include new records, and republish.

Document your model’s feature importance (which inputs the model weights most heavily) so your organization understands what drives scoring decisions. AI Builder provides a feature importance report showing which columns contribute most to the model’s predictions. If your model places high importance on a feature that represents potential data quality issues (for example, “Days Since Last Email” if email tracking is inconsistent), address the data quality problem to improve future model iterations.

**Common Pitfalls and Practical Guidance**

A frequent mistake is training a model on imbalanced data, where one outcome (for example, “converted”) is much rarer than the other. If 80 percent of your historical leads did not convert, the model may learn to simply predict “no conversion” for all leads, achieving high accuracy but zero business value. To address this, explicitly configure class weights in your training setup (telling the model that conversions should be weighted more heavily) or oversample the minority class during data preparation.

Another pitfall is treating the model as a black box. Sales leaders sometimes interpret predicted scores as absolute probabilities rather than relative rankings. Communicate clearly that a predicted score of 0.8 does not mean “this lead has an 80 percent chance to close”; it means the model ranks this lead among the highest-probability prospects relative to others in your pipeline. The model’s value lies in comparative ranking and resource allocation, not in absolute probability estimation.

Finally, involve your sales leadership and operations team in model design and interpretation. If your organization has complex sales processes (for example, different qualification rules for enterprise deals versus mid-market deals), consider building separate models for each segment rather than a single global model. Similarly, if significant changes occur (a major product launch, a shift in target customer, an acquisition), retrain your model on data that reflects these new conditions.

**Conclusion**

Predictive lead scoring powered by AI Builder and native Dynamics 365 integration transforms how sales teams allocate effort and prioritize opportunities. By systematically capturing historical conversion patterns and translating them into forward-looking probability estimates, your organization gains visibility into which prospects justify investment and which may be better pursued later. The technical implementation is straightforward for most organizations: structure historical lead and opportunity data, configure an AI Builder classification model, evaluate performance on test data, and integrate results through Power Automate and the sales interface. Retraining quarterly and involving sales leadership in model governance ensures your scoring system remains effective as market conditions and customer behavior evolve. Routeget Technologies has deployed predictive lead scoring across dozens of Dynamics 365 Sales implementations, helping organizations increase pipeline accuracy and accelerate sales velocity through data-driven qualification.

#PredictiveLeadScoring #AIBuilderDynamics365 #SalesIntelligence #DynamicsSalesAI #CustomerInsights #PredictiveAnalytics #SalesEnablement #DynamicsImplementation #EnterpriseAI #SalesDataStrategy

Data Loss Prevention Policy Implementation in the Microsoft Cloud: Balancing Security and Business Agility

Enterprise data governance dashboard showing Data Loss Prevention policies and security classifications

Data Loss Prevention Policy Implementation in the Microsoft Cloud: Balancing Security and Business Agility

Most IT leaders inherit DLP implementations that operate as expensive friction generators—slow approval workflows, frustrated business units, widespread policy exceptions—rather than effective data protection. The challenge isn’t building DLP capability; it’s building DLP that actually works in practice without crippling business operations.

Dynamics 365, Power Platform, and the broader Microsoft cloud stack move data at volume and velocity that traditional perimeter security cannot monitor. Spreadsheets with customer data flow through Power Automate workflows. Finance teams share GL account details via Teams. Sales consultants upload competitor files to Power Apps. Without intentional DLP governance, sensitive information leaks become statistical inevitability. Yet overly rigid DLP policies drive shadow IT and workarounds that are far less controlled.

Microsoft cloud security architecture showing Dataverse environments with DLP policy layers and data classification zones

The tension is real: organizations need DLP policies that reduce breach risk and meet compliance requirements without triggering business user revolt. That balance comes from a three-layer approach starting with clear data classification, moving to segmented policy enforcement by workload, and ending with monitoring and exception workflows that catch real breaches without generating approval fatigue.

Understanding Microsoft Dataverse and Power Platform Data Classification

DLP in Microsoft Power Platform starts with a deceptively simple question: what data sensitivity level is stored in this Dataverse environment, and what external services should or should not have access to it?

Every Dataverse environment has an assigned DLP classification set by administrators. Out of the box, the options are “Business” (default), “Non-Business,” and “Unclassified,” each restricting which connectors can be used. An environment marked “Business” cannot call consumer-grade cloud services or public APIs by default. This classification system is the foundation of Power Platform DLP, and many organizations accept it unchanged. That is a mistake.

The actual tension surfaces immediately: a “Business” environment using default DLP classification prevents organizations from using essential connectors. A finance team might need to integrate Power Apps with Stripe for payment processing. A supply chain team needs logistics APIs to track shipments. A sales team needs to send customer records to third-party analytics services. These connectors fall outside default Business classification rules, but blocking them outright prevents legitimate business operations. Conversely, loosening policies to allow these services introduces real data exposure risk—customer payment details flowing to external processors without oversight.

Solving this tension requires abandoning the one-size-fits-all “Business” classification and instead segmenting Dataverse environments by actual data sensitivity and connector requirements. This segmentation becomes the policy framework that supports DLP without strangling innovation.

Segmenting Dataverse Environments by Sensitivity and Connector Requirement

Organizations that manage DLP effectively typically operate multiple Dataverse environments, each with a distinct DLP classification matched to the data sensitivity and connector requirements it actually holds.

Consider a typical enterprise structure: one environment holds Dynamics 365 Finance and Operations data (accounting records, GL accounts, intercompany transactions, supplier information). This is genuinely sensitive data subject to audit requirements and regulatory controls. This environment should be classified as “Business” under a restrictive DLP policy that prevents connectors to external consumer services, cloud file storage, or public APIs. Finance teams access this data through specifically designed Power Apps and Power Automate workflows within DLP constraints.

A second environment holds Power Apps and Power Automate flows that integrate Power Platform with external partner systems—logistics APIs, payment processors, analytics services, and public cloud connectors. This environment accepts connectors to these external services because data sensitivity and use case require it. However, no direct connection to the sensitive Finance and Operations environment is allowed. This environment operates under less restrictive DLP classification because data flowing through it is either lower sensitivity (customer feedback, survey responses, transaction history) or appropriately scoped to external partners.

A third environment is explicitly designated for proof-of-concept work and rapid prototyping. DLP is minimal here because solutions graduate to production environments with full governance only after validation and security review.

This segmentation approach solves the core tension: business users get connector freedom they need, but that freedom is appropriately scoped to environments holding data at the sensitivity level those connectors can safely access. A payment processor connector in the production environment holding Finance data would be irresponsible. The same connector in an e-commerce environment is reasonable.

Implementing Segmented DLP Without Over-provisioning

Segmentation only works when combined with clear governance over which data moves between environments and under what conditions. An organization running multiple Dataverse environments without data movement controls creates the worst outcome: complex DLP policies that block internal workflows and fail to prevent the very data exposure they were meant to restrict.

Governance begins with explicit data classification at the Dataverse table level. Every table in Finance and Operations environments should be tagged as “Highly Sensitive” (GL accounts, supplier data, payroll), “Internal” (historical transactions, internal metadata), or “Public” (product catalogs, customer-facing data). That classification becomes enforceable through data loss prevention rules: a table tagged “Highly Sensitive” cannot be queried by Power Automate flows in non-Business environments. This discipline prevents accidental sensitive data exposure through incorrectly scoped flows.

Second, organizations need exception workflows that actually work. Some business processes require sensitive data to flow to external systems. A customer requesting data export needs records to move outside the enterprise. A third-party audit requires financial table access. Building manual exception workflows—where business stakeholders request exceptions and security reviews them—turns DLP into a shared responsibility. Exception tracking also provides visibility into actual risk: organizations seeing hundreds of requests for sensitive data access learn something valuable about their risk profile.

Monitoring, Alerts, and Real-Time Response

DLP policy design matters, but enforcement and monitoring matter more. An organization with well-designed DLP policies but no monitoring ends up with policies that are either unenforced or inconsistently applied.

Microsoft Dataverse and Power Platform generate audit logs of DLP violations, but by default those logs are difficult to access in real time. Organizations that manage DLP effectively set up automated monitoring through Azure Monitor or Microsoft Sentinel, translating Dataverse audit logs into actionable alerts. A spike in violations from a specific user, a flow attempting repeated queries of sensitive tables, or patterns suggesting data exfiltration should generate alerts that security teams investigate within hours.

Real-time response capability is the difference between DLP as theoretical control and actual protection. When monitoring detects suspicious patterns, the ability to immediately disable Power Automate flows, revoke access to specific environments, or restrict Dataverse tables can interrupt a breach in progress. Without response capability, DLP monitoring is largely forensic—useful for understanding what happened after detection, not for preventing breaches.

Moving Forward: From DLP Compliance Theater to Actual Data Protection

DLP policy implementation is not a one-time project. Organizations that maintain effective data protection continuously adjust policies based on new business processes, security incidents that expose gaps, and platform evolution.

The organizations that manage this effectively treat DLP policy design as a shared responsibility across security, compliance, and business leadership. Policies are transparent—business stakeholders understand constraints and when exceptions can be requested. Exceptions are tracked regularly, signaling whether policies are appropriately calibrated. Monitoring is continuous and actionable, giving security teams real-time visibility into whether DLP policies actually protect data or just generate friction.

When these elements align, DLP stops being a security checkbox and becomes a capability that genuinely reduces sensitive data exposure risk without strangling business operations that depend on data movement and integration.

At Routeget Technologies, we have implemented data loss prevention governance across Dynamics 365 and Power Platform deployments in organizations ranging from mid-market to enterprise. Our approach begins with your current data sensitivity landscape and connector requirements, then builds segmented DLP policies and monitoring infrastructure that protect what matters most while enabling the business agility your teams need.

#DLPGovernance #DataLossPrevention #CloudSecurity #DynamicsCloudArchitecture #PowerPlatformGovernance #DataProtection #ComplianceAutomation #Dynamics365Security #MicrosoftDataverse #EnterpriseCloudGovernance