Consolidating Customer Intelligence: How Dynamics 365 Customer Data Platform Transforms Sales Pipeline Visibility and Revenue Forecasting

Your sales team operates across fragmented data sources. Pipeline data lives in the CRM. Customer account history sits in a separate system. Communication touchpoints scatter across email, Teams, and LinkedIn. Finance holds contract and payment data. The result is predictable: deal visibility remains partial, forecasting depends on gut feel rather than complete customer context, and sales reps waste cycles hunting information instead of closing deals. This fragmentation costs money. It slows deal progression. It creates forecast errors that ripple into quarterly results.

The underlying problem is not tool proliferation—it’s that modern selling requires a unified understanding of each customer that no single application delivers on its own. This is where Dynamics 365’s Customer Data Platform (CDP) capabilities enter the picture. The CDP layer consolidates disparate customer records, interactions, and context into a single coherent view, giving sales and finance teams the integrated information they need to execute reliably.

Understanding the CDP Layer in Dynamics 365

Dynamics 365 includes customer data management functionality built directly into Customer Insights (formerly Dynamics 365 for Customer Insights), which integrates tightly with Sales, Finance, and Operations. This CDP capability differs from third-party CDP platforms because it starts with enterprise transaction data already flowing through your Dynamics ecosystem, rather than attempting to ingest and map data from external sources. The practical benefit: implementation complexity drops, data quality improves because you’re working with source records you already own, and the unified customer view connects back to operational systems without middleware translation layers.

The CDP ingests records from multiple origins: Dynamics 365 Sales accounts and contacts, historical transaction data from Finance and Operations, marketing interaction data from automated campaigns, customer service interaction logs, Azure Data Lake connections for external data sources if needed, and real-time activity feeds from Teams or other collaboration tools your team uses. These records flow through entity mapping and deduplication logic (matching logic that identifies when two records represent the same real-world customer despite different IDs across systems), then resolve into unified customer profiles. Each unified profile becomes queryable and actionable within Sales, Finance, and Operations applications. This unified profile is what changes how your sales and finance functions operate.

How Unified Customer Profiles Impact Sales Execution

Consider a tangible scenario. A sales rep is preparing for a renewal discussion with a mid-market customer. Today, the rep opens the opportunity record in Dynamics 365 Sales and sees contract value and contract end date. To understand the customer’s actual spend across the organization, the rep must open a separate Finance portal to check accounts payable and payment history. To understand what support issues the customer has logged, the rep logs into Service separately. To understand whether this customer recently attended a product webinar or downloaded content, the rep logs into a separate marketing system. By the time the rep assembles this picture, an hour has passed. Worse, details often get missed because the rep doesn’t know which systems to check.

With Customer Data Platform unification, the rep’s unified customer profile surfaces all this context—recent transaction history, open support cases, known business issues, prior interactions, marketing engagement, and contract renewal dates—in a single pane. The context is there when the rep opens the account record. This changes the tone of the renewal conversation. The rep arrives prepared, knows what matters to the customer, and can propose relevant solutions rather than generic upgrades. Renewal close rates improve. Contract values increase because the rep understands the customer’s full operational context and can pitch solutions that address known pain points.

For finance and sales leadership, the same unified data improves forecast accuracy. CFOs and Sales VPs rely on accurate pipeline forecasting to guide capital allocation and operational planning. Yet pipeline forecasts built from incomplete customer context tend to be overoptimistic (reps weight deals more heavily than customer context supports) or miss risks (a customer with chronic payment issues or support problems may be churning despite apparently healthy active contracts). With complete customer history—including payment patterns, support escalations, prior upsells, and customer health scores—finance and sales can calibrate forecasts more accurately and identify deals at risk before they stall or slip.

The Enablement Challenge: From Unified Data to Behavioral Change

Consolidating data is the technical step. Driving adoption is where most organizations stumble. Sales reps trained on the old approach often continue checking separate systems by habit. Finance teams accustomed to a specific reporting layout may not immediately recognize the productivity gains available through the unified view. Implementation plans that skip enablement frequently result in the CDP sitting unused while teams continue fragmented workflows.

Effective deployment requires three parallel workstreams. First, map your data unification to specific business processes (how does complete customer context improve the renewal process? how does it change forecast calibration?). Second, train reps and analysts on the new workflow before go-live so they understand not just where information is, but why the consolidated view matters to their specific job. Third, measure outcome improvement (did deal cycle time drop? did forecast accuracy improve? did upsell rates increase?) and share results back to the team monthly so adoption feels like an improvement, not a mandate.

Organizations that execute these elements well see results within ninety days. Reps spend less time searching and more time on high-value customer conversations. Finance forecasts settle into a tighter range, reducing revenue surprises. Cross-sell and upsell attach rates increase because sales now has complete visibility into where each customer has already invested. Support organizations respond faster because they understand the customer’s business context and can diagnose issues more accurately.

Integration Across Finance, Sales, and Operations

The CDP doesn’t exist in isolation. Its value multiplies when integrated across Finance, Sales, and Operations workflows. Finance can see which customers are revenue-concentrating risks and flag them for relationship reviews. Operations can identify customers with persistent operational issues and proactively propose solutions. Sales can see predictable expansion opportunities because the unified profile reveals gaps where the customer already uses related products. This cross-functional visibility transforms the customer relationship from transactional (invoice, support, deal) into strategic (long-term value, risk management, growth potential).

The technical architecture matters here. Many organizations implement CDPs that require separate tools and manual integration points. Dynamics 365’s integrated CDP avoids this. Data flows directly from Sales, Finance, and Operations into unified profiles managed within the same ecosystem. This means no middleware delays, no data synchronization errors, and no expensive integration projects. Updates to customer records in any application reflect immediately in the unified profile and back to all other applications consuming that profile.

Timeline and Considerations for Your Organization

CDP deployment typically spans three to four months from planning to operations: four to six weeks of data mapping and quality assessment, four weeks of deduplication logic refinement and profile unification, two to three weeks of application configuration and workflow integration, then two to four weeks of enablement and controlled rollout. Organizations with complex multi-subsidiary structures or legacy data quality issues may extend this timeline, but the basic arc remains predictable.

The primary financial consideration is not software licensing (your Sales, Finance, and Operations seats already include CDP capabilities), but rather the implementation effort: data analyst and architect hours to map records, Dynamics configuration expertise for profile design and workflow connections, and business analyst time for enablement and change management. Typical deployment budgets range from 300,000 to 600,000 USD for mid-market organizations, depending on data complexity and number of integrations required. The return on investment materializes through improved forecast accuracy (fewer revenue surprises), faster deal cycles, higher renewal rates, and increased cross-sell attach. Organizations that measure these metrics often see payback within a year.

The first decision point is simple: do your sales and finance leadership teams have complete visibility into each customer’s operational footprint and financial relationship with your organization? If the answer is no, if your teams currently check multiple systems to understand a customer, if forecast accuracy remains soft despite a robust pipeline process, then CDP unification addresses a real and measurable business gap. The question is not whether Dynamics 365 can unify your data, but whether your sales and finance functions are ready to operate differently once that unification happens.


#DynamicsCDP #CustomerDataPlatform #SalesForecasting #CustomerInsights #SalesExecutionD365 #RevenueForecasting

Predictive Sales Pipeline: Using AI-Driven Insights to Close Deals Faster in Dynamics 365 Sales

The Forecast Accuracy Problem

Your sales forecast is off by 35 percent. Again. The finance team wants to know next quarter’s revenue within two percent, but your pipeline visibility stops at whether deals exist and how long they’ve been sitting in “negotiation.” You look at spreadsheet tabs from regional managers, each with their own methodology for sizing opportunities and predicting close probability. Some are optimistic, some conservative, none consistent. The disconnect costs real money: cash-flow planning misfires, resource allocation goes sideways, and your board stops trusting the numbers you present.

This scenario repeats across thousands of organizations. Sales leaders inherit forecasting processes that depend entirely on deal volume and a manager’s intuition about velocity. The problem has always been that forecasting requires insight into factors spreadsheets cannot track: how engaged the decision-maker actually is, whether objections have real weight or are routine hesitation, how similar past deals progressed at this exact stage. Collecting that data manually, standardizing it across teams, and applying consistent logic to it exceeds human capacity, especially in enterprises where one forecast might pull together hundreds of open deals across multiple regions.

Dynamics 365 Sales now addresses this directly through predictive analytics built on explainable artificial intelligence. Rather than guess, sales leaders can make pipeline decisions grounded in pattern recognition across historical deal data, engagement signals, and real-time opportunity activity.

How Predictive Analytics Works in Practice

The approach sounds technical but operates transparently. Predictive AI in Dynamics 365 Sales analyzes two key data sources. First, it examines the historical record: past opportunities that closed won or lost, along with every attribute recorded in the CRM during their lifecycle (deal value, customer segment, sales stage, stage velocity, engagement patterns from email and meetings). Second, it observes real-time signals on current opportunities: activity frequency, meeting attendance, email responsiveness, and how quickly deals advance from stage to stage relative to historical norms.

The engine then calculates win probability, churn risk, renewal likelihood, or whatever outcome metric the organization defines. Critically, it explains its reasoning. A prediction of “72 percent win probability” becomes useless without context. But “72 percent because deal value and decision-maker engagement align with past high-probability patterns, though stage velocity trails historical norms” tells a manager something actionable: close timing may slip, but the deal has substance.

This explainability matters enormously to adoption. Sales teams that see black-box scores distrust them. Teams that understand why a deal scores 62 percent instead of 78 percent can act on the gap.

Business Outcomes Worth the Investment

The quantified benefits are substantial. Organizations that implement predictive analytics in Dynamics 365 Sales typically see a 20 to 30 percent reduction in forecast error compared to spreadsheet-driven methods. This translates directly into better cash-flow predictability for finance, more accurate revenue recognition for reporting, and fewer surprises for your board and investors. Some organizations report forecast accuracy improvement of up to 75 percent when moving from intuition-based forecasting to data-backed predictions.

Beyond accuracy, predictive analytics reshapes how sales leadership works. Instead of managing pipeline by volume (“we have 40 open deals worth $8 million”), managers manage by probability and risk (“we have $5.2 million in high-probability deals, $2.1 million at moderate risk, and $700k that needs intervention or should be re-evaluated”). This clarity enables coaching at scale: rather than react when deals slip or close unexpectedly, leaders proactively identify deals moving slower than historical patterns and intervene with targeted support.

Resource allocation improves. When you know which opportunities have the highest win probability relative to effort required, you can direct your best sales reps toward deals with maximum impact potential rather than distributing effort evenly across the pipeline. This is especially valuable for complex enterprise sales where a single rep’s productivity on a high-probability deal can shift quarterly results significantly.

Addressing the Adoption Challenge

Predictive analytics only delivers value if sales teams actually use it. This requires three foundational elements. First, data quality must be real. Garbage predictions come from garbage data. If your sales team is not consistently updating deal stage, recording meeting outcomes, or noting objections, predictive accuracy collapses. Organizations typically spend 4 to 8 weeks ensuring data hygiene before meaningful predictions emerge.

Second, the organization must define what outcomes matter. Dynamics 365 Sales allows you to build different prediction models for different deal types or customer segments. A 2 million dollar software license renewal may have completely different win indicators than a 50 thousand dollar managed services deal. Rather than force one model on both, segment your training data and let AI understand the patterns unique to each. This requires your sales and operations team to think deliberately about what “high-probability” means for their business, not just accept a default.

Third, sales leadership must reinforce the behaviors that improve predictions. If predictive scores show a deal at 48 percent win probability but no rep is taking action on that signal, predictions become noise. Tie rep performance reviews, deal reviews, and sales coaching to signals from predictive analytics, and reps will pay attention. Use the explanations as coaching tools: “Your engagement signal is tracking 15 percent below deals that close at this stage. What’s blocking the buyer’s internal process?”

Practical Implementation Starting Point

Most organizations begin with predictive win probability on their largest opportunities, since high-value deals justify investment in improving forecasting accuracy. Start there, let your team build confidence in the model for 60 to 90 days, then expand to other deal types or predictive outcomes such as churn risk on renewals or ramp time on new customer accounts.

Expect your IT team to validate that Dynamics 365 Sales predictive capabilities align with your governance and compliance requirements, especially around data retention, model transparency, and audit trails. The AI here is not a black box: you can inspect model factors, understand how historical data shaped predictions, and audit decision-making.

The investment required is typically modest. Predictive analytics comes built into Dynamics 365 Sales licensing; additional tooling costs depend on whether you want third-party extensions or need custom prediction models for highly unique deal types. Most returns come from better decisions rather than new infrastructure.

Moving Past Spreadsheet Forecasting

Sales forecasting remains one of the few business processes where most enterprises still rely on manual aggregation and management judgment. Organizations that have modernized forecasting to data-backed predictions consistently report that their board conversations shift. Instead of debating whether a forecast is real or inflated, conversations center on what factors are causing deal velocity to track below or above historical norms and what actions the sales organization should take in response.

Predictive analytics in Dynamics 365 Sales makes this shift possible. It transforms pipeline data from a static snapshot into a continuous source of strategic insight, enabling sales leaders to allocate resources toward high-probability opportunities, identify and coach deals at risk, and deliver forecasts that finance can rely on for planning. For organizations frustrated with forecast accuracy, the improvement is not incremental. It is substantial enough that some CIOs and CFOs view it as a primary driver of the value of Dynamics 365 Sales itself.


Routeget Technologies helps enterprise organizations implement sales-driven Dynamics 365 solutions that connect pipeline visibility with revenue predictability. Our consulting teams have guided forecasting modernization for organizations across manufacturing, distribution, and professional services sectors, ensuring predictive analytics implementations drive both adoption and business results.


#DynamicsSalesAI #PredictivePipeline #SalesForecasting #SalesCloud #DynamicsInsights #CRMStrategy #SalesLeadership

Revenue Leakage in Dynamics 365 Sales: How Customer Insights Reveals the Customers and Deals Your Sales Team Is Overlooking

Sales analytics dashboard showing customer data, revenue trends, and risk indicators

Every sales leader knows the tension: your forecast shows healthy pipeline, yet deals slip, renewal customers disappear, and you discover too late that a key account has been quietly moving spend to a competitor. By then, the revenue is gone. The uncomfortable truth is that most sales organizations are missing revenue opportunities because they lack complete visibility into customer health. Dynamics 365 Sales gives you the transaction history, but it doesn’t automatically tell you which customers are at churn risk, which territories are underserving high-value segments, or which accounts have unmet needs your sales team has overlooked.

This visibility gap creates revenue leakage—the silent drain of money your organization should be capturing but isn’t. It’s not a process problem or a capability problem. It’s a data problem. Sales teams today operate with fragmented customer views, pulling insights from email, spreadsheets, and half-remembered conversations rather than from a unified, AI-informed customer profile.

Dynamics 365 Customer Insights, integrated with Dynamics 365 Sales, changes that equation. It surfaces the customer and deal patterns your sales team is missing, turning reactive forecasting into proactive opportunity identification. Here’s why this matters, and how to use it.

The Hidden Cost of Incomplete Customer Visibility

A typical enterprise sales organization manages accounts across multiple product lines, regions, and sales representatives. Within that sprawl, visibility breaks down. A customer’s service interactions, support history, and product usage patterns live in separate systems. Your CRM captures what the sales team recorded, often days or weeks after the conversation. Marketing knows about digital engagement and content downloads but doesn’t automatically share that with the sales team. Finance sees transaction history but not the potential for expansion.

The result is that your sales team operates on a partial picture. A renewal customer who shows declining product usage may not trigger an alert until the renewal comes due—too late to course-correct. A high-value prospect showing strong product engagement may never get the right follow-up because the sales process doesn’t connect product behavior to account value. A territory might be systematically underserving customers in a high-margin segment simply because the data to identify those customers never reaches the account manager’s workspace.

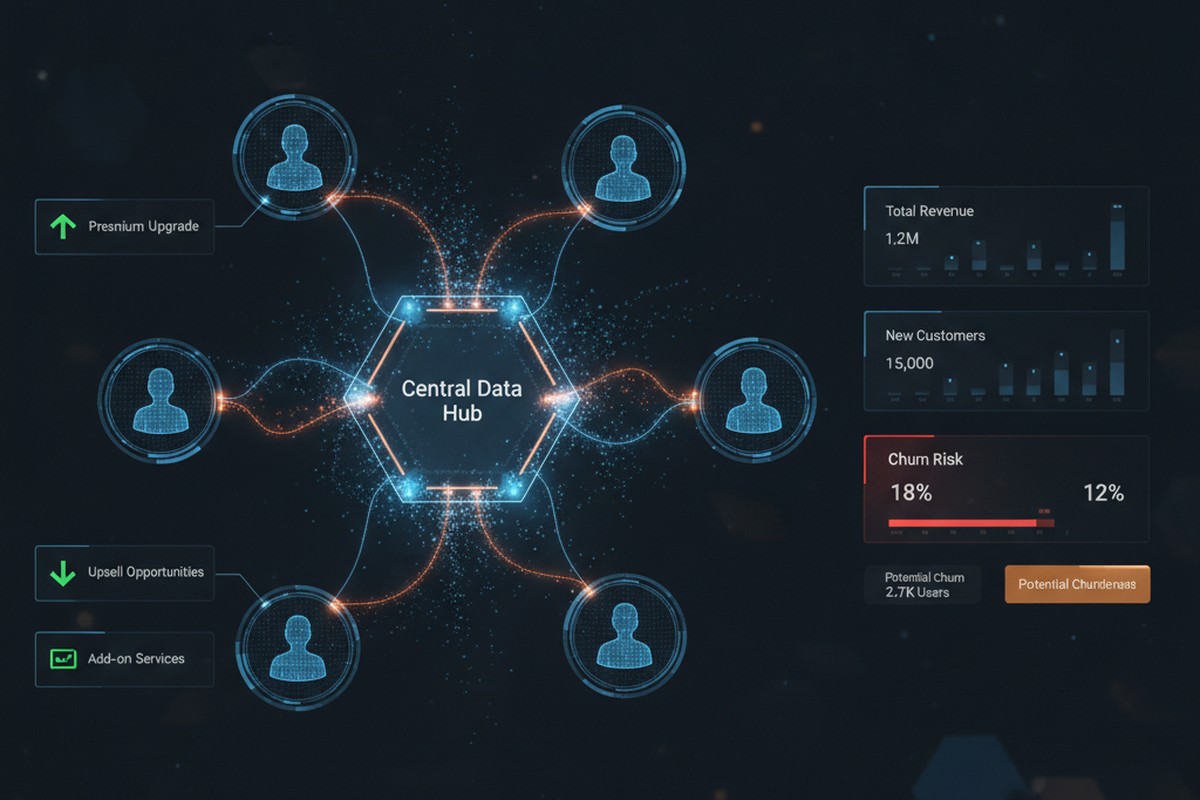
Customer insights and sales analytics visualization showing interconnected customer data, churn risk indicators, and upsell opportunities

None of these problems are individually dramatic. But they accumulate. A single missed upsell here, a renewal at risk there, a territory misaligned by segment. Over a year, across a 50-person or 500-person sales organization, the revenue impact becomes material. This is revenue leakage: money your organization should capture but doesn’t because the visibility isn’t there to act on it.

What Customer Insights Reveals

Dynamics 365 Customer Insights does three things that Dynamics 365 Sales alone cannot do: it unifies fragmented data, it applies AI to detect patterns, and it surfaces those patterns directly where sales works.

First, unification. Customer Insights pulls data from Dynamics 365 Sales, Service, and Finance, along with external sources like transactional systems, email engagement platforms, and even product usage telemetry if you’re licensing that data. It resolves duplicate customer records, maps fragmented customer identities across systems, and builds a single unified customer profile. That profile then becomes the source of truth for your sales team, not the sum of dozens of disconnected systems.

Second, AI-driven pattern detection. Once your customer data is unified, Customer Insights applies machine learning models to detect risk and opportunity. It identifies which customers are at churn risk based on behavioral signals: declining engagement, reduced transaction frequency, increasing support tickets for infrastructure issues rather than feature adoption. It flags cross-sell and upsell candidates by finding customers with strong product engagement, high contract value, and similarity to customers who have successfully adopted adjacent products. It detects territory misalignment by showing which high-value customer segments are under-represented in each territory’s current assignment.

Third, integration into sales workflows. Customer Insights insights aren’t buried in a separate analytics portal. They live inside Dynamics 365 Sales, where your sales team already works. A segment insight becomes a targeted list for account managers. A churn risk indicator appears on the customer card, prompting a proactive outreach. Territory realignment recommendations come with data backing that makes the business case clear to sales leadership.

Three Revenue Leaks Customer Insights Stops

In practice, this surfaces three common revenue leaks that Dynamics 365 Sales alone doesn’t catch.

Churn risk not detected until renewal: A customer’s service organization starts requesting more support tickets. Their product usage plateaus. They haven’t attended your quarterly business reviews. But your sales team doesn’t know this yet because the renewal isn’t for eight months. By the time the renewal date arrives, the customer has already decided to leave. Customer Insights detects these behavioral signals and flags the account as at-risk, giving your sales team months to engage, understand the underlying issues, and propose solutions before the customer decides to leave.

Upsell and cross-sell opportunities invisible in transaction history: An existing customer has been steadily growing revenue with one product line. Their usage of that product is high relative to their segment peer group. They have no adoption of your complementary product, despite a clear business case. But this pattern doesn’t surface in your CRM unless a sales rep manually reviews the account and spots it. Customer Insights identifies customers matching this profile (high engagement with Product A, zero adoption of Product B, high segment value) and presents the opportunity to the account manager in a curated list. The sales team then has clear targeting and clear messaging: here are ten accounts that look exactly like your most successful cross-sell deals.

Territory assignments that systematically underserve high-value segments: A sales rep covers a territory by geography or existing customer base, as most do. But unbeknownst to anyone, their territory is underindexed for your highest-margin customer segment. There are five high-value customers they should be servicing more aggressively, but the assignment wasn’t based on segment data. Customer Insights analyzes territory composition and identifies these gaps. Sales leadership can then realign assignments, pair reps, or adjust compensation to prioritize the underserved segment, recovering revenue that was never really lost but never properly prioritized either.

Making It Work: Implementation Reality

Deploying Customer Insights for revenue recovery requires more than licensing and configuration. It requires discipline around data and alignment between sales and the teams supporting data quality.

Start narrow. Don’t try to build a unified customer profile from all your data at once. Pick your three to five highest-priority leakage patterns: churn risk, a specific high-margin upsell use case, or territory underutilization in a specific segment. Build the data foundation for those patterns first. That usually means cleaning Dynamics 365 Sales and Finance data, establishing integrations with service and support systems, and clarifying the business definitions your models need (what signals constitute churn risk for your product and industry, what engagement level constitutes strong adoption, what segments you care most about).

Then connect insights to action. An insight that doesn’t make it to a sales rep’s attention is just reporting. Customer Insights insights should flow into Dynamics 365 Sales as filtered lists, dynamic segments, or automated workflow triggers. When a customer hits a churn-risk threshold, a task appears on the account manager’s dashboard. When your AI identifies a cross-sell candidate, it lands in a weekly opportunity list. This requires configuration, but it’s configuration that makes the investment pay off.

Finally, track adoption and adjust. Sales teams don’t automatically trust new data. They trust data that repeatedly surfaces patterns they already sense. So measure: what percentage of churn-risk customers your team engages, what percentage of AI-identified cross-sell opportunities convert, what revenue the territory realignment recovered. As results emerge, adoption increases and the business case for the investment becomes clear.

The Compound Effect

Revenue leakage seems invisible because it’s measured by the opportunities you didn’t see, not by the deals you lost. A customer renewal that didn’t happen looks like a churn, not a miss. A customer segment your territory didn’t pursue looks like normal variation in segment mix, not a systemic gap. But when you unify customer data and apply AI to detect patterns, these invisible leaks become visible. And visible problems are fixable.

For a 100-person sales organization with average deal size of $50,000, recovering even one additional deal per quarter per rep through improved territory alignment or churn prevention represents $5M to $10M in annual recurring revenue. The math compounds as your organization scales. Customer Insights is not the only solution to revenue leakage, but it’s one of the few tools that surface the patterns causing the leak in the first place.

Dynamics 365 Sales will always show you what happened. Customer Insights shows you what you’re missing. For sales leaders serious about revenue recovery, that difference is strategic.


About Routeget Technologies: Routeget specializes in Dynamics 365 implementations for enterprise sales and service organizations. We help sales leaders establish data governance and customer analytics strategies that uncover revenue recovery opportunities through Customer Insights and Dynamics 365 Sales integration. If your organization is looking to reduce revenue leakage through better customer intelligence, we’d welcome a conversation.

#DynamicsSales #CustomerInsights #RevenueLeakage #SalesAnalytics #SalesForecasting #CustomerDataPlatform #SalesLeadership