
Building Demand Forecasting Intelligence in Dynamics 365 Supply Chain Management: Integrating AI Builder Predictive Models with Historical Data for Accuracy and Cost Reduction

Building Demand Forecasting Intelligence in Dynamics 365 Supply Chain Management: Integrating AI Builder Predictive Models with Historical Data for Accuracy and Cost Reduction

Most supply chain teams operate on reactive forecasting. Demand planners pour through months of historical sales data, adjust for seasonality using spreadsheet logic, and send forecasts to procurement and manufacturing with the knowledge that 20 to 30 percent will miss by more than ten percent. When demand runs higher than forecast, stockouts ripple through fulfillment. When demand falls short, inventory sits as dead stock and cash ties up in warehouses.

The problem isn’t the people doing the forecasting. It’s the tools. Manual forecast methods plateau at a certain accuracy ceiling because they cannot account for the full complexity of relationships in historical data, and they cannot incorporate real-time signals from customer behavior, marketing campaigns, or supply disruptions as those signals arrive. By the time a planner notices a trend and adjusts the forecast, the cycle is already three weeks old.

Dynamics 365 Supply Chain Management paired with AI Builder’s predictive capabilities offers a path to higher forecast accuracy without rebuilding your entire planning process. The approach is to integrate AI-driven demand models into your existing planning workflow, using historical transaction data from Dynamics 365, external signals from Power Platform connectors, and iterative model refinement based on actual outcomes. This differs fundamentally from bolting on a separate forecasting tool. The predictions live inside Dynamics 365, flow directly into MRP and procurement workflows, and improve continuously as new transactions arrive.

How Predictive Models Change the Demand Planning Conversation

Demand forecasting in a traditional ERP context treats the forecast as a static monthly or weekly snapshot. Planners pull data as of a specific date, run a calculation, and submit the result. Thirty days later, they start over with a new snapshot. Changes in the forecast require manual reforecasting, which itself takes days or weeks depending on review cycle length.

AI-driven models operate differently. They identify patterns in historical data that human review would struggle to spot, particularly patterns involving multiple interacting variables. For instance, a model trained on two years of transactions might discover that demand for a product correlates not just with the previous month’s sales, but with a specific customer segment’s purchasing velocity, the day of the week orders arrive, promotional calendar markers from your marketing team, and supplier lead time variability. No spreadsheet naturally captures all four of these relationships simultaneously.

The second difference is recency. Once a model is trained and deployed into Dynamics 365, it can retrain continuously as new data arrives. New customer orders in March change the statistical weight of seasonal factors for April. A new supplier agreement changes the model’s understanding of lead-time risk. The model incorporates signal from these events automatically rather than waiting for the next manual reforecast cycle.

The Integration Architecture

An effective demand forecasting system in Dynamics 365 consists of four layers: data preparation, model training, prediction serving, and feedback integration.

Data preparation pulls historical sales transactions, customer attributes, product characteristics, and external signals into a consistent format. For Dynamics 365, this typically means extracting data from Dynamics tables (sales order history, customer master, product master, inventory transactions) and supplementing with external sources via Power Platform connectors (marketing campaign calendars from SharePoint, promotional events, supplier reliability scores from external systems, weather data if weather-sensitive). The preparation step also handles missing values, outlier detection, and feature engineering. A feature engineer might create derived columns such as “days since last customer purchase,” “product seasonality index,” or “forecast error from previous cycle,” which give the model richer input signals than raw transaction history alone.

Model training uses AI Builder’s predictive capabilities to build regression or time-series models that predict future demand based on the prepared features. Rather than writing code, you define the model through the AI Builder wizard by selecting input columns and the target column (historical demand volume). AI Builder handles train-test-split, hyperparameter tuning, and model validation. For supply chain, common model types are time-series forecasting (when you care about sequential patterns over time) or regression (when you’re predicting demand for a specific product-customer combination).

Prediction serving embeds the trained model into Dynamics 365 workflows and Power Automate flows, so forecasts are generated on-demand or on schedule. For example, you might configure a Power Automate flow that runs nightly, calls the AI Builder model for each product-customer combination, and writes the resulting forecast into a custom table in Dataverse. Those forecasts then feed directly into the MRP algorithm, procurement workflows, and safety stock calculations without manual intervention.

Feedback integration closes the loop by comparing actual demand (captured from sales orders) to forecast values, measuring accuracy, and flagging model drift. When accuracy drops below a threshold, the model is retrained with the latest data. This feedback loop is critical. A model trained on data from 2024 will degrade in predictive power by mid-2025 if customer behavior shifts, new product launches change the demand mix, or market conditions change. Continuous retraining keeps the model anchored to current reality.

Building the System: A Phased Approach

Phase 1: Foundation (Weeks 1-4)

Define forecast granularity: are you forecasting by product, product-customer, or product-location? Finer granularity requires more training data but offers more actionable predictions. Most teams start at product or product-location level because customer-level forecasts require sufficient transaction history per customer to be statistically reliable.

Extract two years of historical sales transactions from Dynamics 365. If your data is older than two years or contains structural breaks (major product discontinuations, customer wins or losses that shift volume), the older data may confuse the model more than help. Two years of clean, stable history is usually optimal starting point.

Prepare the data: clean missing values, remove anomalous transactions, create seasonal and trend features. Document data quality issues discovered during this phase, because they’ll inform model accuracy expectations. If your historical data has significant gaps or inconsistencies, the model’s predictions will inherit that uncertainty.

Phase 2: Model Development and Testing (Weeks 5-8)

Train an initial AI Builder model using the prepared data. Start simple: predict monthly product demand using sales history, seasonality, and trend. Measure model accuracy using mean absolute percentage error (MAPE) or similar metric on a test set held back from training.

At this stage, expect MAPE in the 15-25 percent range for most B2B supply chains. This is better than many manual forecasts, but not excellent. The model is baseline.

Phase 3: Feature Expansion and Iterative Improvement (Weeks 9-12)

Introduce external signals: marketing campaign calendar, holiday calendars, supplier lead time changes, customer segmentation. Retrain the model with these additional features. Often, MAPE improves to 10-18 percent range as the model learns that certain products spike around promotional events or that specific customer segments follow different seasonal patterns than others.

This phase is iterative. Test different feature combinations, measure their impact on model accuracy, and retain features that improve generalization to new data (not just training accuracy).

Phase 4: Operationalization (Weeks 13-16)

Build Power Automate flows that call the trained model on a schedule (daily or weekly) and write predictions into a forecast table in Dataverse. Connect that forecast table to your MRP algorithm, procurement approval workflows, and safety stock calculations.

Create dashboards in Power BI that show forecast accuracy over time, broken down by product category or customer segment. This surfaces model drift early and guides retraining decisions.

Run the system in parallel with your existing forecast process for 4-8 weeks. Measure whether AI-driven forecasts outperform the previous method on unseen data. If accuracy is demonstrably better, transition to AI-driven forecasts as primary. If not, investigate why: common reasons include data quality issues, inappropriate feature selection, or a mismatch between forecast granularity and demand volatility.

Practical Considerations and Common Pitfalls

Data quality is foundational. If your historical sales data conflates cancellations, returns, and adjustments with actual demand, the model learns from noisy signals. Clean this before model training. Separate true demand from inventory adjustments and reverse transactions.

Seasonality must be explicit. Demand for swimming pools peaks in spring and summer; demand for holiday decorations peaks in October. If the model sees only two years of data, it may not capture these seasonal patterns reliably. Consider augmenting training data with external industry benchmarks or promotional calendar features to help the model learn seasonality even from limited historical windows.

Forecast accuracy degrades without feedback. The model is only as good as the data it was trained on. As your business changes (new customers, new products, market shifts), retrain monthly or quarterly. This is not a set-and-forget system.

Start with products that have stable demand. If a product’s demand varies wildly based on external events you cannot predict (e.g., government spending decisions, competitor actions), forecasting it will be difficult even with an AI model. Begin with products that have predictable demand patterns, validate the system there, and expand gradually.

Avoid overfitting during development. A model that achieves 5 percent MAPE on historical training data but 25 percent MAPE on future data is worthless. Use a held-back test set during model development to ensure the model generalizes. AI Builder handles this, but understanding the concept helps you interpret results.

Expected Impact and ROI

Organizations implementing demand forecasting typically see three categories of benefit.

Accuracy: Forecast error typically falls from 25-35 percent to 12-18 percent MAPE. For a 100-product portfolio with 10,000 units monthly demand and 30 percent average order value, improving forecast error from 30 percent to 15 percent reduces unintended stockouts by 50 percent and decreases safety stock holding by 20-30 percent. Carrying cost savings alone can reach 5 to 15K annually for mid-market organizations.

Responsiveness: When forecasts update daily rather than monthly, your supply chain responds faster to real demand signals. Lead time variability shrinks because you’re ordering based on more current expectations. Customer fulfillment improves because stockouts drop.

Cost: Better forecasts reduce emergency freight and expedited purchases caused by stock-outs. For organizations spending 500K to 2M annually on procurement, a 5-10 percent reduction in emergency purchases equals 25K to 200K in savings. Implementation cost (40-80K consulting plus ongoing model maintenance) pays back within 6-12 months for most mid-market supply chains.

Next Steps

Begin by auditing two years of historical demand in your top 30 percent of products by revenue. Assess data quality. Engage your forecasting team to identify which external signals they believe drive demand in your business. Work with technical resources to extract and prepare that data. Then run a proof of concept on a single product line before full deployment.

Predictive demand forecasting is not exotic anymore. It is a practical capability now available to any Dynamics 365 customer with historical data and the discipline to maintain model quality. Organizations that implement it gain a structural advantage: better forecast accuracy without needing larger planning teams, and the ability to respond to demand signals in weeks rather than months. The tools are ready. The question is whether your supply chain will use them.

#DemandForecasting #DynamicsSCM #AIBuilder #SupplyChainIntelligence #PredictiveAnalytics #D365SupplyChain #ProcurementOptimization

The Hidden Costs of Manual Demand Planning: Why CFOs Should Evaluate AI-Driven Forecasting in Dynamics 365

Every supply chain leader faces the same impossible choice: hold more inventory to prevent stockouts, or run lean and risk losing sales to supply disruptions. Most organizations have internalized this tradeoff as inevitable, accepting that carrying excess stock is simply the cost of avoiding revenue-killing gaps. That assumption deserves scrutiny.

The actual cost of reactive demand planning is far higher than most finance teams realize. When demand forecasts rely on spreadsheets, historical averages, or manual adjustments, organizations consistently overshoot demand during slow periods and undershoot during peaks. The result is not a balanced tradeoff but a compounding problem. Excess inventory locks up working capital, incurs storage and handling costs, and often leaves companies writing off obsolete stock. Meanwhile, the same forecasting gaps that created overstock elsewhere produce stockouts in fast-moving categories, forcing expensive expedited procurement or losing margin-rich sales entirely.

For a mid-market distributor or manufacturer, this dynamic can represent 15 to 25 percent of annual supply chain operating costs. For larger enterprises managing thousands of SKUs across regions and channels, the inefficiency can exceed that figure significantly.

Dynamics 365 Supply Chain Management offers a direct path to breaking this cycle through AI-driven demand forecasting that integrates directly with your planning processes and financial reporting. The difference is not incremental improvement. It is a fundamental shift in how demand planning works, moving from reactive adjustment to predictive modeling that incorporates external market signals and automatically learns from forecast accuracy over time.

The Mechanics of AI Forecasting in SCM

Dynamics 365 Supply Chain Management’s demand planning capabilities rest on three foundational elements that separate AI-driven forecasting from traditional statistical methods. The first is no-code model configuration. Unlike legacy forecasting approaches that require data scientists to build custom models, Dynamics 365 enables business planners to construct and adjust sophisticated forecasting models directly within the application. The system automatically tunes AI parameters and preprocessing steps based on the specific patterns in your data. This matters for operations teams because it means you can iterate on forecasting strategy without dependency on scarce technical resources or multi-month development cycles.

The second element is multi-level hierarchy support. Most organizations plan demand at multiple levels simultaneously: corporate-level forecasts for financial planning, regional forecasts for distribution network optimization, and SKU-level forecasts for procurement and manufacturing. Traditional forecasting tools force a choice: maintain separate models for each level, which creates reconciliation nightmares, or collapse everything into a single level and lose visibility into regional or product-specific trends. Dynamics 365 aggregates and disaggregates forecasts across hierarchies automatically. When a regional demand planner adjusts a forecast for a specific SKU, the system instantly reflects the impact at the corporate level and across related SKUs. When a product manager adjusts forecast ranges at the category level, the system cascades the adjustment to individual SKUs while preserving regional variations. This transparency eliminates the false precision of traditional rollup approaches.

The third element is external signal integration. Real-world demand does not move independently of market conditions. A promotion drives spike demand. A competitor stockout redirects customers to your channel. Weather patterns influence demand for seasonal categories. Price changes shift purchase timing. In traditional forecast models, these factors either go unmodeled, forcing planners to manually adjust forecasts reactively after conditions emerge, or they require custom data pipelines and engineering support to integrate. Dynamics 365 demand planning lets planners define external signals like promotional events, pricing changes, weather indices, or stockout events directly within the planning model. The AI engine automatically learns the relationship between each signal and demand movement, then incorporates that learning into forward-looking forecasts. This means planners can model the impact of planned promotions or pricing decisions before execution, rather than explaining forecast misses after the fact.

The Business Impact of Accuracy

The practical outcome of these capabilities is measurably higher forecast accuracy. Published case studies and implementations across large manufacturers and distributors consistently show 10 to 20 percent improvements in mean absolute percentage error (MAPE) when moving from manual or basic statistical forecasting to AI-enhanced planning in Dynamics 365. For a business with $500 million in revenue and 30 percent annual cost of goods sold, a 1 percent improvement in forecast accuracy can reduce unplanned inventory carrying costs by $1.5 million annually. For larger enterprises, the impact scales accordingly.

But forecast accuracy alone is not the lever that moves CFO behavior. The business case that actually resonates is inventory efficiency and working capital release. When forecasts improve, you can reduce safety stock levels without increasing stockout risk. A manufacturer carrying $50 million in inventory across 8,000 SKUs with a 12 percent annual carrying cost (warehousing, handling, obsolescence, financing) can release $2 to $4 million in working capital by reducing average inventory 5 to 8 percent through better demand visibility. That capital can fund growth investments or be deployed to higher-return projects elsewhere in the business. At a 10 percent cost of capital, the value of that released working capital often exceeds the technology investment in the first year.

Additionally, improved demand-supply alignment reduces unplanned expedited freight, emergency procurement, and premium supplier pricing. When demand forecasts are more reliable, production and procurement teams can commit to longer planning horizons and lock in more favorable supplier terms. This typically yields an additional 2 to 5 percent reduction in COGS for procurement-intensive operations.

Real-Time Planning and Execution

Dynamics 365 integrates demand planning directly with procurement, production, and financial execution. Once a demand forecast is finalized or published, it automatically flows into supply planning (via planning optimization), production scheduling, and procurement recommendations. Sales planners can edit forecasts at any level and see immediate visibility into impacts on procurement commitments, production schedules, and supplier lead times. If a regional surge in demand requires expedited procurement, the system surfaces the impact on cash flow and supplier commitments, allowing planners to trade off the benefit of meeting demand against the cost of expedited sourcing.

For finance teams, this integration means you can close forecasting loops faster. Rather than waiting for quarterly actual results to assess forecast accuracy, you can compare forecast-to-actual at weekly or daily granularity, identify which forecast models are drifting, and adjust models in real-time. This creates a feedback loop that continuously improves planning accuracy throughout the year, not just at annual reforecasting cycles.

The Organizational Prerequisites

Deploying AI-driven demand forecasting successfully requires three conditions. First, organizations need clean, comprehensive historical demand data spanning at least 24 to 36 months of actuals, organized by SKU, location, and channel. Second, planning teams need clarity on which data elements represent true demand versus constrained demand caused by stockouts or supply-driven rationing. This distinction is critical because AI models trained on constrained demand will underestimate true market potential. Third, there must be organizational commitment to following plan rather than overriding forecasts based on hunches or latest information. Demand planning delivers value only when the organization actually uses the forecasts to drive procurement and production decisions, not when forecasts are generated but then set aside in favor of prior approaches.

The Path Forward

For CFOs and operations leaders evaluating supply chain technology, the question is no longer whether demand forecasting should use AI, but whether your organization has the planning discipline and data hygiene to extract full value from it. Dynamics 365 Supply Chain Management provides the infrastructure. The business case is grounded in working capital reduction, improved forecast accuracy, and lower expedited procurement costs. Implementation timelines typically span 6 to 9 months from initial data preparation through full production use. Organizations that treat forecasting as a core operational discipline, supported by dedicated planning resources and clear performance metrics, realize the full benefit. Those that view it as a technical tool to be activated and then left unmanaged typically achieve only modest gains.

The current state of your demand planning is a tax on your operating model. The question is what you do about it.

About Routeget Technologies: Routeget specializes in Dynamics 365 implementation and optimization for enterprise organizations. Our supply chain consulting practice helps clients design forecasting strategies, configure demand planning in SCM, and build the organizational processes needed to sustain accuracy and value over time.


#DynamicsSupplyChain #DemandForecasting #InventoryOptimization #ERPTechnology #SupplyChainAI

Building Predictive Models with AI Builder: Implementing Demand Forecasting without Custom Code

Demand forecasting has traditionally required either hiring data scientists or purchasing specialized software. The real constraint is not sophistication—it is speed. Finance teams in Dynamics 365 Finance and Operations need forecasts that update weekly, not quarterly. Operations managers need accuracy that improves monthly as new sales data arrives. AI Builder removes this friction: it lets operations and finance teams build, train, and deploy predictive models directly within Dynamics 365 using their transaction data, without custom code.

Why Demand Forecasting Matters Now

Inaccurate forecasts create cascading problems across finance and operations. Overforecasting ties up working capital in excess inventory sitting in warehouses. Underforecasting triggers stockouts and missed sales. Supply chain teams spend weeks manually adjusting forecasts based on emails and spreadsheets, and those adjustments are often guesses rather than data-driven. The friction is not the mathematics—it is the time lag between when new data arrives and when a forecast updates.

Mature Dynamics 365 environments already hold years of transaction history: daily sales, seasonal patterns, customer behavior, supply disruptions, one-time events. That data is gold for machine learning, but extracting value has traditionally required building a separate analytics stack, training models offline in Python or R, and then manually importing predictions back into your ERP system. AI Builder eliminates this overhead. Models run inside Dynamics 365, train on actual transaction data, and deliver predictions directly to your planning workflows. The forecast updates as new transactions arrive. No separate infrastructure. No data pipeline maintenance. No custom code to debug.

How AI Builder Approaches Time-Series Forecasting

AI Builder’s time-series forecasting model recognizes temporal patterns in data that simple methods miss. Unlike linear regression, which assumes tomorrow looks like today, the model understands that Tuesday typically differs from Monday, January differs from July, and external shocks (promotions, supply disruptions) alter the underlying pattern. The model operates in three phases: training (learning patterns from historical data), testing (validating accuracy on held-back recent periods), and deployment (generating forecasts for future periods).

A critical point: AI Builder’s model is univariate, meaning it forecasts a single metric based only on that metric’s history and time dimension. It does not automatically incorporate external factors like promotional calendars or weather—but you can engineer these as separate columns in your training data if they influence your demand signal.

Data Preparation: The Foundation

Model success depends entirely on data quality and structure. AI Builder requires a date column representing the time axis (daily, weekly, or monthly granularity), a numeric metric column to forecast (total units sold, revenue, customer count, inventory turns, etc.), and optional grouping columns if you need separate forecasts per product, customer segment, region, or warehouse.

A typical dataset has Date, Product SKU, Units Sold, and Revenue. You configure AI Builder to use Date as the time dimension, Units Sold as the forecast target, and Product SKU as the grouping so the model learns separate patterns per product. Ensure your training dataset covers at least 2-3 years of history. Models trained on only 6 months often fail to capture seasonal patterns, holidays, and year-end variations. Your dataset must be continuous with no gaps; AI Builder does not impute missing values.

Configuration and Training

Navigate to AI Builder in Dynamics 365 or Power Apps. Under Build, select Forecasting. The wizard guides you through uploading or selecting your dataset, selecting your time and metric columns, configuring grouping if needed, and setting the forecast horizon. The model trains automatically, typically taking 5-15 minutes depending on dataset size and complexity.

Validating Accuracy

After training, AI Builder displays accuracy metrics. The key metric is MAPE (Mean Absolute Percentage Error). A MAPE of 10% means predictions are off by 10% on average. A MAPE of 20-25% is reasonable for most demand forecasting; anything above 30% suggests either noisy data, insufficient history, or a metric that genuinely is hard to predict. If accuracy is poor, investigate data quality first. Ensure you have 2-3 years of history covering complete seasonal cycles. If the metric is inherently noisy, aggregate to a coarser level before retraining.

Deployment and Integration

Once you accept the model, deploy it. You can generate forecasts through batch CSV uploads, REST API calls, Power Automate automation, or Power BI integration. A common pattern runs every Monday, pulls 3 years of sales history from Dynamics 365, requests a 12-week forecast, stores results in Dataverse, and updates Power BI dashboards.

Push forecasts back into Dynamics 365 Finance as demand forecast entries. Your Master Scheduling engine then uses these entries as input for procurement plans, production schedules, and supply orders. Set up a Power Automate flow that takes AI Builder forecast output and posts it to the Dynamics 365 Demand Forecast table via REST API. Validation is critical. Before integrating forecasts into your planning process, run a pilot comparing AI Builder forecasts against your manual forecasts for 4-6 weeks. If the model outperforms manual methods, roll out broadly.

Common Implementation Pitfalls

Insufficient history, aggregate data without grouping, over-frequent retraining, ignoring forecast drift, and over-automation are common mistakes. Always validate model output against actual results before full deployment. Monitor MAPE over time, and adjust training data or retraining frequency if accuracy degrades.

Measuring Success

After rollout, measure forecast accuracy (MAPE), inventory days of supply, stockout frequency, and procurement lead time. Implementations typically reduce forecast error by 15-25% and inventory costs by 8-12% in year one. The key is rigorous data prep and commitment to retraining as patterns evolve.

Conclusion

AI Builder demand forecasting removes barriers that once kept predictive models beyond reach for most operations teams. Start with one product family or warehouse. Prepare 3 years of clean data, train a model, and validate accuracy. Once confirmed, scale to additional dimensions. Within weeks, you will be making procurement and planning decisions based on data-driven signals, not guesses.


#AIBuilderImplementation #DemandForecasting #DynamicsFinance #MachineLearning #SupplyChainOptimization #DataDrivenPlanning #PredictiveAnalytics #D365Implementation

Demand Forecasting in Dynamics 365 Supply Chain: Why AI Predictions Still Need a Finance Controller

Supply chain analytics dashboard showing demand forecasting data

Your supply chain forecasting process relies on a spreadsheet, email chains, and quarterly consensus meetings where people argue about whether next quarter looks “up” or “down.” By the time everyone agrees, demand has already shifted. Dynamics 365 Supply Chain includes native demand forecasting powered by machine learning, and it looks compelling: automatic pattern detection, seasonal adjustment, and predictions backed by months of transaction history. The promise is clear: let the algorithm handle it, and inventory optimizes itself.

But here’s what most supply chain leaders discover after three months of production use: the algorithm is confident and occasionally wrong in expensive ways. A Dynamics 365 demand forecast can show 10% growth next quarter because of a single promotion cycle two years ago that now looks like a trend. Or it can predict stable demand when a major customer just went silent. The numbers are rigorous; the business context is not.

This is not a Dynamics 365 limitation, but a forecasting reality that CFOs and supply chain directors need to understand before they flip the switch on full automation. The technology works. The question is how to use it without letting the model’s confidence substitute for financial discipline.

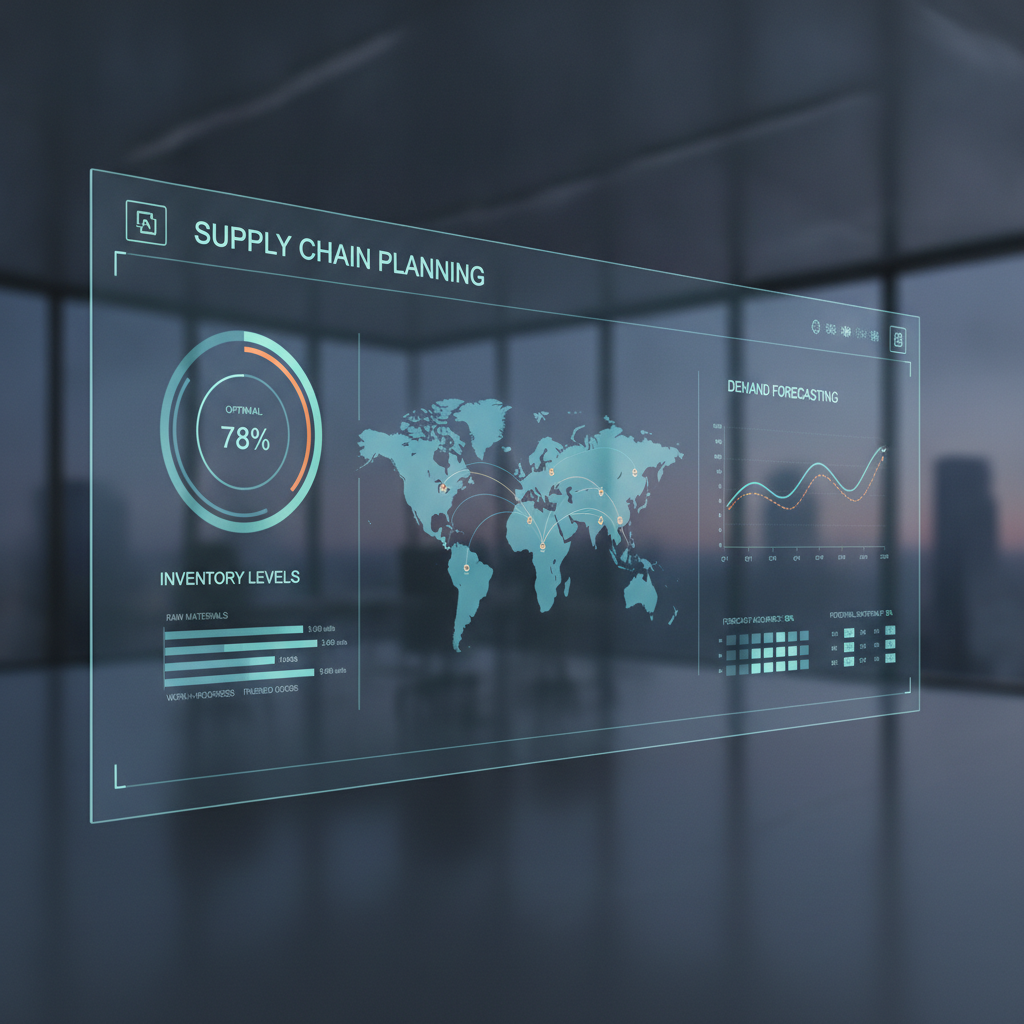
Supply chain planning dashboard with demand forecasting metrics

What Dynamics 365 Demand Forecasting Actually Predicts

Dynamics 365 Supply Chain uses machine learning to analyze historical demand patterns and generate point forecasts for future periods, typically one to twelve months out. The system takes transaction history (sales orders, purchase orders, inventory movements), identifies seasonality, trend, and cyclical patterns, and applies time-series decomposition to produce a predicted demand volume for each item in each period.

The key phrase is “point forecast”: a single number per period per item, not a range. It’s precise, quantifiable, and immediately actionable as a target for production planning, procurement, and inventory targets. The model uses techniques like exponential smoothing and ARIMA (AutoRegressive Integrated Moving Average) to weight recent history more heavily and adjust for seasonal swings observed over multiple years.

For many product categories, this works well. If you sell a consistent product with stable customer base and predictable seasonality, a machine learning forecast often beats manual judgment. The algorithm isn’t emotional, doesn’t anchor to last year’s number, and picks up subtle patterns that a spreadsheet jockey might miss. This is not theoretical; it’s production reality across hundreds of implementations.

The Finance Controller’s Problem with Pure Automation

The trouble arrives when the model’s assumptions break down. Here are three scenarios that appear in almost every supply chain forecasting implementation:

Scenario 1: A Large Customer Goes Quiet or Leaves. Your top customer, representing 22% of annual demand for a product family, doesn’t place an order for two periods. The demand forecast model has five years of history showing this customer as rock-solid steady, so the algorithm predicts normal consumption in period three, waiting for the order that never comes. A human supply chain planner would escalate the issue to sales or customer success immediately. A finance controller would note the drop in the forecast, not wait for the model to recalibrate across six more months of zero orders.

Scenario 2: One-Time Promotions Create False Trends. Last summer, you ran a promotional campaign that drove a 40% spike in demand for a specific product. The machine learning model, looking at the last 24 months of history, detects this spike and attributes a portion of it to an underlying trend shift rather than recognizing it as a one-time event. The forecast for next summer incorporates this “trend,” predicting sustained 20% elevation even though you have no plans to run the promotion again. A finance controller reviewing the forecast would flag this immediately (“Did we plan a promotion? No.”). The algorithm does not ask strategic questions.

Scenario 3: Timing Mismatch Between Demand Signal and Forecast Recalculation. You learn on Tuesday that a major product line is being discontinued. The demand forecast in Dynamics 365, calculated on last Friday, still predicts normal consumption through quarter-end. The model will not be recalculated until next Friday’s batch run. By the time the new forecast is available, you’ve already committed to purchase commitments and production schedules based on outdated data. A finance controller who is manually involved in forecast validation can adjust the prediction immediately.

In each of these scenarios, the machine learning model is not “wrong” in statistical terms. It’s following its design: predict based on historical patterns. The business context (personnel changes, campaign decisions, strategic shifts) happens faster than the model’s training cycle can absorb. Finance leaders know this. Supply chain leaders know this. But when the system is fully automated, nobody is asking the question.

The Dynamics 365 Approach: Automation With Financial Governance

Dynamics 365 Supply Chain’s forecasting engine does include governance features, but they work best when treated as mandatory checkpoints, not optional. The system allows you to:

Set override rules at the item or item-family level, specifying factors by which the model’s predictions should be adjusted (for example, “multiply this item’s forecast by 1.15 for next quarter because we’re running a promotion”). You can also set absolute override values, replacing the model’s prediction entirely for specific items in specific periods.

Use Demand Forecast Accuracy KPIs to measure how well the model’s past predictions match actual demand, broken down by item family and customer segment. If a forecast consistently misses by 15% for a certain category, that’s a signal to investigate whether the model’s assumptions are still valid or whether market conditions have shifted in ways the historical data doesn’t capture.

Manually adjust forecasts before they feed into production planning by creating a Demand Forecast Adjustments form, where supply chain planners and finance controllers can document specific business reasons for adjusting (or accepting) each model-generated prediction. This creates an audit trail: months later, you can see that Q2 forecasts were intentionally lifted 8% because of an announced customer expansion, distinguishing intentional adjustments from modeling error.

Integrate the demand forecast into a Dynamics 365 Planning Optimization run, which also accounts for supply constraints, lead times, and safety stock levels. The forecast is just one input; planning optimization adjusts based on the full supply picture.

None of these features bypass the algorithm. They layer financial and business governance on top of the automation, recognizing that pure model-driven forecasting works until it doesn’t, and having a second set of eyes looking at the numbers before they lock in procurement and production schedules saves more money than pure automation typically gains.

The Finance-Supply Chain Handoff: How the Best Teams Use Forecasting

Organizations that get strong results from Dynamics 365 demand forecasting typically follow a pattern:

Supply chain operations generates the base forecast using the machine learning model and treats it as a starting point, not a decision. They run the model on a fixed schedule (for example, every Friday afternoon) and document any configuration changes (for example, a customer’s demand type changes from baseline to promotional).

Demand planning, working with sales and marketing, reviews the forecast against known business events: major customer wins or losses, planned promotions, supply disruptions, or strategic inventory adjustments. They create documented adjustments in the system, so the model is informed of one-time events versus trends.

Finance and the controller function reviews the resulting forecast for cash flow, working capital, and procurement commitment implications before it locks in. A 30% demand lift for a product with a 90-day supply lead time means purchasing commitments, warehouse space, and cash flow assumptions need to shift accordingly. The finance controller’s approval step is the gate between “the model predicts” and “we’re committed to this plan.”

Production planning and procurement teams execute on the approved forecast, knowing it has been vetted by both demand planning and finance.

The entire cycle takes three to five days, depending on forecast complexity and business complexity. It’s not fully automated, but it’s not a spreadsheet-and-email process either. The machine learning model handles the analytical heavy lifting; human judgment handles the business context.

Getting Started Without Overhauling Your Current Process

If your organization currently uses manual forecasting or legacy forecasting tools, migrating to Dynamics 365 demand forecasting does not require overhaul on day one.

Start by running the Dynamics 365 forecast in parallel with your current process for one full planning cycle. Load several months of historical demand data into Dynamics 365 Supply Chain, configure the forecasting parameters (for example, seasonality windows, forecast time horizon), and let the model generate predictions. Compare the Dynamics 365 forecast to the forecast you would have created manually. Where do they agree? Where do they diverge, and why?

This parallel run gives you three things: validation that the model is picking up your business’s actual patterns, a baseline for measuring the model’s accuracy going forward, and team confidence that the system understands your supply picture before you make it a dependency.

Once you’re confident in the model’s direction, layer in governance. Designate a demand planning role in Dynamics 365 and grant that person permission to create forecast adjustments. Set up a simple adjustment log: which items are adjusted, by how much, and the business reason. Don’t try to perfect the process; just capture the decision.

Then pilot the forecast-to-planning integration with a subset of your highest-value items or customer segments. Run planning optimization using the Dynamics 365 forecast and compare the resulting purchase orders and production schedules to what you’re currently doing. If the plan improves (lower safety stock, fewer expedited orders, better cash flow alignment), expand the scope. If it diverges significantly from reality, investigate whether the forecast or the planning parameters need adjustment.

This three-step approach keeps risk contained while building organizational confidence that demand forecasting automation is working for you, not against you.

Conclusion

Demand forecasting in Dynamics 365 Supply Chain is a powerful tool for reducing guesswork and improving inventory efficiency. But “powerful” is not the same as “fully autonomous.” The best implementations treat the machine learning model as a rigorous analyst that handles pattern recognition at scale, paired with finance and supply chain leadership who understand the business context that no model can capture.

If your organization is evaluating demand forecasting or has already deployed it, the question is not whether to use the algorithm. It’s how to build a governance process that keeps human judgment and financial discipline in the loop without slowing your planning cycle to a crawl. Dynamics 365 makes that possible, as long as finance leaders and supply chain teams treat the forecast as input to a decision, not a decision itself.


Routeget Technologies brings enterprise Dynamics 365 implementation and optimization expertise to organizations across finance, supply chain, and customer engagement. Our consultants work with supply chain teams and finance leaders to design forecasting governance that balances automation with financial control, reducing inventory costs while improving forecast accuracy and auditability.

#DemandForecasting #DynamicsSupplyChain #InventoryOptimization #SupplyChainPlanning #FinanceAutomation #DynamicsERP #SCMStrategy