Power BI RLS at Scale: When Dynamic Row-Level Security Becomes a Bottleneck

Row-level security in Power BI seems straightforward during a pilot. You create a role-based filter on a User table, join it to your fact data, and suddenly users see only their assigned data. It works flawlessly with 10 users and a few hundred thousand rows. Then you move to production with 2,000 users and suddenly your dashboards refresh in 4 hours instead of 30 minutes, and the data warehouse query that used to run in 3 seconds now times out.

The culprit is almost always RLS implementation design, not hardware constraints or data volume. Most teams build RLS the way tutorials show: dynamic username matching against a lookup table. This pattern works until you hit scale. Once you do, the filter becomes computationally expensive, query engines struggle with the cardinality of the role definition, and your entire semantic model refresh becomes a bottleneck.

This isn’t a limitation of Power BI itself. It’s an architectural decision hiding inside seemingly innocent DAX formulas and role definitions. Get the architecture right early, and RLS scales smoothly. Get it wrong, and scaling becomes a major undertaking midway through your rollout.

How RLS Performance Actually Degrades

Most Power BI RLS implementations work by joining a Users table (containing user ID, email, username, and assigned business unit, region, or account) to your fact tables through a filtering relationship. In the role definition, you write something like:

[User_Email] = USERNAME()

This tells Power BI to filter the fact table to rows where the User_Email column matches the currently logged-in user’s email. Straightforward. But what happens underneath is what matters.

When a user opens a dashboard, Power BI doesn’t execute the RLS filter once and cache the result. Instead, the filter is embedded into every query the dashboard runs. If your dashboard has five visualizations, each visualization generates a separate query, and each query includes the RLS filter evaluated against your role definition. If your role evaluates USERNAME() against 50,000 user records to find a match, that’s 50,000 comparisons per query, times five queries, times however many concurrent users are refreshing reports at the same time.

This scales linearly downward with user count. Ten users means fifty thousand comparisons times five queries times ten simultaneous users. Two thousand users means fifty thousand comparisons times five queries times two thousand simultaneous users. The mathematics break quickly.

Additionally, most organizations layer RLS filters. You might have one RLS role for regional filtering, another for account-level filtering, and another for team assignment. Each layer adds another lookup and another set of comparisons. Three layers of RLS against large lookup tables is not uncommon, and it’s where the model refresh starts to visibly slow.

The Hidden Cost of Dynamic Username Matching

The USERNAME() function is convenient, but it’s also the root of many performance problems. USERNAME() returns the current user’s email or ID from Azure Active Directory (or whatever authentication system you’re using). That’s fine at a conceptual level. But in practice, USERNAME() is evaluated on every single row context change inside your queries.

Consider a common scenario: you have a Salesforce sync where you pull the current User table nightly. 30,000 user records. Each user has an assigned Region and an assigned Account list. Someone opens a Power BI dashboard with four visualizations. Power BI needs to execute four queries. Each query runs with RLS applied:

[UserEmail] = USERNAME()

Power BI’s query engine translates this into a filter condition in the underlying SQL or MDX query sent to your data source (whether that’s Azure SQL, Synapse, or a direct lake connection). The data engine evaluates this for every partition, for every table relationship, for every row that might match. With thirty thousand users and large fact tables, this isn’t trivial.

Then someone else logs in, and the same process repeats with a different USERNAME() value. In production, you might have hundreds of concurrent users, and each is generating this lookup and comparison overhead.

Design Patterns That Scale

The solution isn’t to eliminate RLS. It’s to change how you implement it so the filtering happens efficiently.

Pattern 1: Pre-computed Role Assignment in the Fact Table

Instead of dynamic lookup at query time, assign roles when data is loaded. Before your fact table lands in Power BI, compute which users have access to which rows and store that assignment as a column in the table itself. For example, add a column called AllowedUsers containing the user IDs or emails who can see that row. Then, in your RLS role:

[AllowedUsers] IN VALUES(...)

This is faster because you’re filtering on a pre-computed, indexed column rather than doing a lookup join at query time. The downside is that changes to user access require a full data refresh, not a runtime reevaluation.

Pattern 2: RLS at the Aggregation Layer, Not the Fact Layer

Many teams apply RLS to their most detailed fact tables. This is the most expensive place to filter. Instead, build your RLS semantics against aggregated or summarized tables. For example, if your fact table has order line-item level detail with thousands of rows per user, create a summary table at the order level, apply RLS there, and relate the detailed facts read-only. Users can’t drill below what they’re allowed to see.

Pattern 3: Role-Based Access Through a Mapping Table, Not a Lookup

Build a dedicated Role Mapping table that pre-computes which users belong to which roles. Populate it at load time, not query time. Then apply RLS against this mapping table using a relationship-based filter rather than a DAX formula:

Relationships: RoleMapping[UserID] -> FactTable[UserID]<br />RLS: [Role] = "SalesRep"

This delegates the filtering to relationship traversal, which database engines optimize heavily.

Pattern 4: Object-Level Security for Entire Semantic Model Sections

If individual row filtering becomes too expensive even with optimizations, consider object-level security. Hide entire tables, measures, or columns from certain roles. A regional sales manager might not see cost of goods or procurement details at all, not because the rows are filtered, but because those tables are invisible to them. This is blunter than row-level filtering, but it’s far more performant for large organizations.

Implementation Checklist

Before deploying RLS to production, verify:

1. Measure baseline query performance without RLS

Run your dashboards against a copy of the model with RLS disabled. How long does a refresh take? If it takes more than 30 minutes, RLS is not your bottleneck—your data model or query patterns are. Fix those first. If baseline is acceptable, proceed.

2. Identify your largest lookup table

User tables, regions, accounts, teams—whichever table you’ll use for role filtering. Count its rows. If it’s over 50,000, consider Pattern 1 or Pattern 3. If it’s under 10,000, standard dynamic username matching might be acceptable, but test at production scale first.

3. Test RLS with production user counts, not pilot counts

Set up a test model with realistic user counts. If you’ll have 2,000 users in production, create test roles for 500 of them and measure refresh time and query response. Don’t assume linear scaling. Cardinality issues often behave worse than linear.

4. Plan for re-architecture if needed

If you’re currently using dynamic USERNAME() matching against large tables, plan a migration to one of the patterns above. Don’t do this on the fly in production. Test the new architecture on a copy of the model first, measure performance improvement, then cut over.

5. Monitor refresh time trend

As your user base grows, your refresh times should not grow proportionally. If they do, your RLS implementation is hitting a wall. Catch this early, before users start complaining about stale data.

Conclusion

Power BI RLS is essential for organizations sharing a single semantic model across teams with different access rights. But RLS performance degradation is one of the most common production failures in Power BI deployments, and it’s entirely preventable with the right design pattern from the start. The difference between a dynamic username lookup against a 50,000-user table and a pre-computed role assignment is the difference between a 30-minute refresh and a 4-hour refresh once you scale.

Choose your RLS pattern based on your expected user count and role complexity before you build. Test at production scale before you roll out. And if you inherit a struggling RLS implementation, re-architecture isn’t a failure—it’s a necessary step toward a sustainable system.

#PowerBIRLS #RowLevelSecurity #PowerBIPerformance #EnterpriseAnalytics #DataSecurity #DAXOptimization #Dataverse #PerformanceOptimization

Intercompany Accounting in Dynamics 365 Finance: Why Consolidated Ledger Elimination Entries Don’t Match Subledger Details

Your company’s intercompany transactions balance perfectly within each legal entity. General ledger accounts zero out to the cent when you print a subledger report. But when you run the consolidated ledger elimination process in Dynamics 365 Finance, the elimination entries don’t match the detail you’re looking at, the reports don’t tie back, and your financial close process stalls while the accounting team investigates discrepancies that shouldn’t exist.

This isn’t a rounding error or a posting issue. Intercompany accounting in Dynamics 365 Finance operates on assumptions about how intercompany transactions flow through the chart of accounts, how elimination entries get created, and how consolidated reporting aggregates data across legal entities. When those assumptions don’t align with your actual business structure, transactions don’t eliminate cleanly, reconciliation becomes manual, and the close process loses the automation benefit that makes consolidation work.

How Intercompany Accounting Is Supposed to Work

Dynamics 365 Finance treats intercompany transactions as a special case within the general ledger. When one legal entity (the originating company) records a transaction with another legal entity (the counterparty), both sides record the transaction independently. The originating company records the full transaction amount and an intercompany payable or receivable. The counterparty records the mirror transaction and an intercompany receivable or payable. These two sides are supposed to eliminate when you consolidate.

The elimination process is straightforward conceptually: find all intercompany balances, create offsetting entries to zero them out at the consolidation level, and produce a consolidated financial statement that shows only external transactions. In practice, Finance requires you to identify which accounts are intercompany balances, set up elimination rules, and ensure that the consolidation process knows how to match and eliminate transactions.

Where things diverge from this ideal is in the details of how intercompany transactions actually map to accounts. Finance assumes intercompany receivables and payables flow through specific account structures. If your chart of accounts doesn’t follow that structure, or if your intercompany transactions post to unexpected account combinations, the elimination logic can’t find matching pairs to eliminate.

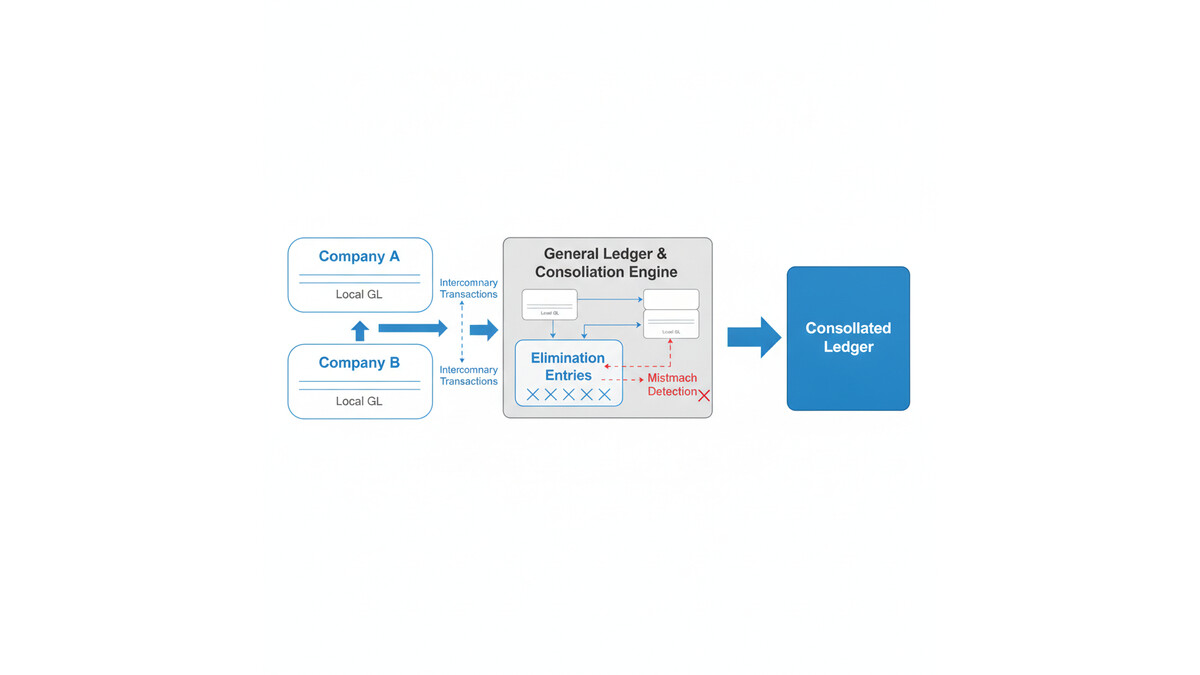
Consolidated financial reporting process showing intercompany transaction flows and elimination logic

Why Elimination Entries Don’t Match Your Subledger

The root cause usually sits in one of three places: account mapping, transaction routing, or elimination rule configuration.

Account mapping issues: Intercompany receivables and payables need to map to specific accounts that the elimination process recognizes. If your chart of accounts assigns different accounts for intercompany activity than the elimination rules expect, transactions won’t match. For example, if you have intercompany sales recorded against one receivable account but intercompany service fees recorded against another, and your elimination rules only target the first account, service fee intercompany balances persist in the consolidated ledger.

Dimensional mismatch: Dimensions are where intercompany accounting often breaks down in practice. If your originating company records an intercompany transaction tagged with a specific cost center or business unit dimension, but the counterparty company records the mirror transaction without that same dimension combination, the two entries won’t find each other during elimination. The consolidation engine can’t match and eliminate transactions that have different dimension combinations, even if the account numbers and amounts are identical.

Timing and period mismatch: Intercompany transactions posted in one period in the originating company may not be received and matched in the counterparty company until the next period. If you try to run elimination at period-end before the counterparty company has received and recorded the transaction, the elimination process will create a temporary imbalance. This is especially common in month-end closes when one entity’s period ends before another’s, or when intercompany invoices are issued late in the month.

Control account vs. detail account confusion: Many implementations assign intercompany transactions to control accounts in the general ledger but then try to reconcile using subledger detail accounts. Finance’s elimination engine works at the general ledger level, not the subledger level. If the control account total is correct but the subledger detail account distribution doesn’t match what elimination expects, you’ll see reconciliation mismatches.

How to Diagnose the Problem

Start with a simple reconciliation: for each intercompany payable and receivable account, calculate the balance in the originating company’s general ledger, then calculate the mirror balance in the counterparty company’s general ledger. These two numbers should be equal and opposite. If they’re not, the problem is upstream of the elimination process.

If the balances match, the issue is in how the consolidation process is configured. Navigate to the consolidation elimination rules in Finance and verify that the account mappings and dimension rules are set up to match your actual posting. The elimination rules should specify which accounts contain intercompany balances, how they map between legal entities, and which dimension combinations are included in the elimination logic.

A common troubleshooting technique is to export the elimination entries that Finance generated, then manually reconcile them back to the intercompany transactions in your subledger. If the elimination entries don’t match specific subledger transactions, you’ve found the problem: either a transaction posted to an account the elimination rules don’t cover, or a dimension combination that doesn’t align between the two companies.

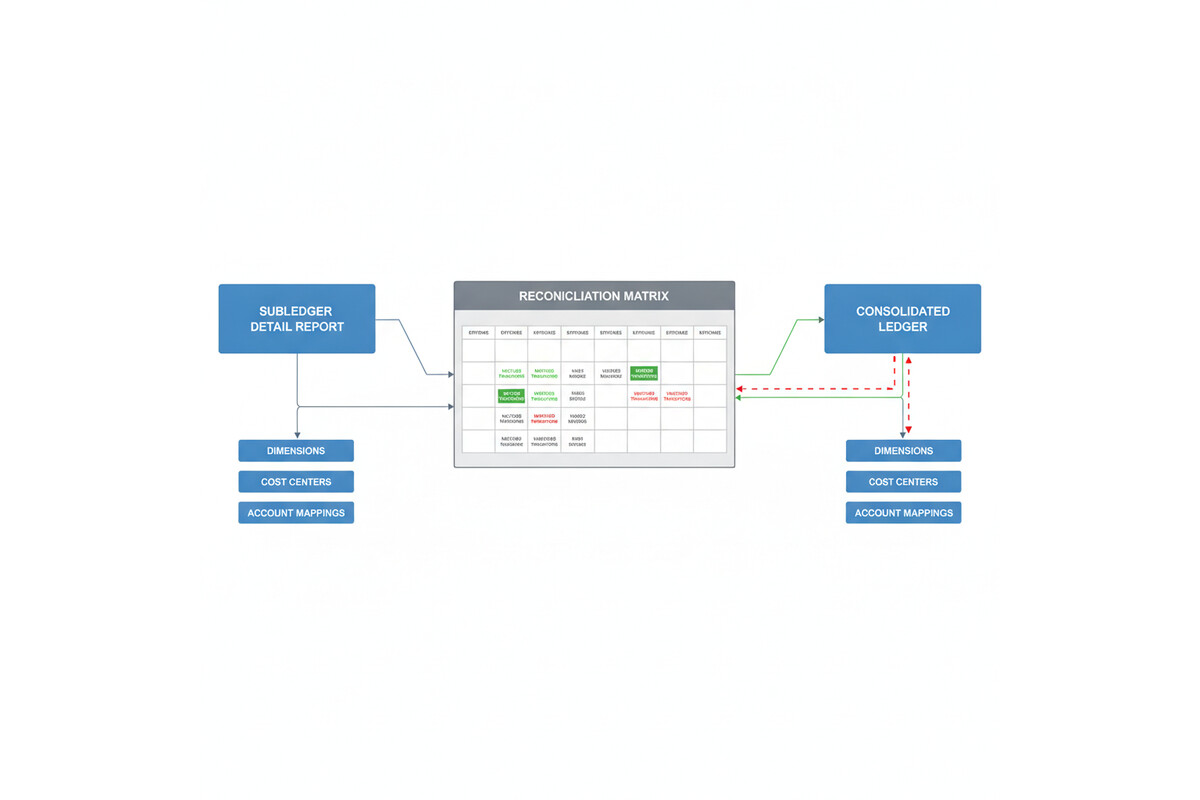
Intercompany reconciliation matrix showing matched and unmatched transaction entries

Designing Intercompany Accounting That Actually Eliminates

The cleanest approach is to standardize how intercompany transactions post across all legal entities. Define a consistent chart of accounts for intercompany receivables and payables, with the same account numbers used in every legal entity. If you use dimensions to tag transactions, establish a rule that intercompany transactions must be tagged with identical dimension combinations in both the originating and counterparty companies.

Consider whether you truly need dimensional detail on intercompany balances. Many implementations create dimensional complexity that adds no value to the intercompany reconciliation. If cost center assignment doesn’t affect how you manage intercompany payables, don’t require a cost center dimension on those transactions. Simpler account structures mean cleaner eliminations.

Set up a pre-consolidation reconciliation process in Finance. Before running elimination, generate a report of all intercompany balances, grouped by company pair, account, and dimension. Reconcile this to your subledger detail. If discrepancies appear, resolve them before you run the consolidation. This prevents the elimination engine from encountering unmatched transactions.

If you’re running multiple consolidation entities with nested parent-subsidiary relationships, test your elimination logic at each level. A common failure mode is that consolidation works correctly at the first level (subsidiary to intermediate parent) but breaks at the second level (intermediate parent to ultimate parent) because dimension combinations or account assignments drift as you go up the hierarchy.

When to Use External vs. Internal Elimination

Finance supports two elimination approaches: internal elimination (within Finance, using the consolidation module) and external elimination (in a separate consolidation tool or process). Internal elimination is simpler if your intercompany transactions follow a clean, standardized structure. External elimination is more flexible if your transactions are complex or your intercompany relationships don’t fit Finance’s default assumptions.

If you’ve been troubleshooting intercompany eliminations for months and the mismatches persist, it may be worth evaluating whether an external consolidation engine better serves your structure. Some organizations find that moving complex intercompany and consolidation logic to a dedicated consolidation tool reduces the burden on the Finance general ledger and makes the close process more transparent.

Preparation for Implementation

If you’re building an intercompany accounting structure from scratch, start by documenting your actual intercompany flow: which companies transact with each other, what types of transactions (sales, services, loans, expense allocations), and whether dimensional detail is needed on each type. Then design your chart of accounts and elimination rules to match that flow exactly.

Before you go live, run a full consolidation cycle with representative historical data. Create test transactions that cover every intercompany transaction type, post them in both the originating and counterparty companies, and run elimination. Verify that the elimination entries match the transactions you created, and that the consolidated ledger balances correctly. If you find mismatches at this point, you’re catching them before real transactions are in the system.

Assign one person ownership of the intercompany reconciliation and elimination process. That person should understand how the system is configured, have access to the elimination rules and the subledger detail, and be responsible for ensuring the process runs correctly every month. Intercompany accounting has a way of drifting if no one is explicitly in charge of keeping it clean.

Intercompany accounting is one of the places where small configuration oversights create large reconciliation problems. Taking time upfront to design and test your structure eliminates months of frustration during the close process.


Routeget Technologies: Our Finance & Operations consulting team helps enterprises design and implement intercompany accounting structures that consolidate cleanly and close on time, whether you’re building from scratch or fixing an existing implementation that’s struggling with elimination reconciliation.

#IntercompanyAccounting #Dynamics365Finance #FinanceImplementation #ConsolidatedReporting #ERPGovernance #AccountingAutomation #FinanceOperations #Dynamics365Implementation

Why Your Sales Teams Miss Account History: Building a Customer Data Foundation That Actually Works

Your sales rep is three weeks into a high-value deal. The prospect sends an email with a technical question about API integration. Your rep forwards it to the solutions architect, but there’s a gap: the solution architect doesn’t know that this same prospect raised the same concern in a customer service case six months ago, and the issue was already resolved. The rep and the architect spend two days re-solving a problem that was already closed. The deal slips by four weeks. The customer eventually buys, but at a lower margin because you spent double the resources.

This isn’t a technology failure. It’s a data foundation failure. Dynamics 365 Sales works beautifully when account history is available, connected, and accessible in real time. When it isn’t, your sales teams operate blind.

The Customer Data Foundation Problem

Dynamics 365 Sales is built for transparency. Every interaction, touchpoint, and detail about a customer should flow into a single, unified picture. In theory, your CRM contains everything: sales calls, email conversations, support cases, service interactions, contract history, purchase records, and even indirect interactions like website behavior. In practice, most organizations run multiple systems in parallel, and Dynamics 365 Sales sees only fragments.

A prospect visits your website. That behavior sits in your marketing automation tool. The same prospect opens a support ticket. That history lives in a separate service module, sometimes even a different Dynamics 365 instance. Your sales rep meets with the account team. The meeting notes go into email or OneNote, not into CRM. By the time your rep views the account record, they see a fractured picture: a contact history, some opportunities, maybe a few email messages, but no sense of the full customer journey.

The cost shows up in productivity loss, longer sales cycles, and missed upsell opportunities. More subtly, it shows up in deal risk: your sales teams make decisions based on incomplete information, leading to longer negotiations, missed risk signals, and post-sale surprises.

Why This Happens

Most organizations don’t lack a CRM. They lack a data platform that treats the customer as the central entity and routes all relevant data there automatically.

Building this requires three layers to work in concert. First, data integration: every system that touches a customer must have an automated bridge to Dynamics 365. Second, data normalization: when the same customer appears in different systems under slightly different names, identifiers, or attributes, they must be recognized as one entity before the data is merged. Third, data governance: your organization needs rules about data quality, freshness, ownership, and access, so that when sales teams see an account record, they trust what they’re seeing.

Most implementations skip or minimize one or more of these. Integration is expensive and complex, especially with legacy systems. Normalization requires understanding your data schema deeply, and many organizations have multiple schema variants across regions or business units. Governance is abstract and political; it’s hard to justify the investment before the problems surface.

The result: Dynamics 365 Sales is implemented, the basic data is loaded, and then the platform sits at a 40-50% adoption rate, with sales teams treating it as a record-keeping system rather than an operational tool.

Building the Right Foundation

A customer data platform implementation in Dynamics 365 Sales requires starting with a clear scope. Most organizations make the mistake of trying to integrate everything at once, which leads to scope creep, budget overruns, and delayed value. Instead, start by answering: which data sources touch the largest portion of your customer base, and which of those would have the highest impact on sales productivity or deal safety if that data were available in real time?

For many B2B organizations, the answer is clear: service ticket history, website engagement, and past contract terms. A sales rep should open an account and immediately know if there’s an open support ticket, whether the customer visited your website in the past week, and what the contract renewal date is. That’s table stakes. Everything else is an enhancement.

Start with those three sources. Integrate them into Dynamics 365, set up automated matching rules so that a customer in your support system is recognized as the same customer in your CRM (this is harder than it sounds), and implement a data governance rule that these three fields are always current, always trusted. Set a target: within 90 days, you want 90 percent of your active sales accounts to have historical data from at least two of these sources visible in Dynamics 365.

After 90 days, measure the impact. Did sales cycle length change? Did win rates move? Did customer acquisition cost shift? Did rep adoption of CRM increase? Don’t guess; measure it. If the foundation is working, the metrics should show improvement. If not, diagnose whether the issue is data quality, system design, or adoption, and fix the root cause before you expand.

Only after you’ve validated the value of the core foundation should you expand to other systems. That second wave might include marketing automation, accounting, or project management data. By then, you’ll have experience integrating systems, cleaning data, and managing adoption; the second and third integrations will move faster and face less internal resistance because the business already sees the return.

Implementation Considerations

Dynamics 365 Sales doesn’t provide a unified customer data platform out of the box. You’ll need to either build integration layers yourself or license a middleware platform to handle the data flow. Microsoft Dataverse, which underlies Dynamics 365, can handle the volume and complexity, but the plumbing to get data in and keeping it fresh is not trivial.

Cloud-based middleware platforms like MuleSoft, Tata Consultancy Services (TCS) iPaaS, or native solutions like Azure Data Factory can automate the flow from source systems to Dataverse. The choice depends on your technical depth, the number of source systems, and your tolerance for managed services versus internal ownership. Budget-conscious organizations often underestimate the effort here; real-world integration projects are 60-70 percent data cleaning and schema mapping, not configuration.

Data governance is the second underestimated piece. Before you integrate a data source, your organization needs to decide: who owns this data? What’s the acceptable latency? If data in the source system changes, how quickly should Dynamics 365 reflect that change? What’s the fall-back plan if the integration breaks? Who monitors it? These questions are boring, but organizations that skip them end up in situations where sales reps stop trusting the data because updates are erratic, or where the system breaks and no one notices for weeks.

Adopt an incremental approach. Start with one source system, prove value, expand carefully, and measure at each step. That’s the path to a customer data foundation that actually works.

The Competitive Advantage

When your sales teams have a complete, current picture of each account, everything changes. Your reps spend less time gathering context and more time strategizing. Your AEs shorten sales cycles because they understand account history and can speak credibly about prior interactions. Your customer success teams have better handoff information, leading to higher retention. Your account teams spot upsell opportunities they would otherwise miss because they see the full engagement history.

In competitive deals, this advantage compounds. If your sales rep knows that a competitor pitched to the same prospect three months ago but was rejected over a specific feature concern, and your company has since shipped that feature, your rep can lead with that insight. The prospect feels heard and known. That’s the difference between a deal that is hard-won and a deal that moves smoothly.

The first step is admitting that your current CRM isn’t showing you everything you need to see. The second is committing to build the data foundation that makes that visibility real. Start small, measure honestly, and build from there. Your sales teams and your pipeline will thank you.


About Routeget Technologies: Routeget helps enterprise organizations design and implement customer data platforms on Dynamics 365. If your sales teams are working blind, we can help you build the foundation to fix it.

#DynamicsCustomerEngagement #CustomerDataPlatform #SalesProductivity #Dynamics365CRM #SalesEnablement #DataIntegration #CustomerInsights #SalesStrategy

Dataverse Calculated Columns and Rollups: When Summary Data Becomes a Bottleneck

Most Dynamics 365 implementations contain at least one field that should not exist. It is usually a number that sums values from child records, or a formula that derives from related data. The reason it exists is always the same: someone wanted real-time access to that information from a parent record, without running a report or opening a separate list.

Dataverse calculated columns and rollup columns promise to solve this problem. Calculated columns apply a formula to one or more fields on the current record, showing the result live without code. Rollup columns sum, count, average, or find min/max values from related records, showing that aggregation on the parent record. Both sound straightforward in a demo. Both become serious performance liabilities in production when misapplied.

The problem is not that calculated columns or rollups are poorly designed. The problem is that their flexibility and ease of configuration make it tempting to create them for every question a user asks, and because Dataverse computes these columns synchronously during record operations, each one you add delays every operation touching that record or its related data. At scale, calculated columns and rollups can turn a fast, responsive system into one where simple form loads lag and mass operations hang.

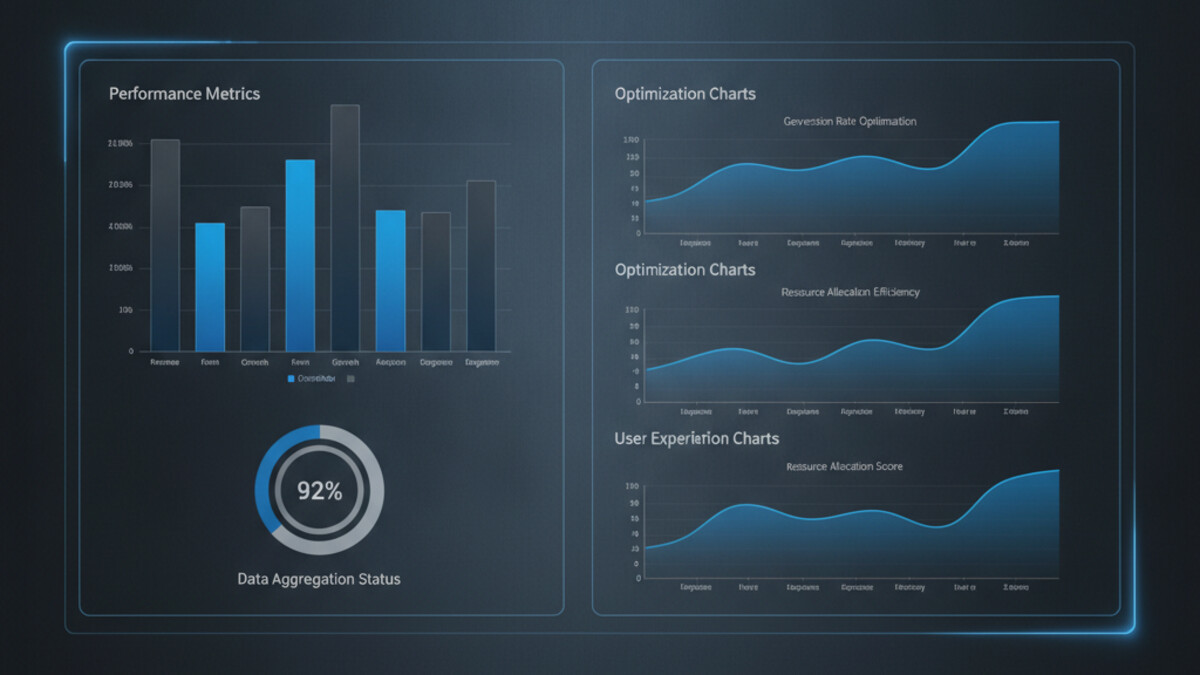
Performance metrics dashboard for database optimization

How Dataverse Calculated Columns and Rollups Actually Work

Calculated columns in Dataverse run when a record is created, updated, or retrieved. Unlike plugin code you can optimize or disable, calculated columns execute on every interaction. If you define a calculated column that divides a budget by a count of child records, that division happens every time anyone loads the form, every time a Power Automate flow retrieves that record, and every time an integration fetches the data via the API.

Rollup columns add another layer of complexity. A rollup does not just read data from related records; it must traverse a relationship, evaluate a condition on each related record, and then compute the aggregation. If you create a rollup that counts all incomplete tasks related to an account, Dataverse must walk through every task record linked to that account, check each one’s status, and return the count. On an account with 50,000 tasks, this query can take seconds.

Both calculated columns and rollups are recomputed on a schedule. Dataverse does not compute them in real-time on demand; instead, the system recalculates them asynchronously in batch jobs. This means that displayed values may not always reflect the absolute latest state of the source data. For a dashboard or a report, this lag is usually acceptable. For a workflow that needs to make a decision based on that value, the delay can cause logic to fail or bypass critical checks.

When Calculated Columns and Rollups Become Problems

Performance issues with calculated columns and rollups typically emerge at one of three trigger points.

First is load time. A form containing multiple calculated columns or rollups can take noticeably longer to render, especially on mobile or slower connections. Users perceive this as a slow or unresponsive system. The impact scales with the number of columns; a form with 2 or 3 calculated fields performs fine, but one with 10 or more can lag visibly.

Second is mass operations. Bulk operations such as Power Automate loops that create or update thousands of records will execute more slowly if those records contain calculated columns or rollups. Each record operation pays the calculation cost, so a loop that would normally complete in 30 seconds might take 3 minutes. Workflows that timeout during scheduled jobs often have calculated columns as a hidden root cause.

Third is query performance. Reports or Power BI dashboards that query many records will hit slowdowns if the records contain expensive calculated columns or rollups. The calculation must complete before the record is returned, so querying 10,000 records with heavyweight calculations forces Dataverse to compute all 10,000 calculations before the query finishes.

A fourth, more subtle issue is the logical inconsistency created by asynchronous recalculation. If a workflow reads a rollup column value, performs business logic based on that value, and then the rollup recalculates a moment later and changes, the workflow has acted on stale data. This can create gaps in audit trails or cause business logic to diverge from the actual state the user sees.

Detecting Bottlenecks

Before optimizing, you need to know if calculated columns or rollups are actually the problem. A few diagnostic approaches work.

Check the Dataverse environment’s performance reports. Look for slow-running queries or forms that take longer than expected. If a form with calculated columns loads in three seconds and the same form without them loads in one second, the columns are adding two seconds of latency. Similarly, check Power Automate run histories for timeouts or slow execution in flows that work with records containing rollups.

Enable Plugin Trace Log (under Settings in your Dynamics environment) and examine traces for records being retrieved with calculated columns. Look at the duration of retrieve operations; if simple record retrievals are taking longer than 500 milliseconds, calculated or rollup columns are a likely culprit.

Query the Dataverse API directly with and without calculated columns in the result set. Use select parameters to request only the columns you need. If adding a calculated column to the query selection significantly increases response time, you have confirmed the issue.

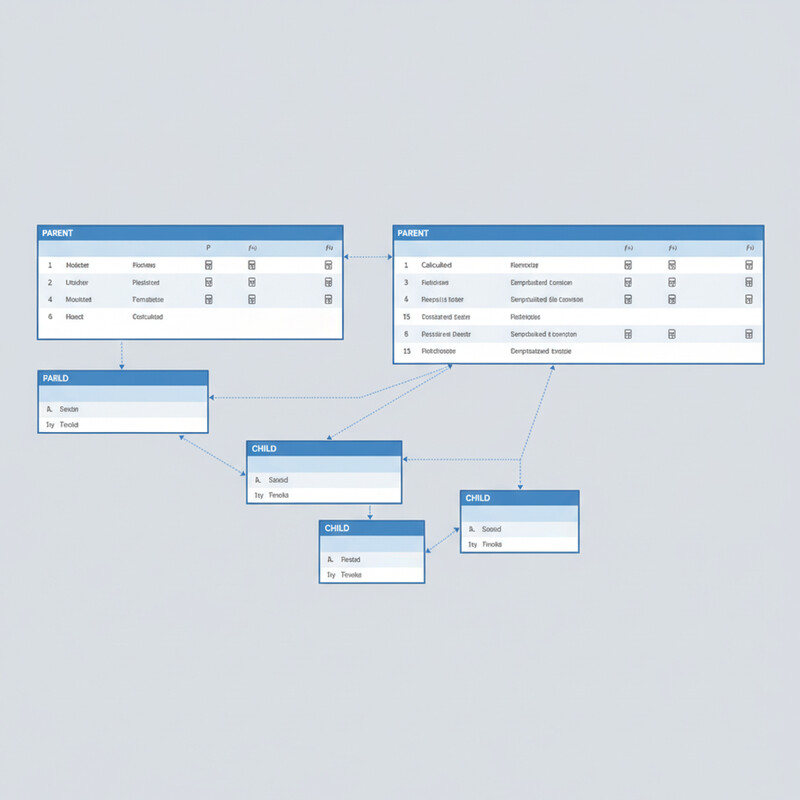
Database schema showing parent-child record relationships and calculation flows

Alternatives to Calculated Columns and Rollups

If you have identified a bottleneck, you have several options. The best choice depends on your specific scenario.

Use plugins or Power Automate to calculate on demand. Instead of computing the value every time a record is retrieved, calculate and store it only when necessary. A plugin triggered on form load can calculate a summary and display it in a banner, showing fresh data without impacting record retrieval. A Power Automate cloud flow can run on a schedule to update rollup values once per hour or once per day, depending on your tolerance for staleness. This approach keeps the permanent record lean.

Move calculations to the reporting layer. Power BI does not care if a column is calculated in Dataverse or computed in the dataset; the result looks the same to an end user. Create a calculated column in a Power BI dataset instead of in Dataverse, and use that column only for dashboards and reports. Forms and integrations get the base data without calculation overhead.

Use views and roll-up jobs sparingly. If you do use rollups, create them for only the most critical summaries. A single rollup that counts open orders on an account is reasonable; four rollups that count open orders, sum order amounts, calculate average order value, and find the date of the latest order should be four separate on-demand calculations in Power Automate or a custom plugin.

Denormalize selectively. For high-cardinality relationships (an account with tens of thousands of related records), consider storing pre-calculated values in a separate summary table updated by a scheduled batch process, rather than relying on Dataverse to calculate them live. This trades a small amount of design complexity for significant performance gains.

Production-Ready Patterns

In practice, high-performing Dataverse implementations keep calculated and rollup columns minimal. A good rule of thumb: if a column is not displayed on a form or used in a critical workflow decision, it should not exist as a calculated or rollup column.

When you do create them, profile the specific form or report where they appear. Measure load time before and after; if latency increases by more than 200 milliseconds per column, investigate alternatives. For rollups, test with realistic data volumes; a rollup that works fine with 100 related records may not work at all with 10,000.

Document which forms, reports, and integrations depend on each calculated or rollup column. This becomes essential when troubleshooting slow operations; knowing that a dashboard uses a particular rollup helps you understand why it is not refreshing quickly.

Finally, review calculated and rollup columns every few months. As your implementation matures and data volumes grow, columns that performed acceptably in early stages may become bottlenecks. Removing a column that no longer serves a critical business purpose often has an immediate, measurable impact on overall system responsiveness.

Calculated columns and rollups are powerful tools when used deliberately. They become performance anchors when used casually. The teams that manage Dataverse best treat them not as convenience features, but as performance decisions that must be justified by real business need and validated through testing at production scale.


#DataversePerformance #CalculatedColumns #RollupOptimization #DataverseTuning #Dynamics365Performance #CloudArchitecture #DataverseArchitecture #SystemPerformance

Business Central for Growing Manufacturers: Why Your ERP Doesn’t Need to Cost $500K/Year

“

Why Legacy ERP Cost So Much

\n\n

On-premises ERP systems impose costs at three points that most CFOs misunderstand until they are deep into a migration project. First, there is the initial software license cost, which for large suites often runs between fifty and one hundred fifty thousand dollars upfront, plus annual maintenance fees that compound every year. Second, and more significant, is implementation cost. A team of five consultants embedded for twelve to eighteen months at typical rates adds two hundred to three hundred fifty thousand dollars, sometimes more.

\n\n

Third, and often overlooked, is the ongoing operational cost. On-premises systems require dedicated infrastructure, whether owned or leased. Database administration, system patching, security monitoring, and backup management all fall to your IT team. A medium-sized manufacturer typically allocates at least one full-time employee, sometimes more, to keep the system running, preventing outages, and managing infrastructure growth as data volume increases.

\n\n

The perpetual license model also creates a perverse incentive to extend the useful life of outdated systems. Once you have spent half a million dollars, retiring the system in five years feels wasteful. So manufacturers keep systems in production for ten, twelve, or fifteen years, long past the point where modern capabilities could improve operations. Meanwhile, the system becomes increasingly fragile. Every upgrade risks instability. Reporting requires manual steps because the database schema no longer accommodates new business logic. Integration to modern tools like Microsoft Teams or Power BI requires custom bridges that consume engineer time.

\n\n

Business Central breaks this cost structure at every stage.

\n\n

Business Central’s Cost Foundation

\n\n

Business Central runs on the cloud, which means no infrastructure cost for you to manage. Microsoft owns and maintains the servers, databases, backup systems, and security infrastructure. Your finance and operations team still has full access to configuration, reporting, and business logic customization. But the system administration overhead shifts to Microsoft.

\n\n

The licensing model reflects this shift. A Business Central user license currently runs between $50 and $140 per month depending on the tier, with no perpetual license, no infrastructure fee, and no hidden per-transaction cost. A typical mid-market manufacturer with 100 to 150 active users in finance, operations, supply chain, and manufacturing would spend $60,000 to $250,000 annually on user licenses. Compare that to the upfront costs of enterprise ERP, and the difference is immediately clear: Business Central’s annual cost can be lower than the implementation cost of older systems.

\n\n

The implementation timeline for Business Central also compresses dramatically. A well-scoped Business Central implementation for a manufacturer typically completes in four to eight months, not eighteen. Core financial management, inventory control, and basic manufacturing production scheduling can be operational within that timeframe. A smaller implementation might need only four weeks to three months. That speed exists because the system arrives with reasonable defaults for standard business processes. You are not building a system from scratch. You are configuring a system that already understands accounts payable, inventory valuation, and bill-of-materials logic because that is what every manufacturer needs.

\n\n

A typical Business Central implementation for a mid-market manufacturer might engage two to four consultants for four to six months, which translates to $80,000 to $240,000 in consulting services, depending on regional rates and the extent of custom reporting or integration needs. For comparison, that is in line with the annual ongoing cost of maintaining a legacy system with dedicated IT staff, and you are paying it once, not every year indefinitely.

\n\n

What Business Central Gives You

\n\n

The faster implementation and lower ongoing cost matter only if the system delivers the capabilities a manufacturer actually needs. Business Central includes standard functionality for the core business processes that define manufacturing operations.

\n\n

Financial management in Business Central covers general ledger accounting, accounts payable, and accounts receivable without requiring custom configuration. Multi-company consolidation is built in, which matters to organizations with multiple manufacturing facilities or regional operating entities. Tax calculation integrates with native modules, and the platform supports multiple currencies and statutory reporting requirements across different countries, important for manufacturers with any international operations or sales.

\n\n

Inventory management handles lot tracing, serial number tracking, and expiration date management, all capabilities required by regulated manufacturers. The system supports standard costing, moving average, FIFO, and other valuation methods. Cycle counting, physical inventory reconciliation, and intercompany inventory transfer all work without custom code.

\n\n

Production scheduling and shop floor management in Business Central use visual production scheduling, work center definitions, and routing setup. The system calculates material requirements based on bill-of-materials structures and translates production schedules into purchase orders for raw materials. For job shops or custom manufacturers, production orders can be linked to sales orders, so each job’s profitability is tracked separately.

\n\n

Purchasing and supplier management allow you to define purchase agreements, track supplier performance, and manage invoice matching. Multi-level approval workflows prevent unauthorized spending.

\n\n

What Business Central does not include, and what some larger manufacturers require, is distributed manufacturing across a complex supply network, advanced demand planning with statistical forecasting, or deeply customized shop floor control logic. If your manufacturing operation is relatively standard, if you make primarily to stock or engineer to order without extreme complexity, if you operate one or two facilities, Business Central will fit. If your operation requires the scale of Dynamics 365 Supply Chain Management to manage global supply networks or highly complex planning logic, Business Central is not the answer.

\n\n

The Real Cost Comparison

\n\n

A manufacturing organization with 150 active users, a single factory, and standard ERP requirements might spend:

\n\n

With Business Central: $180,000 annually on user licenses (150 users times $120 per month times 12 months divided by 12), plus $150,000 in implementation consulting over four months, for a total first-year cost of $330,000. Year two cost drops to $180,000 annually since implementation is complete.

\n\n

With enterprise ERP on premises: $150,000 in perpetual software licenses, $300,000 in implementation consulting over 18 months, $80,000 annually for database administration and infrastructure management, and miscellaneous annual maintenance and upgrades. Year one cost is $430,000; every year after is $230,000 indefinitely.

\n\n

By year three, the organization using Business Central has spent $690,000 total. The organization using enterprise ERP has spent over $890,000 and will spend $230,000 every year going forward. The payback period for migrating to Business Central, if that option exists, is typically between three and four years for a mid-sized manufacturer.

\n\n

That financial calculation assumes the enterprise system remains operational without major problems, major upgrades, or unexpected infrastructure failures, which is not always realistic for fifteen-year-old systems.

\n\n

Beyond the Initial Implementation

\n\n

Business Central also integrates directly with Microsoft 365 and Power Platform tools, which many manufacturing organizations already use for email, collaboration, and office productivity. Accounting data can be analyzed in Power BI without additional ETL or data warehouse setup. Office integration means finance teams can work with Excel, Word, and Teams directly with ERP data without exporting and re-importing.

\n\n

If a manufacturer later needs to scale, Business Central can coexist with Dynamics 365 Supply Chain Management or Finance and Operations for specific functions. A common pattern is to run Business Central for accounting and operations, then layer Supply Chain Management on top if manufacturing complexity or global supply network needs increase later. That staged approach spreads capital expenditure over time and allows you to prove ROI before investing in enterprise licensing.

\n\n

When Business Central Is Not the Right Answer

\n\n

For extremely high-volume manufacturers, organizations with complex engineering-to-order processes, or manufacturers operating hundreds of facilities across different regulatory jurisdictions, Business Central’s simpler data model and configuration limits may become constraints. Dynamics 365 Supply Chain Management and Finance and Operations exist for those scenarios. But those scenarios represent a small fraction of manufacturers.

\n\n

For the mid-market manufacturer currently on an outdated system, believing that only enterprise ERP justifies modernization, the real question is not whether Business Central is capable enough. It almost certainly is. The question is whether staying on legacy infrastructure is really more cost-effective than moving forward. For most manufacturers, the answer is no.

\n\n


\n\n

#BusinessCentralERP #ManufacturingERP #Dynamics365CloudERP #SMBERPSolutions #ManufacturingCostReduction #CloudAccountingSystems #Dynamics365BusinessCentral #ERPImplementation

\n”

Building Enterprise AI Plugins for Copilot Studio: When Prompt Engineering Stops Working

Your Copilot Studio instance has been live for three months. The generic responses work fine for routine customer questions. Finance users can ask about invoice status, support teams can access knowledge articles, and operations can trigger basic workflows. Then a regional finance controller asks the system to calculate cross-border tax liability on a specific transaction type, and the Copilot returns something confidently wrong. You prompt-engineer for two weeks, add retrieval augmented generation, feed it more context documents. The Copilot still hallucinates because the business logic you need is not in any training data and cannot be reliably expressed as plain-language instructions. This is the moment you need custom AI plugins.

Copilot Studio has become the dominant interface for enterprise AI in Microsoft’s ecosystem. It handles conversation orchestration, knowledge integration, and basic AI coordination reasonably well. But enterprises running this platform often discover a hard boundary: Copilot’s core language models and retrieval pipelines, however well-prompted, cannot reliably execute business logic that requires domain-specific reasoning, real-time calculation, or proprietary algorithms. At that point, the architecture choice is clear. You build a custom plugin that encapsulates your logic, expose it to Copilot through the API, and let Copilot handle the conversation while your code handles the reasoning.

The boundary between prompting and programming

The first question teams ask is practical: when should we stop refining prompts and start building a plugin? The answer depends on measurability and consistency. If the Copilot’s output accuracy has reached a plateau after refinement, and accuracy is below your business threshold, a plugin is justified. If the required logic involves calculations, date arithmetic, multi-step conditionals, or reference data lookups (like product pricing, tax rates, or inventory counts), those belong in code, not prompts. If the same request returns different answers depending on minor variations in phrasing, or if the Copilot sometimes invents plausible-sounding answers rather than admitting it cannot answer, those are signals that the language model is not the right tool for that part of the workflow.

Consider a typical scenario: a Dynamics 365 Finance user asks Copilot about available cash in a specific cost center, accounting for committed purchase orders and pending payroll. The Copilot needs to query Dynamics, aggregate real-time data, apply business rules about what counts as committed, and return a specific number. Prompting the Copilot to do this might work in a demo. In production, with thousands of daily queries across different cost centers, exchange rates, fiscal calendars, and policy variations, a language model will eventually return incorrect numbers, usually with complete confidence. A plugin solves this by running the exact query and calculation logic every time, leaving the Copilot to handle the conversation and formatting.

Plugin architecture in Copilot Studio

Copilot Studio plugins connect to external APIs. That external API can be anything you build: a cloud function, a containerized service, a Logic App with Power Automate, or a .NET Azure Function. The Copilot describes what it wants to do (based on the conversation context), the plugin action is triggered, your code executes, and the result is returned to the Copilot for further conversation.

The simplest architecture is a single Azure Function or cloud function (AWS Lambda, Google Cloud Functions) that accepts a JSON request from Copilot and returns a JSON response. The function can call Dynamics 365 APIs, query a database, call third-party services, or execute business logic. From Copilot’s perspective, it simply sends a request and gets back structured data.

For enterprise scenarios, though, you need to think about authentication, rate limiting, audit logging, and error handling. Copilot can send requests at high volume during peak usage. Your plugin needs to handle this without degrading Copilot’s response time or running up costs. You should implement proper logging of what Copilot requested, what your code returned, and any failures, so you can debug issues later. You should also plan for security: the plugin is exposing business logic and potentially sensitive data (cost center balances, tax calculations, procurement data). Access should be restricted to authenticated users, requests should be validated, and responses should be filtered by role so users only see what they are authorized to see.

Real-world plugin implementation patterns

A common pattern is the data enrichment plugin. Copilot receives a user’s question about a purchase order. The Copilot extracts the order ID or vendor name from the conversation, calls your plugin, and the plugin queries Dynamics 365 Supply Chain Management to return order status, delivery dates, budget allocation, and any policy exceptions. The Copilot then uses this structured data to answer the user’s question accurately. Without the plugin, the Copilot might guess or confuse details from different orders.

Another pattern is calculation and validation. Finance teams often need to validate transaction proposals before they are committed. A user might ask Copilot whether a specific expense is compliant with policy, and Copilot needs to check the expense amount against the cost center budget, the employee’s spending tier, the transaction category, and any special approvals in place. This logic is too complex and too sensitive for a language model to handle. A plugin runs the exact validation rules and returns yes or no with an explanation of which rule applies.

A third pattern is workflow initiation. Copilot can receive a user’s request to approve a contract, create a purchase requisition, or escalate an issue. Instead of trying to directly modify systems, Copilot calls a plugin that creates a structured request in your workflow engine (Power Automate, Logic Apps, or a custom orchestration service), which then handles the actual business process with proper audit trails, notifications, and approval chains.

Failure modes and production lessons

The most common failure in production is latency. A Copilot session timeout is usually 30 seconds. If your plugin takes 15 seconds to execute (because it is doing multi-step Dynamics queries or waiting for external services), Copilot will time out before your plugin even returns. You need to either cache data, run asynchronous jobs, or redesign the plugin to return partial results and update the Copilot UI after the full result arrives. Teams that skip this step often end up with Copilot sessions that fail silently or time out repeatedly in production.

A second failure mode is incomplete error handling. A plugin fails (database is down, Dynamics is temporarily unavailable, an API call returns an unexpected error). The plugin should catch this, log it, and return a clear error response to Copilot, not crash or hang. Copilot should then explain to the user that it could not retrieve the data and suggest alternatives (like checking the system status page or contacting support). Without this, users see broken Copilot sessions with no explanation.

Authorization is a third area. Your plugin receives a request from Copilot that includes the user’s identity. Your plugin must verify that this user is actually authorized to see the data they are asking about. If your plugin does not check authorization, users can escalate privileges by asking Copilot for data they would not normally have access to. This is a security and compliance issue, especially in regulated industries like finance and healthcare.

Choosing between custom development and pre-built AI services

Microsoft’s AI Builder sits between pure prompting and custom plugins. AI Builder lets you build models that can do optical character recognition, sentiment analysis, or predictive scoring, and expose these as Copilot actions. For some use cases (document classification, customer sentiment analysis, basic prediction), AI Builder is sufficient and faster to build than a custom plugin. But for complex business logic, multi-step reasoning, or calculations with regulatory requirements, a custom plugin is necessary because you control exactly what the code does and can audit every decision.

Deployment and monitoring

Once a plugin is built, it should be versioned and deployed through your standard application lifecycle management pipeline. Changes to plugin logic should go through testing and approval before hitting production. You should have monitoring in place: track response times, error rates, and plugin usage patterns. Set up alerts if response times exceed thresholds or error rates spike. Log every request and response (at an appropriate detail level, respecting privacy) so you can audit what Copilot asked, what your plugin returned, and whether the result was accurate.

This monitoring becomes particularly important when Copilot’s behavior changes. If Copilot suddenly starts calling your plugin more frequently or with different inputs, your plugin needs to handle it gracefully. If a new version of Copilot changes how it describes requests, your plugin should either adapt or return a clear error rather than silently misinterpreting the request.

Conclusion

Copilot Studio is effective at conversation and orchestration, but it is not a replacement for business logic. Custom AI plugins let you draw a clear line: Copilot handles the conversation and user interaction, while your code handles the reasoning, calculation, and access control. This division of labor produces systems that are both more accurate and more maintainable than trying to encode all business logic as prompts. The engineering effort to build a plugin is real, but for any enterprise scenario involving calculations, multi-step reasoning, or regulated data access, the plugin approach is the right architecture choice.

#CopilotStudioAI #AIPlugins #EnterpriseAI #PowerPlatform #CustomAIPlugins #Dynamics365AI #CloudArchitecture #PluginArchitecture

AI Builder Document Intelligence: Why Your Finance Team Still Manually Keys 2,000 Invoices a Month

AI Builder Document Intelligence: Why Your Finance Team Still Manually Keys 2,000 Invoices a Month

For most large enterprises running Dynamics 365 Finance, accounts payable looks straightforward on paper: invoices arrive, they get matched to purchase orders, approvals happen, payments post. In practice, the first step is where the actual work lives.

An average mid-market organization processes 2,000 to 5,000 invoices per month across dozens of vendors. Each arrives in a different format, with fields in different positions, sometimes with missing data. A finance team that tries to automate this early usually concludes it is not worth the engineering effort. The result is a process that remains almost entirely manual: an AP clerk opens an email, scans an attachment, reads the invoice line by line, and keys data into the ERP by hand.

The financial impact compounds invisibly. A clerk processes around 30 to 50 invoices per day. That is 8 to 10 minutes per invoice of pure data entry, plus rework for errors. Across 2,500 monthly invoices at an average of 40 minutes per invoice, you have roughly 1,667 labor hours per month, or 8 to 10 full-time equivalent staff just feeding data into your ERP. The opportunity cost is real: those people are doing work machines could do better.

Intelligent document processing has existed for years, but it historically demanded custom machine learning expertise or vendor lock-in to specialized platforms. AI Builder changes that. It is a low-code intelligent document processing engine built directly into the Power Platform and accessible through Microsoft Dataverse. Using AI Builder’s document intelligence model, you can teach a system to extract data from invoices, POs, or receipts, and have that extracted data automatically flow into Finance and Operations as journal entries, vendor invoices, or line items, without custom code or a separate platform.

The catch is that most implementations get the architecture wrong, deploy too early, or do not think through the business case clearly enough to justify the investment.

What AI Builder Document Intelligence Actually Does

AI Builder’s document intelligence model learns patterns from example documents. You supply 5 to 100 sample invoices, mark the specific fields you want extracted (invoice number, date, line item amounts, vendor name, cost center), and AI Builder trains a model. Once trained, it processes new invoices and extracts those fields with a confidence score for each value.

The extraction outputs structured data as JSON, which flows into Power Automate, passes to Dynamics 365 through REST APIs, or writes directly to Dataverse tables. You can build an approval workflow where extracted data is reviewed by humans, corrections are made if confidence scores are low, and once approved, the invoice posts without manual rekeying.

The critical limitation: AI Builder solves data entry, not the entire AP transformation. It does not solve the three-way match or reconciliation of discrepancies between invoice amounts and actual receipts. If invoices regularly have billing errors or missing line items, AI Builder will extract those discrepancies accurately, but human approval workflows are still required to investigate.

AI Builder also assumes reasonably stable vendor populations. If vendors send different invoice formats month to month, or you have 200 vendors across five countries with different field positions, you may need multiple models or a more flexible extraction architecture.

The Actual Implementation Costs

The common mistake is to assume that because AI Builder is “low code,” implementation cost is proportionally low. It is not.

Training a single AI Builder model requires deciding which fields are worth extracting, building a training set, and determining how much format variance the model needs to handle. You cannot build a generic model across all vendors. You have to scope it precisely. Multiple vendor formats require multiple models or accepting lower confidence scores and higher downstream rework.

The real cost sits in the integration layer. You need a Power Automate flow that ingests documents, calls the AI Builder model, handles extracted data, performs validation and enrichment (cost center lookups, amount threshold checks, purchase order verification), and posts data into Dynamics 365 Finance. That flow needs error handling, logging, and exception routing for human review. You also need to decide where documents come from: email, OneDrive, a vendor portal. Each source requires a different ingestion pattern.

A medium-complexity invoice processing automation project involving 5 to 10 major vendors, one AI Builder model, and robust Power Automate orchestration typically runs 6 to 12 weeks, roughly 300 to 600 professional services hours. At 200 USD per hour fully loaded, that is 60,000 to 120,000 USD. AI Builder licensing is usage-based at roughly 0.01 to 0.02 USD per page. An organization processing 2,500 invoices per month with 3 pages each processes 90,000 pages annually, costing 900 to 1,800 USD in consumption.

But labor savings are substantial. Saving 1,667 hours per month at 45 USD per hour fully loaded equals 75,000 USD monthly, or 900,000 USD annually. Even if net savings are 70 percent of that due to exception handling and ongoing overhead, you still have 630,000 USD in annual labor savings against a 120,000 USD implementation cost. Payback happens in 2 to 3 months.

Those numbers are achievable if, and only if, you have a focused vendor population, reasonably consistent invoice formats, and a clear baseline for how much time the manual process actually consumes. Many organizations skip that baseline measurement, build the system anyway, and then cannot measure whether it actually saved time.

Common Failure Modes

The most common failure is misalignment on scope. Finance wants to automate “all invoices.” Engineering builds one model for all vendor formats. The model trains on 50 random invoices from 20 different vendors. When it encounters a new vendor invoice, confidence scores are low, and the entire pile ends up in the exception queue. The fix: scope tightly. Start with 3 to 5 major vendors representing 40 to 60 percent of volume. Get those working first. Add additional vendors only after the core extraction pipeline is mature and stable.

The second failure is underestimating validation and enrichment workload. Once you extract data, you need to validate it. Does the date make sense? Is the vendor in the master list? Is the amount within normal range? If any check fails, the invoice needs review. Without a validation layer, you have not saved labor; you have shifted it from data entry to exception handling.

The third failure is publishing to Dynamics 365 without handling master data dependencies. A vendor invoice requires valid vendor master records, cost centers, and often purchase order references. Incomplete or inconsistent vendor master data means extraction works perfectly but posting fails because the vendor cannot be resolved. This shows up as an AI Builder problem when implementation teams do not plan for data quality prerequisites upfront.

When AI Builder Works

The use cases with clear ROI are relatively specific.

The strongest case is a company with a stable vendor population where the top 10 to 20 vendors represent 70 percent of invoice volume and use consistent invoice formats. Train one or two models for those top vendors, automate their extraction entirely, and you have converted 70 percent of invoice volume from manual to automated. The remaining 30 percent stay manual, but you have cleared the decks of high-volume repetitive work.

The second strong case is an ERP migration where the existing system has data entry backlogs. Using AI Builder to accelerate historical invoice loading during migration can meaningfully shorten timelines. Post-migration, you keep the system running for ongoing automation.

The third case is significant localization requirements, where invoices come from subsidiary companies in multiple countries and languages. AI Builder’s multilingual capabilities handle non-English documents, so you can build a single orchestration layer that routes invoices by language, extracts data consistently, and maps that data to the right cost centers based on geography.

Measuring Before Committing

Before starting, measure three things.

First, measure current invoice processing with precision. How many invoices per month? Average time per invoice from receipt to posting, broken down by task (data entry, validation, research, approval, posting)? Error rate and rework volume? These numbers should come from actual time tracking, not estimates.

Second, identify scope. Which vendors represent the top 50 percent of volume? Are their formats consistent month to month? If you extracted 20 sample invoices from your top 10 vendors, how much variation would you observe in field positions? This informs whether you need one model or multiple models.

Third, confirm you have people and tools in place. AI Builder handles extraction, but you still need a Power Automate designer, a Dynamics 365 developer, and ongoing operational ownership for the flow. If you would need to hire these resources, that cost belongs in the implementation budget.

With those measurements, the business case becomes concrete. You can calculate labor savings per month against implementation cost and decide with confidence whether the project pencils out.

AI Builder document intelligence is not a panacea for AP efficiency, but in focused scope with stable vendor populations and consistent invoice formats, it solves a real problem that costs most large enterprises hundreds of thousands of dollars per year in pure human labor. The implementation requires clarity on scope, attention to data quality, and realistic expectations about exception handling. But for the right use case, the ROI is compelling enough to build into your Dynamics 365 Finance roadmap.


Hashtags: #AIBuilder #DocumentIntelligence #InvoiceProcessing #DynamicsFinance #FinanceAutomation #DynamicsFinanceOps #RPA #PowerPlatform

Power Apps Canvas App Performance: Why Complex Apps Freeze When Users Scale

Power Apps canvas app performance optimization dashboard

“

Your production Power Apps canvas app works fine in your test environment. It handles three users, fifty data sources, and a complex UI with nested galleries and inline filters without breaking a sweat. Then, on day one of rollout, fifteen users log in simultaneously, and the app becomes unusable. Forms take twelve seconds to load. Button clicks hang for five seconds. The gallery that renders customer records falls back to client-side filtering because the data query timed out.

\n\n

This is not a platform limitation. Power Apps canvas apps can handle production workloads at meaningful scale. What you are seeing is the collision between how Power Apps executes client-side logic and how most teams design their applications without accounting for that execution model.

\n\n

The Root Cause: Client-Side Rendering and Serialization

\n\n

Canvas apps run fundamentally differently from web applications or model-driven apps. Every formula, every query, every filter logic executes on the user’s client device, not on a server. That architecture means your app’s performance depends directly on the client’s machine and network.

\n\n

When you add a data source to a canvas app, Power Apps does not just connect to Dataverse. It establishes a live connection that allows every formula in your app to query that source on demand. If you have a gallery that displays customers, a dropdown that filters by region, a text input that searches by company name, and a form that shows order history, those are potentially four independent data queries running every time the app loads or a user interacts with a control.

\n\n

The performance breakdown happens during what the platform calls \”serialization\”. Before Power Apps can display a record or filter a dataset, it must convert the data from Dataverse’s native structure into a format the client-side runtime can work with. For datasets with thousands of rows, that conversion takes time. More critically, every formula that touches a data source triggers its own serialization cycle. If your app has ten formulas that all reference the same Dataverse table, Power Apps must serialize that data ten times unless you use specific optimization patterns.

\n\n

\"Technical

\n\n

Where Filtering Fails: Server-Side vs. Client-Side Logic

\n\n

Here is where most performance problems originate: teams build apps that look correct, pass testing, and then collapse under real-world usage patterns because filtering happens on the client side instead of the server.

\n\n

Suppose you build a canvas app that displays a gallery of orders. Your gallery formula looks like: Filter(Orders, Status = DropDownStatus.Value). This appears efficient. You are filtering by a user selection. In reality, Power Apps first retrieves every order record from Dataverse, serializes the entire dataset on the client, then applies the filter in the browser. If your Orders table has 50,000 records, the app must pull all 50,000 records, serialize them, then filter to the 200 that match the selection. At that scale, this takes seconds, and if multiple users do this simultaneously, their network connections and client machines are all fighting for bandwidth and processing power.

\n\n

The solution is straightforward but requires changing how you structure your data queries. Instead of filtering after retrieval, you build the filter into the query itself using Power Apps’ connector syntax. A Dataverse connector formula that incorporates a filter directly into the retrieval statement looks like: Search(Orders, DropDownStatus.Value, \”Status\”). Power Apps sends this as a query to Dataverse, not to the client. Dataverse performs the filter before returning data. The app receives only the matching records, serializes only what it needs, and displays results in milliseconds even at scale.

\n\n

The difference is not marginal. The gap between client-side filtering and server-side filtering on a table with 10,000 records is the difference between a three-second load and a sub-second load. At 50,000 records, it is the difference between a hung interface and a responsive one.

\n\n

Data Sources and Query Optimization

\n\n

Canvas apps allow you to connect to multiple data sources simultaneously. Dataverse, SharePoint, SQL Server, Excel, external APIs through connectors. The flexibility is valuable; the performance cost of misusing it is severe.

\n\n

Each data source connection adds to the app’s startup cost. When the app loads, Power Apps must establish connections to every source you have used, even if the user does not navigate to a screen that uses that source. If your app has connections to six data sources and only uses four on the initial screen, those two unused connections still add latency to the first load.

\n\n

Worse, if your OnStart formula attempts to preload data from multiple sources, the load time becomes the sum of every query. If each query takes one second, your app takes five seconds to become usable. Add a ten-second timeout for a slow network connection, and your users wait that duration before seeing anything.

\n\n

The optimization approach is specificity. Load data only when needed, not on startup. Use button press events to trigger data retrieval rather than formulas that run when the app initializes. If you need data available immediately, implement a background load that fetches data after the initial interface renders, so the UI becomes interactive faster.

\n\n

Another common mistake is using the same data source connection for multiple independent queries. Suppose you have a single Dataverse connection and three different galleries on the same screen, each with a different filter. Power Apps may queue those queries or attempt to execute them in parallel, depending on the platform load. Under load, they serialize, and each waits for the previous to complete.

\n\n

Split this into three distinct queries using View filters or connector-level filtering, so each query is independent and the platform can optimize execution. The number of queries matters less than their independence and specificity.

\n\n

Nested Controls and Rendering Complexity

\n\n

Canvas app performance also degrades with UI complexity. Galleries within galleries, nested containers, forms with dozens of fields, and conditional visibility logic across multiple controls consume client-side resources quickly.

\n\n

Consider a gallery that displays a list of customers. Inside that gallery, each row contains a nested gallery of orders for that customer. When the outer gallery renders 20 rows, and each row triggers a nested gallery query, the app is running 20+ queries simultaneously. If each query takes 500 milliseconds, the nested galleries take ten seconds to fully render. Users see a partial interface, then fields populate gradually as nested queries complete.

\n\n

The performance cost of nested galleries is compounded by the fact that each nested gallery runs queries independently. Unlike server-side joins, which a SQL database performs as a single operation, nested galleries in Power Apps are a series of sequential and parallel queries on the client.

\n\n

The mitigation strategy depends on your scenario. If you truly need nested data, consider using a model-driven app instead, which executes queries server-side and handles nested relationships more efficiently. If a canvas app is required, limit nesting to one level, implement pagination so only visible rows query their nested data, and use delegation-aware formulas that tell Power Apps to push the nested query logic to the data source instead of executing it on the client.

\n\n

Testing at Scale

\n\n

Testing a canvas app with three users and 1,000 test records tells you nothing about its performance with 30 users and 100,000 production records. Teams often discover performance problems on launch day because they did not test at realistic scale.

\n\n

Before rolling out a production app, stress-test it with the expected peak concurrent user load and the actual data volume. If you expect 25 concurrent users and your Dataverse table has 50,000 records, your test environment must reflect that. This means populating test tables with production-scale data and asking multiple testers to log in and use the app simultaneously.

\n\n

Pay attention to what happens during those peak loads. Which operations slow down. Which queries time out. Whether the app becomes unresponsive or degrades gracefully. These observations guide your optimization priorities.

\n\n

Practical Optimization Checklist

\n\n

Apply these patterns to avoid the most common performance pitfalls. First, push filtering and sorting to the data source, not to the client. Use connector-level query parameters instead of post-retrieval formulas whenever possible. Second, minimize startup data retrieval. Load only what is necessary on app start, and defer everything else. Third, avoid nested galleries. If nested data is unavoidable, implement pagination and lazy loading. Fourth, limit the number of data source connections and preload only the data you actually use. Fifth, test at production scale, not at test scale.

\n\n

Most canvas app performance problems are not platform bugs. They are design choices that work at small scale and break at large scale. Understanding the difference between client-side and server-side execution, and designing your app around that reality, is what separates apps that work and apps that scale.

\n\n


\n\n

About Routeget Technologies

\n\n

Routeget Technologies helps enterprises architect and implement scalable Power Platform solutions. If your Power Apps performance problems are holding back a rollout or affecting user adoption, our team can help you redesign and optimize your apps for production workloads. Reach out for a consultation.

\n\n

#PowerAppsPerformance #CanvasAppOptimization #PowerPlatformDevelopment #ClientSideRendering #DataverseOptimization #PowerAppsGalleries #EnterpriseApplications #Dynamics365Integration

\n”

Project Profitability in Dynamics 365 Project Operations: Why Your Project Margins Fail Without Proper Accounting Setup

Dynamics 365 Project Operations financial dashboard showing project profitability metrics

A professional services firm running Dynamics 365 Project Operations pulls its monthly margin report and finds something that doesn’t match reality on the ground. One fixed-price engagement shows a 60 percent margin despite the delivery team saying they’ve been slammed for weeks. Another time-and-materials project shows a loss even though every hour logged was billed. Nobody misused the system. Nobody entered a wrong number. The transactions are all correct, and the margins are still wrong, because project profitability in Dynamics 365 Project Operations is decided by the accounting setup behind those transactions, not by the transactions themselves.

Dynamics 365 Project Operations financial dashboard showing project profitability metrics

Two Price Lists, One Easy Mix-Up

Project Operations resolves cost and revenue through separate price lists, and the distinction matters more than the name suggests. A cost price list resolves the rates used on cost-type estimate and actual transactions, essentially what a resource actually costs the business. A sales price list resolves the rates used on the billed and unbilled sales side, essentially what gets charged to the customer. Each is set to a context, Cost or Sales, and that context governs how the system looks the record up. Set a list to the wrong context and price resolution simply fails to find a rate where one should exist.

Sales price lists carry another constraint cost lists don’t: they’re locked to the currency defined on the list header, while cost price lists can hold role prices in other currencies through user setup overrides. That asymmetry catches multinational firms more often than it should, particularly when a role price gets added to a sales list in the wrong currency and the transaction silently falls back to a default rate instead of erroring out. Sales price lists also have to be explicitly attached, to a customer’s project price list, a project quote, or a project contract, before they apply to anything; a rate sitting correctly configured but never attached to the contract in play won’t be used. Add date ranges into the mix, since price lists apply based on start and end dates, and a gap between two lists means a stretch of transactions with no applicable rate at all.

Where Margin Actually Gets Decided

Price lists set the numbers going into a transaction. What happens to those numbers on the ledger, which is what actually produces a margin figure, is governed by a separate configuration object: the project cost and revenue profile, found under Project management and accounting, Setup, Posting. This is the part of the setup that gets underinvested in relative to how much leverage it has over reported profitability.

The ledger settings on a profile decide, transaction type by transaction type, hour, expense, item, whether costs post straight to the profit and loss statement or sit on the balance sheet as work in progress until someone runs a separate posting step. They also decide whether on-account, milestone-based invoicing lands in a balance account or a P&L account, and whether unbilled revenue gets accrued to the general ledger at all. None of these settings are visible on the transaction itself. A time entry looks identical whether its hours are configured to post immediately or to wait in WIP, which is exactly why a wrong setting here doesn’t throw an error. It just quietly changes what shows up as margin.

Finance professional reviewing project accounting and cost allocation data

Fixed-Price Work Needs Its Own Logic

Time-and-materials projects recognize revenue roughly as work happens, so the profile settings above cover most of what matters. Fixed-price projects need an additional layer, because the billing schedule and the actual delivery pace are two different things, and the whole point of the accounting setup is to keep them from contaminating each other. Project Operations offers three methods here. Completed contract holds all revenue and cost recognition until the project finishes, carrying everything as WIP in the meantime. Completed percentage accrues revenue periodically based on how much of the project is actually done, using cost templates to group transactions for the percentage-complete calculation and period codes to set how often that calculation runs. No WIP skips the deferral entirely and is meant for short engagements where invoicing and cost recognition happen close enough together that deferral adds nothing but complexity.

A firm running long, milestone-heavy fixed-price engagements under a “no WIP” setup, because that was the default nobody revisited, will see revenue and cost recognized in whatever period the invoice happens to fall in rather than the period the work actually happened in. Margins swing from project to project not because delivery efficiency is inconsistent, but because the accounting method assumes short-cycle work being applied to long-cycle contracts.

Five Specific Ways This Goes Wrong

A handful of misconfiguration patterns show up repeatedly enough to be worth naming directly. A billing method mismatch, where time is set to fixed-price logic on what’s actually a time-and-materials engagement, or the reverse, throws off exactly when hours or expenses hit revenue relative to when they’re billed. A missed manual step is just as damaging: when hour or expense costs are set to post to a balance account rather than profit and loss, someone has to run the “post costs” function to move them into P&L, and if that step is skipped, costs simply never show up against revenue, producing a margin that looks better than it is. A mismatched revenue recognition method does similar damage from the other direction, completed contract selected on the profile while revenue is somehow still being accrued on a monthly cadence, which mismatches costs and revenue by period and makes margins swing without any real change in delivery.

The accrual settings create a subtler trap. Revenue accrual turned on for a time-and-materials engagement whose cost posting is set to “no ledger” produces transactions where revenue is recognized but the matching cost is never posted anywhere, which can show as a margin approaching 100 percent on paper. And on-account invoicing routed to a profit and loss account instead of a balance account recognizes milestone billings as revenue immediately, ahead of the delivery they’re meant to represent, front-loading margin into whichever period the invoice happens to land in.

Getting Project Profitability Right Before the Numbers Matter

None of this is complicated once it’s named, but it has to be checked deliberately rather than assumed. Start by confirming which billing method, time-and-materials or fixed-price, is actually assigned to each active profile, and cross-check that against how the contracts using that profile are actually structured. Walk the ledger settings for each transaction type and confirm someone owns the recurring job of running the “post costs” function if any type is set to balance posting, since that step doesn’t run itself. For fixed-price work, match the recognition method to the actual shape of the engagement rather than the platform default, short and simple work can reasonably use no WIP, but anything spanning multiple billing cycles needs completed percentage with cost templates that actually reflect how the project’s cost mix is structured. Finally, verify that profile assignment rules, by contract, project group, or individual project, are actually routing each engagement to the profile that matches how it’s billed, since a firm running several contract types often has profiles that were configured correctly once and then silently misapplied as the portfolio grew.

Routeget Technologies has walked in behind project-based businesses whose delivery teams were being blamed for margin problems that turned out to live entirely in the posting configuration, not the work. Reconciling that gap usually takes a focused audit of the profile settings against a sample of actual contracts, not a re-implementation, and it tends to be one of the highest-leverage half-days a Project Operations environment can spend.


#ProjectProfitability #ProjectAccounting #ProjectOperations #RevenueRecognition #WIPAccounting #CFOStrategy