Managing AI Builder Confidence Scores in Production: When Automation Accuracy Isn’t Good Enough

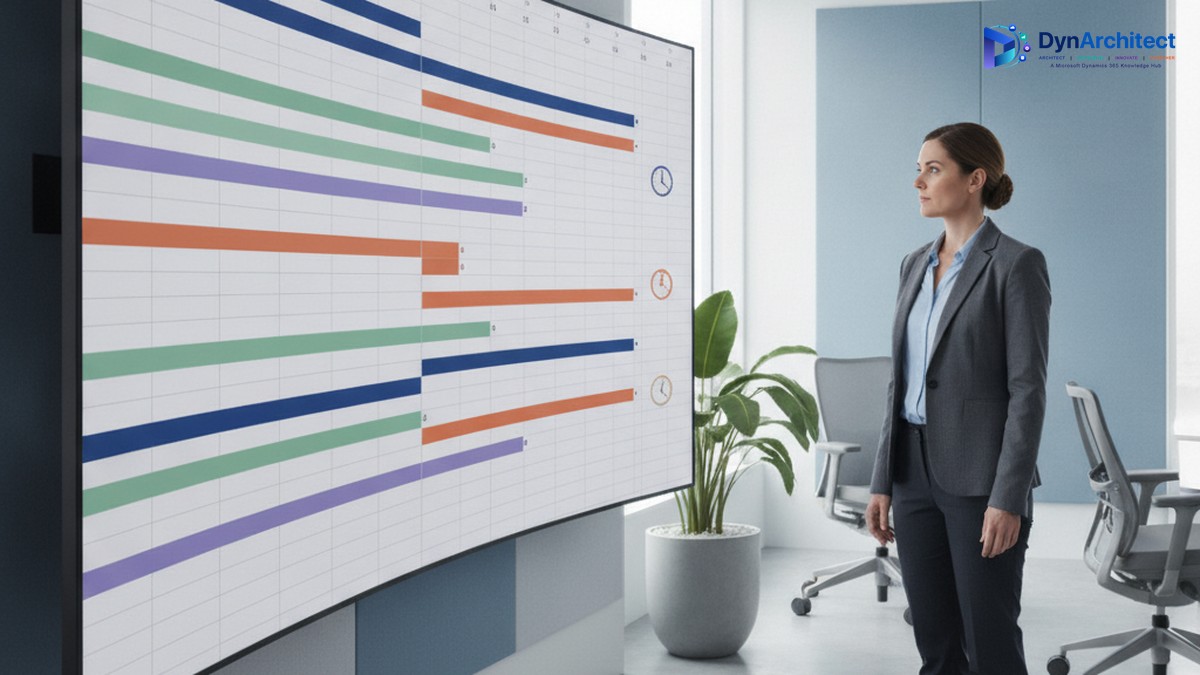
Finance dashboard with AI prediction confidence scores

A finance manager runs invoice processing through an AI Builder model trained to extract vendor, amount, and GL account from scanned receipts. The model reaches 94 percent accuracy in testing. On day one of production, it auto-posts a $50,000 invoice with the wrong GL account, costing two hours of detective work to fix. By day three, five more misclassifications land in the general ledger. The automation is disabled, invoices return to manual entry, and the project sponsor asks why the “accurate” model is still making costly mistakes.

The gap between testing accuracy and production safety isn’t a technology failure. It is a failure to account for what an accuracy metric actually tells you. An AI Builder model reporting 94 percent accuracy means one in roughly seventeen predictions will be wrong. In a finance system processing hundreds of transactions daily, “one in seventeen” is not acceptable for automated posting without human review. The difference between “generally accurate” and “safe to automate without oversight” requires a different measurement: confidence scoring and an intelligent routing system that uses it.

AI Builder provides confidence scores for most prediction tasks, but using them effectively means understanding what they measure, when to trust them, and how to handle predictions the model makes with low confidence. This is not a checkbox feature; it is the foundation for building automation that decision-makers can actually rely on.

What Confidence Scores Actually Measure

AI Builder returns a confidence value between zero and one for each prediction, representing the model’s statistical certainty about that specific output. This is not accuracy. Accuracy measures model performance across the entire test dataset. Confidence measures the model’s internal uncertainty about a single prediction.

A confidence score of 0.95 does not mean “95 percent likely to be correct.” It means the model’s learned patterns suggest this particular prediction is reliable according to its internal probability distribution. In practice, a prediction with confidence 0.95 is more likely to be correct than one with confidence 0.70, but the exact correlation between confidence and correctness depends on the specific model, the data it was trained on, and how representative production data is compared to training data.

This distinction matters because it changes how you use confidence as a decision signal. If you treat 0.95 as “definitely correct,” you will deploy the same ratio of errors as the model’s test accuracy (roughly one in seventeen). If you treat 0.95 as “probably correct compared to 0.70, but still worth a second look,” you can build a routing system that catches most of the risky predictions before they enter your core system.

Setting Confidence Thresholds

The first production decision is where to draw the threshold. Below a certain confidence value, the prediction goes to human review. Above it, the prediction enters automated processing. This threshold is not universal; it depends on the cost of a wrong decision, the volume of predictions, and the effort required for human review.

For invoice GL account classification, assume the model produces 200 invoices weekly. A wrong classification triggers a reconciliation loop and audit trail entry. The cost of each error includes accounting time, potential audit complexity, and systems rework. In this scenario, a threshold of 0.85 might be reasonable: predictions below 0.85 (roughly 10 percent to 15 percent of volume) go to a human queue for quick spot-check. Predictions above 0.85 (85 percent to 90 percent of volume) post automatically.

The threshold should shift based on downstream impact. For automated categorization of customer service tickets routed to a bot, a lower threshold (0.70 or 0.75) is acceptable because the cost of a misrouting is low and the human agent catches it immediately. For automated loan denial decisions, a much higher threshold (0.95 or 0.98) makes sense, even if it means a larger manual review queue, because the business and compliance cost of an incorrect decision is high.

Setting the threshold requires pilot data. Before full production, run the model on a representative sample of recent work and examine the distribution of confidence scores and their relationship to correctness. Plot confidence against error rate. Often you will find that confidence correlates imperfectly with accuracy, and you can identify a sensible threshold that balances automation volume and error risk.

Building Confidence-Aware Routing

AI Builder rarely runs in isolation. The typical pattern is: AI Builder predicts, Power Automate routes based on the prediction and its confidence score, and either a downstream system consumes the result or a human queue surfaces it for review.

In Power Automate, fetch the confidence value from the AI Builder action result. Most AI Builder prediction actions return not just the predicted value but also a confidence value. Check your specific model’s return schema; the confidence field might be named confidence, confidence_score, or included in a nested object depending on the prediction type. Extract it and pass it to a branching decision.
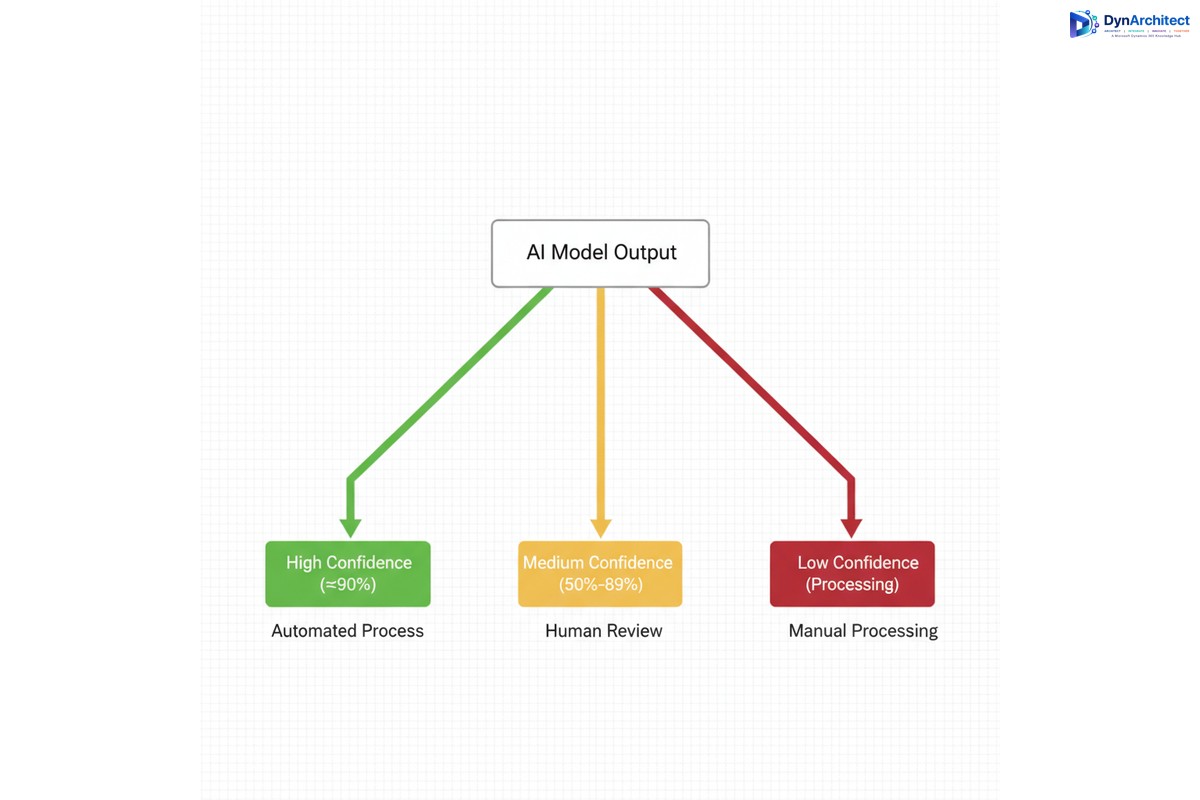
Workflow diagram showing confidence-based AI prediction routing

A three-branch routing pattern works well. If confidence is above the high threshold (0.90), route to automatic processing. If confidence is between thresholds (0.70 to 0.90), route to a human review queue with the prediction pre-populated and confidence displayed so the reviewer knows the model’s own uncertainty level. If confidence is below the low threshold (0.70), surface it as a flag case requiring full manual processing without the model’s suggestion, since a very low confidence prediction adds noise rather than help.

Within the human review queue, confidence becomes a sorting signal. Cases with confidence 0.88 should be reviewed before cases with confidence 0.72. The reviewer can quickly spot-check high-confidence cases and will catch more errors per hour on the lower-confidence cases that truly need scrutiny.

Handling Distribution Shift

Confidence scoring works well when production data matches the data the model was trained on. It breaks down when production introduces new patterns, edge cases, or systematic differences. A model trained on 2024 invoices will assign lower confidence to invoices with a new vendor format, or with line items in a currency not present in training data. A model trained on US customer data will assign lower confidence to customers from a region poorly represented in training.

This phenomenon is called distribution shift. When it occurs, confidence scores become less predictive of correctness. A prediction with confidence 0.85 that would normally be correct 85 percent of the time might only be correct 70 percent of the time if production data has drifted significantly.

Monitoring for distribution shift requires tracking two things: the overall distribution of confidence scores week to week, and the error rate within each confidence band. If the average confidence drops from 0.82 to 0.74 over a month, suspect distribution shift. If errors within the 0.80 to 0.90 band spike from two percent to eight percent, confirm it.

When distribution shift is detected, retrain the model on recent production data, or apply transfer learning to adapt the existing model to the new patterns. This is not a one-time task; models decay over time, and quarterly retraining cycles are standard practice for models in production.

Audit, Compliance, and Decision Logging

Finance and compliance teams require a complete audit trail for every automated decision. Confidence scores are part of that trail. For each automated transaction, log not just the decision and the predicted value, but also the confidence score at the time the decision was made. If the transaction is later questioned, an audit shows both what the model predicted and how confident it was.

In many organizations, automated decisions below a regulatory threshold (perhaps any transaction over a certain amount, or any customer marked for special review) automatically escalate to a human approval step regardless of confidence. This is appropriate. Automation should accelerate routine decisions, not replace governance.

Document your confidence thresholds as part of your automation governance. Record the date the threshold was set, the reasoning behind it, and any changes. If an error occurs, this documentation becomes part of the root cause analysis. It demonstrates that the automation was designed with business intent, not implemented carelessly.

Monitoring and Iterative Improvement

After the first month of production, analyze the correlation between confidence and actual outcome. If predictions with confidence above 0.85 are wrong just two percent of the time while predictions with confidence 0.70 to 0.85 are wrong thirty percent of the time, your threshold is well-calibrated. If predictions above 0.85 are wrong ten percent of the time, your threshold is too aggressive and you need to raise it to 0.92 or 0.95.

Set up dashboards that track confidence distribution, error rates by confidence band, and the volume of cases routed to each path. Alert if the error rate in the automated path exceeds a threshold (perhaps 5 percent). Alert if average confidence trends downward, signaling model decay.

Use this monitoring data to refine your model quarterly. Collect the cases that were routed to human review, particularly those where the human disagreed with the model prediction. Use disagreement cases as negative examples to retrain the model, improving its calibration.

Conclusion

Confidence scoring transforms AI Builder from a tool that makes predictions to a tool that makes predictions and quantifies its own uncertainty. Using confidence well means treating it not as a precision guarantee but as a sorting mechanism that reduces risk by routing uncertain predictions to humans who can make the final call. This shifts the conversation from “is this model accurate enough?” to “how do we use this model’s accuracy in a system that cannot tolerate errors?” The second question is the one that actually gets projects to production and keeps them there without creating extra work downstream. Routeget Technologies helps organizations build exactly this kind of safeguarded automation, where AI is an accelerant for human decision-making, not a replacement for accountability.


#AIBuilderConfidence #AIAutomation #FinanceAutomation #AIMLModeling #DynamicsAI

Configuring Field Service Requirement Groups Before You Turn On the Scheduling Operations Agent

Field service dispatcher reviewing a multi-resource schedule board on a large monitor

A dispatcher at a commercial HVAC contractor gets a work order for a rooftop unit replacement that needs a refrigerant-certified technician and a licensed electrician on site at the same time. Neither one can do the job alone, and the customer has a four-hour access window. On most schedule boards, this becomes two separate booking searches, two different sets of availability to cross-reference by hand, and a fair amount of guessing about who else is nearby when the first match falls through. Dynamics 365 Field Service has had a purpose-built answer to this for a while, and it lives inside a feature called Field Service requirement groups. What changes this year is that Field Service is also rolling out an AI agent that can optimize those multi-resource schedules on its own, and the two capabilities need to be understood together, not separately, if a rollout is going to hold up.

Field service dispatcher reviewing a multi-resource schedule board on a large monitor

Why Requirement Groups Exist

A requirement group bundles several resource requirements that are commonly scheduled together for a single job: two technicians with different skills, a technician paired with a piece of equipment, or a facility resource alongside the staff member who runs it. It solves a narrower problem than it sounds like it should. Field Service already has crews for resources who always work as a fixed unit, so requirement groups are reserved for combinations that vary from job to job, which is exactly the HVAC scenario above. Get that distinction wrong early and dispatchers end up maintaining crew records for what are really one-off pairings, which defeats the purpose of either feature.

Configuring Field Service Requirement Groups: A Three-Step Setup

Building a usable requirement group takes three steps, and the order matters more than the documentation implies, because the template governs everything downstream.

The first step is the requirement group template, created under Resource Scheduling settings. Two fields here decide how strict the matching logic is. The “Select” setting is either All, meaning every resource in the group must satisfy every requirement, or Any, meaning a resource can fulfill any one of them; nesting subgroups lets a team combine both, for instance a root group set to Any with two subgroups each set to All, which is how a dispatcher models “either an electrician-plus-tech pairing or a single dual-certified tech will do.” The “Part of Same” setting controls how tightly the resources have to be related to each other, ranging from a shared location association up through a shared organizational unit, which is the strictest option and the one most enterprises with multiple legal entities or regional service territories will actually need.

The second step is adding individual requirements to the template: duration, characteristics or skills, resource categories, work location (facility, on-site, or location-agnostic), and preferred resources, each capped at ten values. That cap is easy to hit for a services company with a large skills taxonomy, and the practical fix is to push filtering down to characteristics rather than trying to enumerate every acceptable technician by name.

The third step is booking through the schedule assistant, which searches for resources that can fulfill the group’s requirements and defaults to recommending the option requiring the fewest resources first. Requirement group templates can also be attached directly to incident types, so a work order created from a known incident type pulls in its multi-resource requirements automatically instead of relying on a dispatcher to remember which jobs need a paired booking.

The Detail That Breaks Onsite Jobs

One behavior catches teams off guard during go-live. The schedule assistant matches resources by arrival time, not by when they start traveling. For a job where both resources are dispatched from the same depot, that distinction rarely matters. It matters a great deal when one technician is thirty minutes from the site and the other is ninety minutes out on a different route; the assistant will still try to land them at the customer’s door at the same moment, which can mean the closer resource sits idle waiting for a window that a smarter dispatcher would have staggered. Any territory with technicians spread across a wide radius should account for this when setting expectations with dispatch staff, rather than treating a rejected recommendation as a bug.

A handful of other constraints are worth knowing before they show up as a production surprise. Requirement groups do not support multi-day scheduling; a job spanning more than one day needs Field Service’s separate multi-day scheduling capability instead. Every requirement inside a group must share the same duration, so a job needing a technician for four hours and a specialist for only the first hour has to be modeled as two bookings, with cascade crew changes disabled afterward so adjusting one booking’s length does not silently drag the other along with it. And incident types that already carry their own characteristics cannot be linked to a requirement group template at the same time, which pushes teams toward attaching characteristics to the individual requirements inside the group rather than to the incident type itself.

Two field service technicians consulting a tablet showing work order and scheduling details

Where the Scheduling Operations Agent Fits

Requirement groups solve how a multi-resource job gets modeled and booked once. The Scheduling Operations Agent, entering broader preview this month, is aimed at a different problem: keeping the whole day’s schedule coherent after the first booking, when cancellations, overruns, and priority changes start cascading across a technician roster. It already handled single and multi-resource optimization in an earlier preview; what is new is an “automate optimizations” capability that runs in two modes. Interactive mode surfaces suggested changes for a dispatcher to accept in the moment, which is closest to how the tool has worked so far. Batch mode runs asynchronously against a defined scope of resources, on a schedule, which is the part that actually reduces manual dispatch work rather than just speeding up the click-through.

The naming is a little ahead of what the feature currently does, and that gap is worth being precise about with stakeholders. Every optimization the agent proposes, in either mode, still requires human approval before it takes effect, and it will not touch a booking marked “Do Not Move.” That is a sensible guardrail, but it means batch mode is closer to an overnight queue of pre-vetted suggestions waiting for a morning review than to unattended rescheduling. Teams evaluating this as a way to cut dispatcher headcount should model it as an efficiency gain on the review step, not a removal of the step.

Setup runs through three admin-configured objects: goals, which define what the agent is optimizing for and the constraints it has to respect, such as skill eligibility and territory boundaries; scopes, which define which resources and requirements are in play; and plans, which schedule batch runs. None of this is exposed to end users by default, so a pilot needs a maker or admin to own the configuration from day one, and it needs a data foundation of accurate characteristics and territory assignments on the underlying resources, since the agent’s recommendations are only as good as the constraint data it is reading. This is also where requirement group discipline pays off twice: a schedule with sloppy or missing characteristics will produce weak optimization suggestions regardless of how well the agent itself is configured. Regional rollout is uneven as well; the feature is unavailable in Azure Government and China cloud environments and is still expanding across other regions, so a multinational deployment should confirm coverage before promising a go-live date to any specific site.

Sequencing a Rollout That Actually Holds

The practical order is to get requirement groups and their underlying characteristics right first, on a defined subset of incident types, before layering the agent on top. A team that tries to configure both at once tends to spend its pilot debugging which layer produced a bad recommendation. Once requirement group bookings are reliable for a specific service line, interactive-mode agent suggestions are a reasonable next step, since a dispatcher is reviewing every change anyway. Batch mode is worth piloting only after that interactive period has built some trust in the agent’s judgment on that same resource pool, and even then it should start on a narrow scope rather than the full technician roster. Routeget Technologies has run this kind of phased rollout with field service clients who tried to skip straight to full automation and ended up rebuilding their characteristic taxonomy mid-project instead; sequencing it the other way costs a little more calendar time upfront and considerably less rework later.


#FieldServiceScheduling #RequirementGroups #SchedulingOperationsAgent #MultiResourceBooking #DispatchOptimization #DynamicsFieldService

Implementing Robust Error Handling in Power Automate: Patterns for Enterprise Deployments

One of the most insidious threats to enterprise automation is the silent failure—a workflow that appears to complete successfully but delivers corrupted data, skipped steps, or incomplete transactions. In Power Automate, uncaught errors compound this risk when operations fail without proper logging or recovery mechanisms. Implementing robust error handling isn’t just best practice; it’s essential infrastructure for reliable cloud automation.

Enterprise deployments demand structured, predictable error handling patterns that prevent cascading failures, enable rapid diagnosis, and allow graceful degradation when failures occur. This article explores the patterns and techniques that separate production-grade flows from prototype implementations.

Professional dashboard showing real-time monitoring and error tracking for cloud automation workflows with status indicators and error rate graphs
Real-time error monitoring and tracking dashboard

One of the most insidious threats to enterprise automation is the silent failure—a workflow that appears to complete successfully but delivers corrupted data, skipped steps, or incomplete transactions. In Power Automate, uncaught errors compound this risk when operations fail without proper logging or recovery mechanisms. Implementing robust error handling isn’t just best practice; it’s essential infrastructure for reliable cloud automation.

Enterprise deployments demand structured, predictable error handling patterns that prevent cascading failures, enable rapid diagnosis, and allow graceful degradation when failures occur. This article explores the patterns and techniques that separate production-grade flows from prototype implementations.

Detecting and Classifying Errors

The foundation of error handling is visibility. Power Automate provides multiple error detection mechanisms, each suited to different scenarios:

Action-level error handling: Using “Configure run after” settings on each action lets you specify which states trigger conditional logic. You can configure actions to run on success, failure, timeout, or skip conditions. This approach is granular but can create complex conditional branches if overused.

Scope-based error handling: Wrapping related actions in a Scope action creates a logical transaction boundary. If any action within the scope fails, the entire scope transitions to a failed state. You can then configure error handling that applies to the entire scope rather than individual actions.

Try-catch patterns: Though Power Automate lacks explicit try-catch syntax, you can implement equivalent logic using scopes with nested conditional actions. A scope attempts operations; a parallel action monitors for failures and executes recovery logic.

Classification is equally important. Not all errors are equal. Transient network timeouts warrant automatic retry; authentication failures typically don’t. Data validation errors signal bugs in upstream systems and require investigation. By classifying errors according to their root cause and severity, you can implement proportionate responses.

Implementing Retry Logic

Retry logic is your first defense against transient failures. Power Automate HTTP actions support built-in retry policies with exponential backoff. For other action types, you implement retry using loops and counters:

Create a boolean variable “RetryNeeded” initialized to true, and a counter “Retries” initialized to 0. Wrap your operation in a Do-Until loop that continues while “RetryNeeded” is true and “Retries” is less than your maximum (typically 3-5 for transient failures). On success, set “RetryNeeded” to false. On failure, check the error type; if transient, increment “Retries” and let the loop continue. If permanent, set “RetryNeeded” to false and handle the error.

Exponential backoff is crucial: waiting 1 second, then 2, then 4, then 8 between retries reduces load on failing systems and increases success rates for temporary outages. Implement this using a Delay action whose duration scales with the retry count.

Always set a maximum retry count. Infinite retry loops mask underlying problems and consume flow runs unnecessarily. Three to five attempts generally balances resilience against resource consumption.

Structured Logging and Diagnostics

When errors occur, you need complete context: what was the input? What action failed? What was the error message? What was the state of related systems? Without this information, diagnosing failures in production consumes hours of investigation.

Implement structured logging by writing a standardized error record to a central log table immediately upon detecting failure. Include: timestamp (utcNow()), flow name and run ID (workflow().id and workflow().run.identity.id), action name, error message, error code, relevant data inputs, and severity level (critical, high, medium, low).

Store logs in a dedicated SharePoint list, a SQL database, or an Azure Table. Avoid relying solely on Power Automate’s run history UI; it’s designed for troubleshooting individual runs, not systematic analysis. A structured log enables you to identify patterns—which actions fail most often? Which error codes indicate configuration problems? Which failures correlate with specific input patterns?

Graceful Degradation and Fallbacks

Not every error requires stopping the entire workflow. Enterprise systems often tolerate partial failures if they degrade gracefully. An approvals workflow might succeed even if email notification fails. A data synchronization might proceed with historical data if the real-time source is unavailable.

Implement graceful degradation by identifying non-critical operations and wrapping them in error handlers that log the failure but allow the flow to continue. Use a “success” variable that starts true; non-critical action failures set it to false and log the error, but don’t stop execution. Upon completion, log the overall status as “partial success with warnings” rather than complete failure.

Fallback operations provide alternative paths when primary operations fail. If updating a primary database fails, write to an archive table. If sending to a preferred service fails, queue the work for later retry via a secondary system. If a required approval fails to complete, escalate to a manager rather than blocking indefinitely.

Monitoring and Alerting

Enterprise data center with server racks and network connections representing cloud infrastructure and automation systems

Structured logging is only valuable if someone monitors it. Configure automated alerts on your error log: if the error rate exceeds threshold, if a critical action fails repeatedly, or if specific error types appear. Use Power Automate itself to trigger alerts: a scheduled flow that queries your error log every hour and sends a summary to operational teams.

Alert fatigue is a real risk. Don’t alert on every error; many transient failures self-resolve. Alert on error rates exceeding baseline, on repeated failures from specific flows, and on critical errors. Include enough context in alerts that your team can begin investigation without accessing five different systems.

Dashboards that visualize error trends complement point-in-time alerts. A simple Power BI dashboard connected to your error log reveals which flows are deteriorating, which errors are emerging, and when flows became unreliable. This enables proactive maintenance before failures cascade.

Testing Error Paths

Errors happen in production, not in development. But you can test error handling by deliberately injecting failures. Create test flows that call your production flows with intentionally malformed inputs. Trigger HTTP actions against unreachable endpoints. Simulate database connection timeouts. Verify that errors log correctly and that alerts fire.

Version your error handling logic independently of feature logic. If you change retry counts, backoff intervals, or alert thresholds, test those changes in a lower environment first. A misconfigured retry loop that retries indefinitely is worse than no retry at all.

Enterprise Patterns in Practice

Real deployments combine these patterns. A robust data synchronization flow typically includes: scope-based error handling for logical transaction boundaries, retry logic with exponential backoff for transient failures, structured logging to every action, graceful degradation for non-critical operations, and monitoring that alerts on repeated failures.

A typical flow structure looks like: attempt primary operation in a scope; if scope fails, check error type; if transient, execute retry loop; if permanent, log and execute fallback operation or escalation; always log completion status (success, partial success, or failure).

The investment in error handling infrastructure pays dividends. Flows that handle errors gracefully recover automatically from transient outages without requiring manual intervention. Structured logs enable rapid diagnosis when problems do occur. Monitoring systems catch degradation before it becomes critical. Your team moves from reactive firefighting to proactive stability management.

About Routeget

Routeget specializes in enterprise automation architecture, helping organizations design and implement robust cloud workflows. Our expertise spans Power Automate, Logic Apps, and multi-cloud orchestration patterns. We help enterprises move from prototype implementations to production-grade systems that scale reliably.

Tags: #PowerAutomateErrorHandling #Dynamics365Development #CloudFlowPatterns #ErrorHandlingStrategy #PowerAutomatePatterns

Project Profitability in Dynamics 365 Project Operations: Why Your Project Margins Fail Without Proper Accounting Setup

Dynamics 365 Project Operations financial dashboard showing project profitability metrics

A professional services firm running Dynamics 365 Project Operations pulls its monthly margin report and finds something that doesn’t match reality on the ground. One fixed-price engagement shows a 60 percent margin despite the delivery team saying they’ve been slammed for weeks. Another time-and-materials project shows a loss even though every hour logged was billed. Nobody misused the system. Nobody entered a wrong number. The transactions are all correct, and the margins are still wrong, because project profitability in Dynamics 365 Project Operations is decided by the accounting setup behind those transactions, not by the transactions themselves.

Dynamics 365 Project Operations financial dashboard showing project profitability metrics

Two Price Lists, One Easy Mix-Up

Project Operations resolves cost and revenue through separate price lists, and the distinction matters more than the name suggests. A cost price list resolves the rates used on cost-type estimate and actual transactions, essentially what a resource actually costs the business. A sales price list resolves the rates used on the billed and unbilled sales side, essentially what gets charged to the customer. Each is set to a context, Cost or Sales, and that context governs how the system looks the record up. Set a list to the wrong context and price resolution simply fails to find a rate where one should exist.

Sales price lists carry another constraint cost lists don’t: they’re locked to the currency defined on the list header, while cost price lists can hold role prices in other currencies through user setup overrides. That asymmetry catches multinational firms more often than it should, particularly when a role price gets added to a sales list in the wrong currency and the transaction silently falls back to a default rate instead of erroring out. Sales price lists also have to be explicitly attached, to a customer’s project price list, a project quote, or a project contract, before they apply to anything; a rate sitting correctly configured but never attached to the contract in play won’t be used. Add date ranges into the mix, since price lists apply based on start and end dates, and a gap between two lists means a stretch of transactions with no applicable rate at all.

Where Margin Actually Gets Decided

Price lists set the numbers going into a transaction. What happens to those numbers on the ledger, which is what actually produces a margin figure, is governed by a separate configuration object: the project cost and revenue profile, found under Project management and accounting, Setup, Posting. This is the part of the setup that gets underinvested in relative to how much leverage it has over reported profitability.

The ledger settings on a profile decide, transaction type by transaction type, hour, expense, item, whether costs post straight to the profit and loss statement or sit on the balance sheet as work in progress until someone runs a separate posting step. They also decide whether on-account, milestone-based invoicing lands in a balance account or a P&L account, and whether unbilled revenue gets accrued to the general ledger at all. None of these settings are visible on the transaction itself. A time entry looks identical whether its hours are configured to post immediately or to wait in WIP, which is exactly why a wrong setting here doesn’t throw an error. It just quietly changes what shows up as margin.

Finance professional reviewing project accounting and cost allocation data

Fixed-Price Work Needs Its Own Logic

Time-and-materials projects recognize revenue roughly as work happens, so the profile settings above cover most of what matters. Fixed-price projects need an additional layer, because the billing schedule and the actual delivery pace are two different things, and the whole point of the accounting setup is to keep them from contaminating each other. Project Operations offers three methods here. Completed contract holds all revenue and cost recognition until the project finishes, carrying everything as WIP in the meantime. Completed percentage accrues revenue periodically based on how much of the project is actually done, using cost templates to group transactions for the percentage-complete calculation and period codes to set how often that calculation runs. No WIP skips the deferral entirely and is meant for short engagements where invoicing and cost recognition happen close enough together that deferral adds nothing but complexity.

A firm running long, milestone-heavy fixed-price engagements under a “no WIP” setup, because that was the default nobody revisited, will see revenue and cost recognized in whatever period the invoice happens to fall in rather than the period the work actually happened in. Margins swing from project to project not because delivery efficiency is inconsistent, but because the accounting method assumes short-cycle work being applied to long-cycle contracts.

Five Specific Ways This Goes Wrong

A handful of misconfiguration patterns show up repeatedly enough to be worth naming directly. A billing method mismatch, where time is set to fixed-price logic on what’s actually a time-and-materials engagement, or the reverse, throws off exactly when hours or expenses hit revenue relative to when they’re billed. A missed manual step is just as damaging: when hour or expense costs are set to post to a balance account rather than profit and loss, someone has to run the “post costs” function to move them into P&L, and if that step is skipped, costs simply never show up against revenue, producing a margin that looks better than it is. A mismatched revenue recognition method does similar damage from the other direction, completed contract selected on the profile while revenue is somehow still being accrued on a monthly cadence, which mismatches costs and revenue by period and makes margins swing without any real change in delivery.

The accrual settings create a subtler trap. Revenue accrual turned on for a time-and-materials engagement whose cost posting is set to “no ledger” produces transactions where revenue is recognized but the matching cost is never posted anywhere, which can show as a margin approaching 100 percent on paper. And on-account invoicing routed to a profit and loss account instead of a balance account recognizes milestone billings as revenue immediately, ahead of the delivery they’re meant to represent, front-loading margin into whichever period the invoice happens to land in.

Getting Project Profitability Right Before the Numbers Matter

None of this is complicated once it’s named, but it has to be checked deliberately rather than assumed. Start by confirming which billing method, time-and-materials or fixed-price, is actually assigned to each active profile, and cross-check that against how the contracts using that profile are actually structured. Walk the ledger settings for each transaction type and confirm someone owns the recurring job of running the “post costs” function if any type is set to balance posting, since that step doesn’t run itself. For fixed-price work, match the recognition method to the actual shape of the engagement rather than the platform default, short and simple work can reasonably use no WIP, but anything spanning multiple billing cycles needs completed percentage with cost templates that actually reflect how the project’s cost mix is structured. Finally, verify that profile assignment rules, by contract, project group, or individual project, are actually routing each engagement to the profile that matches how it’s billed, since a firm running several contract types often has profiles that were configured correctly once and then silently misapplied as the portfolio grew.

Routeget Technologies has walked in behind project-based businesses whose delivery teams were being blamed for margin problems that turned out to live entirely in the posting configuration, not the work. Reconciling that gap usually takes a focused audit of the profile settings against a sample of actual contracts, not a re-implementation, and it tends to be one of the highest-leverage half-days a Project Operations environment can spend.


#ProjectProfitability #ProjectAccounting #ProjectOperations #RevenueRecognition #WIPAccounting #CFOStrategy

Designing Dynamics 365 for Enterprise: Why Customization Strategy Decides Success, Not Implementation Speed

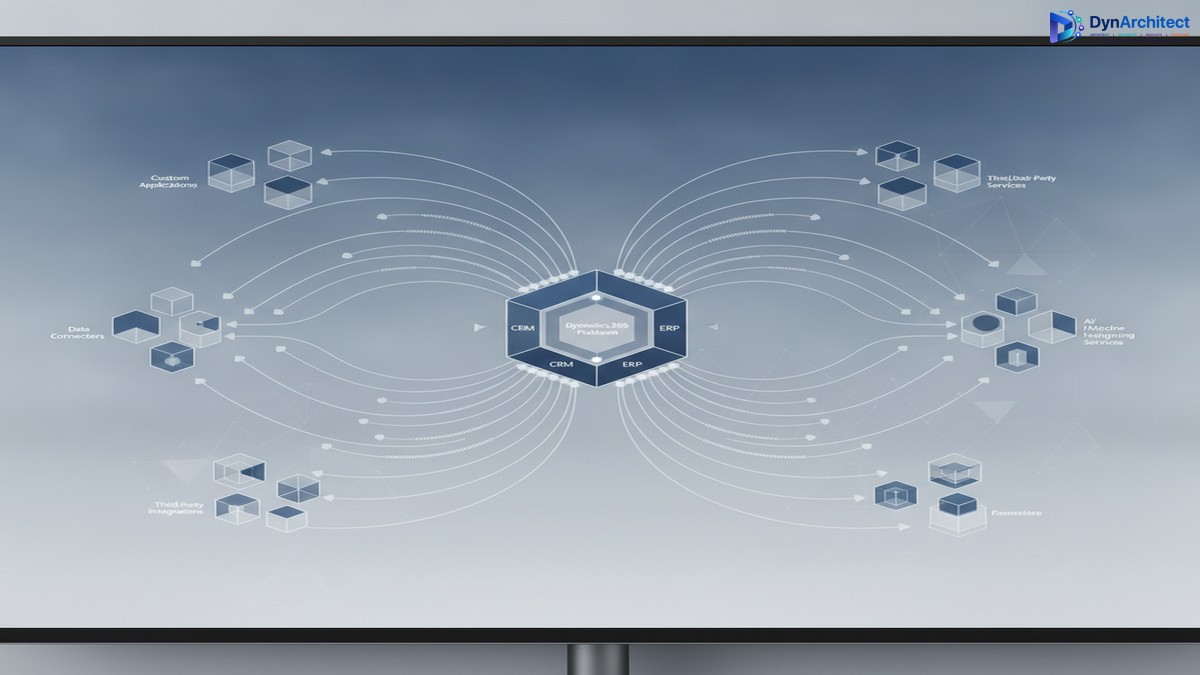
Enterprise architecture diagram for Dynamics 365 customization strategy

Designing Dynamics 365 for Enterprise: Why Customization Strategy Decides Success, Not Implementation Speed

Your implementation partner is confident they can deploy Dynamics 365 Finance in 16 weeks, on budget, with minimal customization. Your CIO is skeptical. What everyone is missing is that 16 weeks of deployment velocity means nothing if the system cannot flex to meet the specific financial workflows, reporting requirements, and exception-handling logic that actually run your business. This article walks through the decision-making framework that separates Dynamics 365 implementations that maintain competitive advantage from those that lock you into inflexible process conformity.

Enterprise architecture diagram for Dynamics 365 customization strategy

The Cost of Standardization Without Strategy

When large organizations adopt Dynamics 365, they encounter a genuine constraint that smaller implementations never face. Standard Dynamics 365 processes are designed to handle typical transactional patterns: create a sales order, post inventory, record journal entries, close a period. These processes work well in companies where financial and supply chain operations follow recognizable routines. For organizations with complex subsidiaries, multiple legal entities, specialized revenue recognition requirements, or consolidated financial structures, the gap between standard functionality and operational reality can be substantial.

The temptation is to close that gap quickly. Customize first, ask questions later, implement the feature, move on. Partners and consultants work under schedule pressure; executives care about go-live dates. But what you are actually deciding during that 16-week window is whether Dynamics 365 will grow with your business or become a limitation on it. Quick customization often leaves a system that works once but breaks when operational volumes increase, subsidiary structures change, or new products with different financial characteristics are introduced.

The alternative, often recommended as the responsible path, is to conform your business processes to Dynamics 365’s out-of-the-box design, accepting some operational inefficiency as the cost of system stability and supportability. In many cases this is the right choice. But conformity also has costs that don’t appear on project budgets. Your finance team works longer hours to reconcile Dynamics 365’s assumptions against reality. Your reporting becomes a collection of workarounds rather than a source of truth. And when the next acquisition brings new compliance requirements or new product portfolios, the system lacks the extension points to accommodate them without a redesign.

What does decide success is a third path: designing your customization strategy during the planning phase, before implementation begins. That strategy takes into account which aspects of your business must remain flexible and which can safely conform to industry standards. It identifies the specific extension points within Dynamics 365’s architecture where customization will add the most value for the least technical risk. And it builds a system that can absorb change without constant rearchitecture.

Where Customization Creates Value Versus Where It Creates Debt

Enterprise Dynamics 365 implementations typically divide customization work into three categories. The first, which most organizations handle well, is creating reports and dashboards that show business leaders what is actually happening in the system. Power BI integration has made this category straightforward and low-risk. The second category is integrating Dynamics 365 with adjacent systems: supply chain planning, human capital management, third-party analytics, specialized industry platforms. This category is partially standardized through common APIs, but it still requires engineering effort to match data semantics and handle edge cases.

Enterprise architecture dashboard with analytics and workflow components

The third category is where implementation strategy becomes critical. This is the customization of Dynamics 365’s own business logic: approval workflows, financial period close sequences, consolidation logic for multi-entity structures, asset depreciation rules, tax calculation approaches. This category is where quick implementations often stumble. An approval workflow that works during initial deployment may become a bottleneck once volume increases. A period-close automation that works for a single legal entity with straightforward inter-company transactions becomes fragile when the organization acquires a subsidiary with different accounting standards.

The decision-making framework starts here: before implementation begins, your enterprise architects and finance leaders should identify which of these processes are truly core to competitive differentiation and which can safely standardize. A manufacturing company with a proprietary approach to cost allocation across multiple production facilities needs flexible and sophisticated costing logic. It is worth customizing Dynamics 365 to accommodate that approach because it is a source of actual competitive advantage. A company that follows standard industry costing practices might adopt Dynamics 365’s defaults and apply engineering effort elsewhere. The distinction seems obvious once stated, but most implementations conflate two different questions: “What does our business need?” and “What can we afford to build?”

Building Sustainable Extensibility Into Your Architecture

Once you have identified where customization creates value, the question becomes how to build those customizations in a way that survives the company’s evolution. This is the point where many implementations fail, not because the customizations are poorly written, but because they are designed for a static set of requirements rather than a dynamic business landscape.

Sustainable Dynamics 365 customization relies on a small set of architectural practices that most standard implementations skip. The first is establishing a clear boundary between custom logic and core system behavior. Dynamics 365 provides multiple layers where you can extend functionality: metadata-driven configuration, business process flows for structured automation, plugins for deep system logic, and custom APIs for discrete operations. Each layer has appropriate use cases, and mixing them creates brittle systems that become impossible to maintain as requirements change. Your architecture should establish which customization layer you will use for each category of logic, and it should enforce that decision consistently across the implementation.

The second practice is designing for data portability and reporting independence. The most consequential decision you make during implementation is how custom data structures interact with standard Dynamics 365 tables. Custom tables often make sense for capturing business-specific information, but they need to be designed from the start as if they might need to move to Power BI, external data warehouses, or downstream systems. This means using consistent naming conventions, avoiding gratuitous denormalization, and exposing data through defined APIs rather than direct database access. This sounds like overhead during implementation, but it becomes the difference between a system that can evolve and one that becomes increasingly brittle.

The third practice is establishing a plugin and API governance model before the first line of custom code is written. Plugins in Dynamics 365 give you profound power to intercept and transform business logic, but they also create opportunities for cascading failures if not managed carefully. A plugin that modifies financial data should have well-defined preconditions and should fail safely rather than partially. This requires treating plugin logic as mission-critical software, with corresponding standards for error handling, logging, and monitoring. Many organizations discover this requirement only after a plugin failure causes data corruption or blocks period close.

The Timeline Problem: Speed Versus Sustainability

The financial incentive structure in most implementations creates pressure to prioritize speed over sustainability. Consultants are paid for hours, not for long-term system stability. Partners succeed when projects go live on schedule, not when systems remain flexible three years later. This creates an alignment problem between what consultants build and what enterprises actually need.

The remedy is to invest in architectural review and governance at the beginning of the implementation, not at the end. This means dedicating time during planning to document which Dynamics 365 capabilities will be used as-is, which will be customized and why, and which are being bypassed in favor of external systems. It means establishing plugin standards and API governance before the technical team begins coding. It means creating a small architecture review board that reviews major customization decisions and blocks implementations that do not align with the agreed strategy.

This sounds like adding overhead to an already-complex project, and in terms of pure calendar time, it does. But the payoff is in the years that follow. When your organization expands into new markets and needs to onboard a subsidiary with different accounting structures, a well-designed Dynamics 365 foundation can usually accommodate that through configuration and targeted customization. A poorly-designed one requires rearchitecture. When regulatory requirements change and you need to modify financial period-close logic, a system built on clear customization boundaries can adapt. One without those boundaries often cannot.

Deciding What to Do Right Now

If you are in the early stages of Dynamics 365 planning, the most valuable action is to bring your architects and business leaders into the conversation about customization strategy before implementation begins. Do not let this decision be made implicitly by consultants optimizing for schedule. If you are mid-implementation and realizing that customization decisions are being made tactically rather than strategically, it is not too late to step back and establish architecture governance.

The enterprise that succeeds with Dynamics 365 is not necessarily the one that goes live fastest. It is the one that understands, before implementation, which parts of its business need to remain flexible and builds a system architecture that protects that flexibility. That requires more planning, more discipline, and more serious engagement with technical architecture decisions. It also results in a system that still works years later when your business has changed in ways you could not have predicted during implementation planning.

This is not a problem that faster implementation or lower-cost consulting can solve. It is a problem that requires CIOs and enterprise architects to make genuine strategic choices about where customization creates value and where it creates technical debt. The organizations that make those choices deliberately are the ones that get long-term value from Dynamics 365. The others end up managing the consequences.

Topics: #Dynamics365Architecture #EnterpriseCustomization #Dynamics365Strategy #CustomizationStrategy #EnterpriseERP #Dynamics365Implementation

Dynamics 365 Tax Calculation Migration Gets an Automated Tool. It Still Needs a Reviewer.

Finance systems analyst reviewing Dynamics 365 tax configuration data on a monitor

A finance solution architect I spoke with recently put the choice in blunt terms: her team’s Sales Tax configuration has worked reliably for nine years, and nobody wants to touch it, but Microsoft has made it clear that Advanced Tax Calculation, not the legacy Sales Tax module, is where indirect tax functionality in Dynamics 365 Finance is actually heading. That tension shows up in nearly every conversation about a Dynamics 365 tax calculation migration: teams know the destination, but re-keying years of tax codes, tax groups, and jurisdiction rules by hand is not a project anyone volunteers for. With the 2026 Wave 1 release, Microsoft shipped a preview feature aimed at closing that gap, and it deserves a close technical look before anyone assumes it turns migration into a one-click event.

What the Tax Calculation Migration Tool Actually Moves

The feature, officially called “Automate tax feature creation based on tax master data,” lives in Globalization Studio under Tax Calculation, and it is activated through a Feature Management flag rather than being on by default. Once enabled, it reads a legal entity’s existing sales tax master data (tax codes, sales tax groups, and item sales tax groups) and builds an equivalent Tax Calculation feature version from it, reusing the reference data rather than asking anyone to redefine it from scratch. It also maps general ledger parameters that previously lived at the legal entity level, reverse sales tax on cash discount, whether cash discount is deducted before tax calculation, and whether cash discount is calculated on an amount including tax for both customers and vendors, onto their equivalent Tax Jurisdiction Parameters in the new model. Tax code origin settings translate as well: percentage of gross amount becomes “By Gross Amount,” percentage of net amount becomes “By Net Amount,” percentage of margin becomes “By Margin,” and so on through amount-per-unit and tax-on-tax origins.

Finance systems analyst reviewing Dynamics 365 tax configuration data on a monitor

That mapping table matters more than it looks. Anyone who has manually stood up Advanced Tax Calculation before knows that recreating tax jurisdiction parameters and origin rules correctly, across dozens of tax codes, is where most implementation hours actually go. Automating that translation, even in preview, removes a meaningful chunk of the grinding part of the work.

Where the Automation Runs Into Real Constraints

The tool is scoped to one legal entity at a time, and it requires the operator to be signed into the correct legal entity before starting the process from the Tax Data Migration button in Globalization Studio. It is also explicitly unavailable for Brazil and India legal entities, so multinational rollouts will need a separate manual path for those jurisdictions regardless of how well the automated tool performs elsewhere.

Two hard limits are worth flagging before anyone schedules migration work around this tool. Tax code names are capped at ten characters in the target model, and when a naming conflict forces the tool to create a variant, it truncates the original name and appends a numeric suffix, so “Test123456” becomes “Test1234_1.” Separately, if the combined character length of the tax codes attached to a single tax group or item tax group exceeds 1,000 characters, the migration for that group fails outright with an explicit error rather than a partial or degraded result. Neither limit is exotic for a small implementation, but a legal entity that has accumulated hundreds of tax codes over a decade (which describes a fair number of established Dynamics 365 customers) can hit the 1,000-character ceiling without anyone realizing it was a live risk until the process stops.

Reading the Variant Logic Correctly

Tax code variants deserve particular attention because the tool’s behavior here is deterministic in outcome but not in labeling. When the same tax code is assigned to more than one tax group with different parameters, for instance a code marked Exempt in one tax group and configured with Use Tax enabled in another, the migration creates separate variants, such as Test10, Test10_1, and Test10_2, to preserve both configurations rather than collapsing them into one and losing data. The parameter mappings themselves come through correctly, but which suffix lands on which variant is not something to assume from naming alone. Microsoft’s own documentation notes the suffix order isn’t guaranteed to follow a predictable pattern. A reviewer needs to open each variant and check its assigned tax group and parameters directly, rather than trusting that _1 always corresponds to the first tax group alphabetically or chronologically. Skipping that verification step is the most likely way a migration looks clean in testing and then produces a wrong tax determination on a specific transaction type in production.

Cash discount handling is the other area that needs a second look rather than a rubber stamp. Because the legacy model sometimes allowed cash discount settings to diverge between the general ledger parameters and individual sales tax groups, the migration surfaces a warning wherever it detects that discrepancy instead of silently picking one value. That warning is not cosmetic. It flags a real business decision, specifically which cash discount behavior should win going forward, that the automation correctly declines to make on its own.

Two enterprise IT professionals reviewing a tax migration report and dashboard

What This Means for a Dynamics 365 Tax Calculation Migration Project Plan

None of this changes the fundamental recommendation: this is a preview feature, and Microsoft’s own guidance is explicit that it is not intended for production use yet. Treat a run of the tool as generating a strong first draft of the target configuration, not a finished migration. The realistic project plan looks like importing the latest tax configuration through Electronic Reporting, enabling the preview flag in Feature Management, running the tool against a non-production legal entity, and then working through a defined review checklist. That checklist should confirm every tax jurisdiction parameter actually matches current business intent rather than just what the legacy setup happened to contain, trace every tax code variant back to its correct tax group assignment, resolve every cash discount warning as a deliberate decision, and check the default rounding method, which the tool sets to Ordinary regardless of what a given legal entity may actually need. There is also no incremental sync: if master data changes after a feature version is created, that version does not update itself, and the team has to decide whether to regenerate a new version or maintain the delta by hand.

For a solution architect scoping this work, the honest framing is that the tool changes where implementation hours go rather than eliminating them. It removes most of the manual re-entry burden and replaces it with a structured, checklist-driven review, which for a data set of any real size is still a substantially better trade than doing both the entry and the review from a blank slate. Firms that have run tax configuration projects on both the legacy and Advanced Tax Calculation models, Routeget Technologies among them, tend to build that review checklist into the statement of work up front, specifically because the tool’s own limitations (character caps, entity-by-entity scope, and the Brazil and India exclusions) are exactly the details that get missed when a migration is treated as a single automated step instead of a reviewed one.

Teams planning a Dynamics 365 tax calculation migration over the next few Wave releases should watch for this feature’s move from preview to general availability, since GA typically brings expanded country coverage and, ideally, an incremental update path. Until then, the tool is genuinely useful for what it is: a way to stop re-keying tax codes by hand and start reviewing a generated draft instead. That is a real improvement in a project that used to have no shortcut at all, even if it is not yet the fully automated migration some teams are hoping for.


#TaxCalculationService #DynamicsFinanceOps #GlobalizationStudio #ERPTaxCompliance #TaxAutomation #FinanceTransformation

Dynamics 365’s Free Sentiment Analysis Has a Blind Spot. AI Builder Sentiment Analysis Can Close It, at a Cost.

Customer experience team reviewing a sentiment analytics dashboard on a large monitor

A customer experience director at a mid-market distributor recently asked her Dynamics 365 partner for something that sounded simple: one ranked list of accounts trending toward churn, built from every piece of customer feedback the company already collects. Support conversation transcripts, service case notes, post-delivery satisfaction surveys, and the freeform comments account managers leave on Opportunity records all already exist somewhere in her Dataverse environment. She assumed the sentiment analysis her team had seen in Customer Service demos would simply read all of it. It doesn’t. Dynamics 365’s built-in sentiment analysis is real, it works well, and it costs nothing extra to use, but it only sees what happens inside a case or an email thread. Everything else on her list, the surveys, the account notes, the reseller complaints logged in a spreadsheet, sits entirely outside its reach. Closing that gap means turning to AI Builder sentiment analysis, a separate tool, and that is a deliberate build, not a setting an admin flips on.

That distinction gets lost in a lot of planning conversations, because “Dynamics 365 has AI-powered sentiment analysis” sounds like one complete capability. It is actually two separate tools, the sentiment monitoring built into Customer Service and the standalone AI Builder sentiment analysis model, with different reach, different cost structures, and different governance obligations. Confusing the two is how a CX program either overpromises what a pilot will cover or underuses a tool that is already paid for.

What Dynamics 365 Already Gives You, Free

Native sentiment analysis in Customer Service is enabled by default and configured through the admin center’s Insights settings, where a supervisor can turn on real-time monitoring in a few clicks. Once it’s on, service representatives see a live sentiment reading during an active omnichannel conversation, with configurable alert thresholds ranging from “slightly negative” up to “very negative,” and supervisors get their own notification settings so they can step in on a conversation that’s deteriorating before it becomes an escalation. Historical scoring rolls up into Omnichannel Insights dashboards for after-the-fact analysis, and the feature covers more than forty languages out of the box. As of a May 2026 release, Microsoft extended the same underlying capability to email: incoming customer messages now get scored for tone before a representative drafts a reply, and that email-level sentiment rolls into a unified case sentiment score alongside conversation data. None of this requires AI Builder, a Power Automate flow, or a separate licensing conversation. It is part of the platform a Customer Service organization is already paying for.

Where the Built-In Tool Stops Seeing Customers

The scope of that native feature is narrower than most stakeholders assume. It is wired specifically to the Case, Conversation, and Email Message records inside Customer Service, and nothing that lives outside that data model gets touched by it. A satisfaction survey captured through a Power Pages portal or a Customer Voice form sits in its own tables. Freeform notes an account manager keeps on an Opportunity or Account record are just text fields, invisible to a sentiment engine that only looks at cases. A complaint a reseller emails to a partner manager, rather than filing through a support channel, never becomes a case at all. Social commentary or review-site feedback pulled in through a connector has no case or email record to attach a score to. In the distributor’s situation, most of the feedback her CX team actually cared about lived in exactly these gaps, which is why the demo she’d seen didn’t match the reality of her own data.

Solution architect building an automated sentiment scoring flow on a laptop

What AI Builder Sentiment Analysis Adds That the Native Tool Doesn’t

This is the actual role for AI Builder sentiment analysis, and it is worth being precise about what kind of tool it is. It’s a standalone prebuilt model, not a Customer Service feature, callable from a Power Automate flow or through a Power Fx formula in a canvas app, and it has no built-in awareness of cases or email at all. It accepts up to 5,120 characters of text per call and returns a document-level classification of positive, negative, neutral, or mixed sentiment, along with a confidence score and, if needed, a sentence-by-sentence breakdown. It supports a solid set of languages, including English, Spanish, French, German, Italian, Portuguese, Dutch, Japanese, Korean, Chinese, Hindi, Turkish, and Norwegian. Because it’s just a callable action with no opinion about where its input comes from, a flow can point it at a Customer Voice survey response table, a custom “Account Note” column, a SharePoint list, or an inbox that never turns into a formal case. That flexibility, not any difference in accuracy, is the actual reason to reach for it: it lets an organization build the one unified sentiment signal the CX director wanted, rather than settling for whatever slice of the customer relationship happens to fall inside a Case record.

The Rate Limit and Credit Shift Worth Budgeting For

Two constraints deserve attention before anyone commits a rollout date. The first is technical: the sentiment analysis, language detection, and key phrase extraction prebuilt models share a single throttle of 400 calls per 60 seconds within an environment. That ceiling is comfortable for scoring cases and emails as they trickle in throughout the day, but it gets hit fast the moment someone tries to backfill a year of Opportunity notes or process five thousand quarterly survey responses in one overnight batch. This is usually the first thing that breaks when a “score everything” mandate meets real data volume, and it should shape the flow design from the start, through pacing, delay steps, or triggering only on new and changed records instead of reprocessing history, rather than getting discovered during a failed pilot.

The second constraint is financial, and it connects to a transition already underway across AI Builder. Sentiment analysis is now billed under Microsoft’s “text and generative AI tools (Basic)” capability, and its licensing is migrating from AI Builder credits to Copilot Studio credits, with AI Builder capacity add-ons and any seeded credits in premium licenses reaching end of life on November 1, 2026. Any budget built for a sentiment-expansion project running into next year should be modeled against Copilot Studio credit consumption, not against a credit pool that Microsoft has already scheduled to stop selling.

A Practical Pattern for Extending Coverage

The build itself is not complicated once the source data is identified. A Power Automate flow triggers on new or changed rows in whichever table holds the text, whether that’s a survey response, a custom account-note table, or a Power Pages-submitted complaint form, calls the AI Builder sentiment action, and writes the resulting classification and confidence score back to a column on that record. From there, a condition branch can raise a Dataverse task for the account owner when a result comes back strongly negative above a chosen confidence threshold, and a Power BI report can rank accounts by a rolling sentiment average pulled from every connected source, not just cases. That report is what actually answers the CX director’s original request. The one governance step teams tend to skip is consent: because this reaches customer-identifiable text outside the flow Customer Service already governs for case and email sentiment, legal and IT should extend the same notice-and-consent practice to whatever new source gets added, rather than assuming existing sentiment monitoring approvals already cover it.

What to Confirm Before Committing

Three things are worth verifying before committing. The inventory of where sentiment-bearing text actually lives outside the Case and Email Message tables determines whether this is a two-week Power Automate build or a multi-source integration project, so it belongs at the start, not mid-pilot. Realistic call volume needs to be estimated against that 400-call, 60-second shared limit before a rollout date gets promised to a business sponsor, because a mismatch there turns a promising pilot into an incident in its first week of production use. And finance should weigh whether the Copilot Studio credit model makes sense at the organization’s expected volume compared with calling Azure AI Language directly through a custom connector, since at higher volumes the direct route sometimes costs less and gives more control over batching, even though it takes more setup than the point-and-click AI Builder action.

Dynamics 365’s native sentiment analysis, especially now that it reaches into email as well as live conversations, already covers most of what a typical service organization needs, and it’s worth using as it stands before building anything on top of it. The gap only becomes a problem when an organization wants one sentiment signal spanning every channel a customer actually uses, most of which never turns into a case. AI Builder sentiment analysis is the right tool for that expansion, but it comes with a real throughput ceiling and a licensing model mid-transition, not a checkbox next to a feature Microsoft already includes. Teams at firms like Routeget Technologies that have wired sentiment scoring into Dataverse tables outside the standard Customer Service model tend to start with that inventory step, because it’s usually where the real scope of the project gets decided, before anyone opens Power Automate.


#AIBuilder #DynamicsCustomerService #PowerAutomate #ChurnPrevention #CustomerExperience #EnterpriseAI #Dataverse

IoT Intelligence Is Out in Dynamics 365 Asset Management. Sensor Data Intelligence Moves the Azure Bill to You.

IT operations manager reviewing an asset health and sensor monitoring dashboard in a manufacturing control room

An IT director running Dynamics 365 Supply Chain Management for a mid-size manufacturer recently got a message she wasn’t expecting: the IoT feature her maintenance team had been quietly piloting inside Asset Management was being replaced. Not patched, not extended. Replaced, with a new name, a new architecture, and a new owner for the Azure infrastructure underneath it. Microsoft’s own documentation is blunt about it: “Do not start any new projects based on the existing IoT Intelligence feature.” The successor, Sensor Data Intelligence, is where new work is supposed to go instead.

This isn’t a minor renaming exercise. It’s a genuine shift in who is responsible for the cloud plumbing behind predictive maintenance in Dynamics 365, and it lands squarely on any organization that has connected sensors, meters, or PLCs to Asset Management, or has been planning to. For CIOs and IT directors weighing whether to invest in condition-based maintenance on the Dynamics 365 platform, the mechanics of this transition matter more than the rebrand suggests.

What Actually Changed

IoT Intelligence was the original bridge between physical assets and Asset Management inside Dynamics 365 Supply Chain Management. Sensor readings, whether from a vibration monitor on a pump or a temperature probe on a cold-storage unit, flowed into Azure IoT Hub and then into Supply Chain Management, where they could trigger alerts, feed maintenance plans, or update asset condition records. Critically, Microsoft managed much of that Azure infrastructure on the customer’s behalf. It worked, but it was rigid: limited room to customize the data pipeline, and friction when a customer wanted to bring in sensor data from a system that wasn’t a clean fit for the prebuilt model.

Sensor Data Intelligence, now in preview and documented as an updated, renamed version of IoT Intelligence, rebuilds that pipeline with a different deployment philosophy. Instead of Microsoft hosting and managing the Azure components, the organization deploys them into its own Azure subscription. Setup runs through an onboarding wizard rather than the manual configuration in Lifecycle Services that IoT Intelligence required. On paper, that is a usability improvement. In practice, it also means the Azure resources involved, connecting sensors through Azure IoT Hub and the broader industrial IoT ingestion pattern Microsoft points customers toward, now belong to the customer’s tenant, not Microsoft’s.

Wireless industrial sensor mounted on factory equipment with a technician viewing vibration data on a tablet

Why Microsoft Restructured It This Way

The stated reasons are customization and integration. A Microsoft-managed pipeline is easy to stand up but hard to bend. Organizations that wanted to route sensor data through an existing Azure Digital Twins model, apply their own retention and encryption policies, or connect equipment from a vendor whose telemetry format didn’t match the built-in assumptions were working against the platform rather than with it. Moving deployment into the customer’s own subscription removes that ceiling. It also happens to align with a broader pattern across the Dynamics 365 and Power Platform ecosystem this year, where more of the underlying Azure footprint is being handed to customers to own and configure directly, rather than abstracted away entirely.

That tradeoff is worth naming plainly, because it changes who needs to be in the room for this decision. Adopting Sensor Data Intelligence is no longer purely a Dynamics 365 configuration project that a functional consultant can carry alone. It is an Azure architecture decision, and it needs a cloud engineering resource involved from the start, someone who can make calls about network isolation, subscription structure, and how sensor telemetry ingestion fits into the organization’s existing Azure governance model.

The Six Scenarios Sensor Data Intelligence Is Built Around

Microsoft’s documentation frames the preview around six specific business scenarios, and each one maps to a different maintenance or production pain point rather than being a generic “connect your sensors” pitch. Asset downtime tracking uses sensor readings to measure actual machine efficiency against expected performance, giving maintenance planners a real-time efficiency signal instead of relying on manually logged downtime events after the fact. Asset maintenance ties incoming sensor readings directly to the goal of reducing maintenance cost, which in practical terms means condition data can inform when a maintenance plan should actually trigger rather than running purely on a fixed calendar schedule. Machine status notifications alert production planners the moment equipment goes down, cutting the lag between a physical failure and a scheduling response. Product quality scenarios compare live sensor readings against defined quality thresholds, catching drift before it turns into a batch of rejected output. Production auto-reporting uses sensor thresholds to automatically report finished quantities, removing a manual data-entry step from the shop floor. And production delay tracking compares actual cycle time against planned cycle time, surfacing bottlenecks that would otherwise only show up after the fact in a variance report.

None of these six scenarios require a from-scratch build. They come as templates within the new model, which is a meaningful head start for organizations that don’t have the internal bandwidth to design an IoT-to-ERP data pipeline from first principles. But a template is not the same as a finished solution, and each one still needs to be mapped against the specific sensors, thresholds, and maintenance workflows already in place at a given plant.

What Belongs on a Decision-Maker’s Checklist

The preview status is the first thing worth sitting with. Microsoft’s own terms are explicit that preview features aren’t meant for production use and carry restricted functionality, so any organization currently relying on IoT Intelligence for live maintenance decisions is not looking at a drop-in replacement they can adopt today. They are looking at a migration to plan for, on a timeline Microsoft has not published in its formal deprecation schedule. Checking Microsoft’s removed and deprecated features documentation for Supply Chain Management shows plenty of other retired capabilities listed with version numbers and dates; IoT Intelligence, as of this writing, is not one of them. That gap between “don’t build new things on this” and an actual scheduled retirement date is exactly the kind of ambiguity that should push a cautious organization toward an early conversation with Microsoft or its implementation partner rather than a wait-and-see approach.

Budget conversations need to happen earlier than usual, too. When Microsoft manages the Azure components behind a feature, the cost of that infrastructure is effectively invisible to the customer, folded into the overall service. Once the deployment sits in the customer’s own subscription, IoT Hub throughput, storage, and any downstream compute for the sensor data pipeline become line items the organization has to provision, monitor, and pay for directly, governed by whatever cost management and tagging discipline already applies to the rest of its Azure estate. That is not necessarily a bad outcome. Full ownership of the infrastructure also means full visibility into what it costs and full control over where it runs, which matters for organizations with strict data residency or network segmentation requirements that a Microsoft-managed black box never let them satisfy cleanly.

Finally, this is a good moment to audit what IoT Intelligence usage already exists in the environment, even informally. A maintenance team that connected a handful of sensors as a proof of concept two years ago may not have flagged that project to IT as a dependency, and a preview migration is the wrong time to discover a shadow deployment that nobody owns.

The Bigger Pattern Behind the Rename

Sensor Data Intelligence is a small feature in the context of the broader Dynamics 365 Supply Chain Management platform, but it is a clear example of a decision Microsoft is making more often across the ecosystem: put the Azure infrastructure in the customer’s hands and trade managed simplicity for architectural control. That is generally the right long-term direction for organizations with mature cloud governance. It is a heavier lift for organizations that treated Dynamics 365 as a self-contained ERP system and never built out the Azure engineering capability to match. Teams at Routeget Technologies that have supported Asset Management deployments through platform transitions like this one typically start by mapping the existing sensor footprint and the target Azure subscription model before touching the Sensor Data Intelligence onboarding wizard itself, since getting that architecture right the first time avoids a second migration a year later.


#AssetManagement #SensorDataIntelligence #IoTinERP #PredictiveMaintenance #AzureGovernance #SupplyChainAutomation

The Sales Close Agent Retirement Isn’t a Feature Swap. It’s a Platform Move.

Solution architect reviewing AI sales agent configuration dashboards on a dual-monitor workstation

A Dynamics 365 Sales architect who spent March configuring the Sales Close Agent for a client’s inside sales team is about to find out that work has an expiration date. September 30, 2026 is the last day anyone can stand up a new instance of the agent. October 30 is the day every existing instance, configured playbooks and all, gets pulled from every environment where it runs. Neither date has gotten much attention outside Microsoft’s own deprecation notes, and the Sales Close Agent retirement comes with a single sentence of guidance: create an instance of Sales Development Agent instead. For a solution architect who built engagement rules, email cadences and knowledge sources around the old agent, that sentence undersells how different the replacement actually is.

Solution architect reviewing sales automation agent configuration on a dual-monitor workstation

What the Sales Close Agent actually does today

Sales Close Agent, still labeled a production-ready preview, was built to run high-velocity, low-complexity deals without a seller touching them until something goes wrong. It works against accounts, contacts, leads and opportunities that match target-customer criteria an admin defines during setup, then sends templated outreach email pulled together from a configured profile, product catalog and a set of knowledge sources. Everything about the agent lives inside Dataverse and Copilot Studio: admins configure it through a settings page inside the Sales Hub, security is granted through custom or out-of-the-box Salesperson roles, and every run is tracked as a record in the msdyn_salesagentrun entity, filterable by status (active, completed, failure) and viewable through standard model-driven views like “Opportunities from Sales Close Agent.”

The mechanics underneath are more rigid than most admins expect once they read past the marketing description. The agent caps outreach at 20 emails per ten-minute window, specifically to control AI credit consumption rather than deliverability. Follow-up cadence is fixed at up to four emails over three weeks and isn’t configurable without a support ticket to Microsoft. If a customer goes quiet, the agent auto-closes the record as lost; if it detects an objection past its comfort level, it escalates to a human seller with full interaction history attached to the record’s timeline. None of that is unreasonable for a first-generation automation feature. It’s also all going away in a matter of weeks, and unlike most Dynamics 365 retirements, this one comes with no in-product migration wizard.

The Sales Close Agent retirement doesn’t come with a migration path

Sales Development Agent, the named successor, doesn’t live in Dynamics 365 Sales at all. It’s a Microsoft Agent 365 offering, deployed and configured from inside Microsoft Teams, currently gated behind the Frontier preview program and requiring an organization to have opted into Microsoft 365’s Targeted Release track for the relevant users, or the whole tenant. That single prerequisite is worth checking before anything else, because an architect who assumes the replacement will simply appear in the Power Platform admin center the way Sales Close Agent did will instead find nothing there to configure. The agent is deployed from the Teams Store or the Microsoft 365 Copilot agent store, and every bit of its setup happens conversationally: you tell it, in a Teams chat, to define a playbook, share sample emails so it can match your tone, upload product documentation as PDFs or Office files, and set a send window such as weekdays between nine and five Pacific.

That configuration model is a real structural difference, not just a change of interface. Sales Close Agent’s behavior comes from admin console pages: profile, product details, target customers, email delivery, email content, knowledge sources, each with its own screen and its own “avoid edits after publishing” warning. Sales Development Agent’s behavior comes from four looser components (playbook, guidelines, product knowledge, and settings) assembled through natural-language instructions inside a chat thread, then validated by uploading a test prospect list and running simulated conversations before typing “go live.” An architecture team used to documenting agent configuration as a set of screenshots from admin pages will need a different documentation approach entirely, since there’s no settings UI to screenshot.

Reconnecting it to Dynamics 365 isn’t automatic either

If Dynamics 365 is the system of record, Sales Development Agent doesn’t sync with it by default. Connecting the two is an explicit, multi-step process: assign the agent a Sales license in the Microsoft 365 admin center, add it to the Dynamics 365 Sales instance with a Salesperson role through the Power Platform admin center, enable the Dataverse Model Context Protocol server in that environment, publish that MCP server using VS Code or the Agent 365 CLI, and then wait for a Global Administrator or AI Administrator to approve the resulting server request before the agent can pull prospect lists from Dataverse or write engagement history back to lead records. That approval step alone means CRM integration for the new agent isn’t something a Sales Hub admin can finish alone; it requires a security decision from someone with tenant-level access, on a timeline that doesn’t care whether your old agent is a week from deletion.

Team collaborating around a Teams-based AI agent configuration screen with sales pipeline data

What this means for a migration plan

Treat this less like a version upgrade and more like standing up a new integration on a deadline. There is no data or configuration carryover: target-customer criteria, product catalog mappings and knowledge source references built into Sales Close Agent don’t transfer, because the two agents don’t share a configuration schema. Prospect data for the new agent needs to arrive as a CSV or Excel file with specific column requirements (email, company name, product, first name, with optional language and country columns for its 22 supported languages), which is a different intake format than anything the old agent’s target-customer configuration expected. And because the replacement currently sits behind Frontier and Targeted Release enrollment, the realistic first step for most teams isn’t configuration at all, it’s confirming with the Microsoft 365 admin whether that enrollment exists yet, since a tenant that isn’t enrolled has no path to the replacement on October 30 regardless of how well the rest of the migration is planned.

Worth flagging to any CFO or IT Director signing off on this work: Sales Development Agent, as documented today, runs without a per-action approval step once it’s live, replies only to email threads it personally started, and has no visual reporting dashboard, with campaign and prospect summaries delivered as answers inside a Teams chat instead. None of those are dealbreakers for a lead-qualification workflow, but they are a materially different governance posture than a Dataverse-native agent whose every run is a queryable, reportable Dataverse record. A rollback plan matters here in a way it usually wouldn’t for a routine feature update, since the source system disappears on a fixed date whether or not the destination is ready.

The narrow window that actually matters

Ten days separates today from the last date to create a new Sales Close Agent instance, and forty days separates it from the date every existing instance disappears regardless of migration status. Neither Microsoft’s release-plan entry nor its deprecation notice describes a bridge between the two agents beyond that single line of guidance, which leaves the actual migration work, mapping old configuration intent to new playbook language, resolving the Frontier and Targeted Release prerequisite, and running the MCP server approval chain, entirely on the implementation team. Routeget Technologies has walked several clients through comparable agent-to-agent platform moves inside the Dynamics 365 ecosystem this year, and the pattern holds here too: the teams that treat this as infrastructure work, with its own project plan and its own risk review, come through it in better shape than the teams who wait for the in-product banner to remind them.


#SalesCloseAgent #SalesAIAgents #Agent365 #CRMGovernance #AgentMigration #DataverseMCP

Time Zone-Agnostic Resource Planning Fields Reached GA in Project Operations. Extend Booking Still Isn’t Automatic.

Resource manager reviewing a project scheduling timeline with time zone indicators on a large office display

A resource manager in Chicago books a developer in Manila for a two-week sprint starting Monday at 9 a.m. The booking looks correct in the schedule board. Three weeks later, someone extends that booking by a week, and the new segment quietly starts two hours later than anyone intended, because the underlying date fields were interpreted in the resource manager’s time zone, not the resource’s, and the assignment profile that governs the extension only overlapped with the developer’s working day by a narrow window. Nobody notices until the invoice reconciliation shows unbilled hours that don’t match the timesheet. This is not a hypothetical edge case for any organization running distributed delivery teams on Dynamics 365 Project Operations. It is the default behavior the platform has shipped with since resource scheduling first launched, and as of September 2026, Microsoft has finally shipped time zone-agnostic resource planning fields, giving administrators a way to turn off that recalculation for the fields where it causes the most damage.

Resource manager reviewing a project scheduling timeline with time zone indicators on a large office display

What time zone-agnostic resource planning fields actually change

The feature, tracked under Message Center announcement MC1465316 and published in the Dynamics 365 Project Operations 2026 release wave 1 plan, reached general availability in September 2026 (Microsoft’s own release plan lists the month without a specific day, while the Message Center post cites September 30). It lets administrators configure resource requirement and resource booking start and end dates so they are stored and displayed without automatic time zone conversion, rather than being silently recalculated based on whichever user’s personalization settings happen to be active when a record is viewed or edited.

Under the platform’s existing behavior, a resource requirement’s dates are date-time fields, and Dataverse date-time fields carry a time zone behavior setting: user-local, time zone-independent, or date-only. Most of the scheduling entities in Project Operations were built as user-local by default, which is exactly what causes the Manila example above. A record entered by someone in Central Time and viewed by someone in a different zone gets recalculated on the fly to match the viewer’s offset. That is a reasonable default for a calendar invite. It is a poor default for a resource requirement that a project manager in one country, a resourcing specialist in another, and an automated allocation engine somewhere in the middle all need to interpret identically.

Why this has been a real operational problem, not a cosmetic one

The root cause sits in how Project Operations already handles time zones for projects and tasks, and it predates this release. A project’s time zone is inherited from the work hour template applied to it. Dates on the project form are shown relative to the logged-in user’s time zone on every tab except Tasks, where dates always render in the project’s own time zone. That inconsistency alone trips up new administrators. Layer resource bookings on top, and the practical failure mode Microsoft’s own documentation describes is the Extend Booking scenario: a bookable resource needs at least one minute of overlapping work time with the assignment profile used to define the extension, or the extension either fails or lands at an unexpected time. In practice, teams have worked around this by insisting device time zones match Dynamics 365 personalization settings exactly, which is a fragile control to enforce across a distributed workforce and does nothing to fix the underlying data model.

The financial exposure is not abstract. Project Operations bookings feed resource utilization reporting, and utilization numbers feed billing for time and materials engagements. A booking that silently shifts by two hours because of a time zone recalculation does not usually change the total hours booked, but it does change which calendar day or which shift a resource shows as committed, and that mismatch is exactly the kind of discrepancy that turns a routine month-end reconciliation into a multi-hour investigation. For organizations running global delivery models where a single project pulls resources from three or four time zones, this has been a recurring, quietly expensive class of data integrity issue rather than a one-off annoyance.

Solution architect at a dual-monitor workstation reviewing a resource booking schedule board across time zones

What actually changes once you enable it

Enabling time zone-agnostic behavior on resource requirement and booking date fields converts them from user-local to time zone-independent at the platform level. Once that switch is made, the stored value for a start or end date stops being reinterpreted based on the viewer’s personalization settings. Everyone who opens that record, regardless of where they are logged in from, sees the same date and time. This is the same mechanism Dataverse has long supported for other entities; Project Operations is catching up by extending it to the specific tables where resource planning data lives.

Two things are worth flagging before you flip this on for a live environment. First, this is an opt-in configuration change, not a default behavior swap, so existing bookings created under user-local semantics do not automatically reinterpret themselves; plan for a validation pass on in-flight bookings after enabling the feature rather than assuming historical data self-corrects. Second, the Extend Booking overlap requirement between resource and assignment profile working hours does not disappear just because the date fields are now time zone-independent. That constraint is a scheduling logic rule, not a date-storage rule, and it will still reject or misalign an extension if a resource’s working calendar genuinely does not overlap with the profile driving the extension. Time zone-agnostic fields fix the data consistency problem. They do not fix a genuinely misconfigured working calendar.

A practical rollout sequence

Start by auditing which projects and resource pools actually span more than one time zone today; if your delivery model is single-region, this feature is low priority regardless of how appealing it sounds. Where it does apply, enable the setting in a sandbox environment first and pull a sample of active bookings that were extended or modified in the last quarter, then compare their displayed start and end times before and after the change for a handful of test users logged in from different time zones. That comparison is the fastest way to confirm the fields are behaving as time zone-independent rather than assuming the toggle worked from the release notes alone.

Next, reconcile resource calendars against project work hour templates for any team that has triggered Extend Booking issues in the past. Since the overlap requirement is unaffected by this change, this is the moment to fix calendar misalignments you may have been tolerating as a known quirk. Finally, update any Power Automate flows or integrations that read resource booking dates directly, since a flow written to expect user-local conversion behavior will now receive a raw, unconverted value, which is the correct behavior going forward but a breaking change for logic that implicitly depended on the old conversion.

The bigger pattern worth watching

This release is a narrow fix, but it points at a broader gap in how Project Operations was originally modeled for single-region delivery and is now being retrofitted for genuinely distributed teams. Organizations that have built manual device-time-zone-matching policies as a workaround should treat this as an opportunity to retire that policy rather than run both approaches in parallel indefinitely. For firms like Routeget that implement and support multi-region Project Operations deployments, this is exactly the kind of platform change worth validating in a client’s sandbox before it reaches their production resourcing team, since the difference between a correctly configured rollout and a rushed one is measured in reconciliation hours saved every single billing cycle.

Sources: Microsoft Learn, “Overview of Dynamics 365 Project Operations 2026 release wave 1” and the associated planned-features page for “Use time zone-agnostic fields in resource planning” (public preview March 31, 2026, general availability September 2026); Message Center announcement MC1465316; Microsoft Learn, “Manage multiple time zones” (Project Operations resource management documentation) for the Extend Booking overlap requirement and project/task time zone inheritance behavior.


#ProjectOperations #ResourceScheduling #TimeZoneManagement #DynamicsFinanceOps #ProjectBillingAccuracy