Offline-First Architecture in Power Apps Canvas Apps: Building Resilient Mobile Solutions Without Connectivity Dependency

Offline-First Architecture in Power Apps Canvas Apps: Building Resilient Mobile Solutions Without Connectivity Dependency

Field workers don’t wait for connectivity. A delivery driver doesn’t pause at a dead zone. A maintenance technician doesn’t delay equipment inspection because the site lacks reliable Wi-Fi. Yet many organizations ship Power Apps canvas applications that fail the moment the network drops, forcing users to pause work, travel to find a signal, or discard hours of local effort.

Building applications that survive and thrive in disconnected states requires a fundamental shift in how developers approach data flow, synchronization, and user feedback. Power Apps now provides the native tooling for offline-first architecture through Dataverse offline capabilities, but tooling alone is insufficient. The architecture decision determines whether offline works as a seamless fallback or a frustrating degradation.

#

The Cost of Connectivity Dependency

Most cloud-native applications assume the network exists. They send every keystroke to the server. They fetch fresh data on every screen load. They fail silently when the connection drops, leaving users confused about whether their work was saved, and frustrated by the inability to continue.

In field operations, this assumption is expensive. A field service technician working in a warehouse with intermittent coverage might spend 15 to 20 percent of their day waiting for connectivity or navigating to find signal. A delivery driver can’t complete 200 stops per day if each stop requires a network roundtrip for product information. The business impact compounds across teams: lost productivity, missed time windows, and poor user adoption of technology that feels unreliable.

Offline-first architecture inverts this model. The application assumes disconnection is normal. Data lives locally on the device first. Synchronization happens when connectivity permits, not on every operation. Users continue working through network gaps. The architecture becomes resilient by design rather than optimistic about network availability.

#

Offline Capabilities in Power Apps: Current Landscape

Power Apps canvas apps now have built-in offline support for Dataverse connections. This is not a crude “cache the last fetch” approach. The platform provides structured offline profiles, selective data download, conflict detection, and synchronization queuing.

Offline profiles define which tables, columns, and records are available offline. A solution architect designs a profile for each use case: what data does a field technician need to complete their work without connectivity? What’s the acceptable device storage footprint? A profile with minimal data loads faster and consumes less battery and storage. A profile with comprehensive data gives users more autonomy but requires more device resources.

The platform supports filtering within a profile. A delivery driver’s offline profile might include only their assigned stops for the current day and product catalog data relevant to those stops, not the entire order history or every product in inventory. This selective download is critical for both performance and user experience.

Dataverse offline handles synchronization automatically. When connectivity returns, the platform queues pending creates, updates, and deletes. The sync engine submits these operations in order and handles network transience: temporary disconnections don’t fail the sync. The platform retries intelligently.

Conflict detection works at the row level. If a user modifies a record offline and a change arrives from another user during that offline period, the platform detects the conflict and surfaces it through the app’s error-handling logic. The developer chooses the resolution strategy: last-write-wins, user-prompted merge, or rejection.

#

Designing Offline-First Architecture

Offline success requires deliberate design at multiple layers.

Data Selection Strategy. Define what data users need to complete their work. A field technician repairing HVAC equipment needs equipment history, service bulletins, parts inventory, and customer contact information. They do not need the company’s entire customer directory or historical service records from five years ago. Start with the minimal dataset that enables work continuation. Allow advanced users to download additional data for longer offline periods.

Offline Profiles as Contracts. An offline profile is a contract between the developer and the device. It defines the authoritative set of data available offline. Changes to a profile cascade through every user’s device on the next sync cycle. Version your profiles explicitly. Communicate profile changes to field teams before release. A profile change that adds 500 MB of data can render older devices unusable.

Sync State Visibility. Users need to know whether data is fresh from the server or stale from the local cache. Build UI that indicates sync status: last successful sync time, pending changes count, and current sync progress. Show users when data came from offline storage, not necessarily as an error but as a factual state. Some users will intentionally use offline data they understand to be recent enough for their task.

Graceful Degradation of Features. When offline, not all features work. Complex filters requiring real-time lookups fail. Write operations that depend on server-side logic (validations, calculations, updates to related records) may queue for synchronization. Design features that degrade cleanly: simple operations work offline immediately, complex operations queue for later execution, unavailable operations display clearly why they’re unavailable.

Conflict and Error Handling. Define how the app responds to sync conflicts. For most field operations, last-write-wins is unacceptable because it silently discards work. Instead, implement explicit conflict detection: when a conflict occurs, pause the affected record, alert the user, and provide merge options. For example, if a customer contact updates a work order while the technician is also editing it offline, the app should present both versions and ask the user to reconcile.

Similarly, define error categories. A failed write due to business rule violation (insufficient inventory for this transaction) is different from a network timeout. The app should handle each differently: business rule violations require user action to resolve, while timeouts trigger retry logic.

#

Implementation Patterns

Request Data Sparingly. Minimize the data footprint by filtering aggressively. If a user works with 50 customers, download data for 50 customers, not 5,000. Use Dataverse filters in the offline profile definition.

Cache User Context Locally. Store the current user’s ID, role, and basic preferences locally during the first sync. Use this cached context for permissions checks and role-based feature flags that work offline, rather than requiring a server roundtrip every time.

Implement Progressive Download. Start with essential data (today’s work items, immediate customer data). Allow users to request expanded data sets for offline use: “Download full customer history for offline access” triggers a background sync. Progressive download prevents app startup from being blocked on large downloads.

Design for Eventual Consistency. In offline-first systems, data is eventually consistent, not immediately consistent. A user creates a work order offline. It syncs to the server when connectivity returns. Another user querying the server doesn’t see it instantly. Build workflows that tolerate this latency: don’t expect immediate visibility of offline changes across the team until sync completes.

Monitor Sync Failures. Implement diagnostics. Log failed sync operations and the specific errors returned. Expose this information to support teams and administrators so they can diagnose why a user’s data isn’t synchronizing. A sync failure that goes unnoticed for days can leave a user working with stale data indefinitely.

#

Common Pitfalls

Overloading Offline Profiles. Including too much data in an offline profile leads to slow device performance, high battery drain, and storage conflicts on older phones. Start minimal. Let users explicitly expand the profile if they need more data.

Ignoring Battery and Storage Constraints. Mobile devices have finite battery and storage. Large offline profiles with frequent sync cycles drain battery rapidly. Design sync to happen periodically or on user trigger, not continuously.

Silent Data Loss on Conflict. Never implement silent conflict resolution that discards user work. Always surface conflicts explicitly and require user action to resolve.

Treating Offline as a Rare Edge Case. Offline is not a rare edge case for field operations. It’s the normal state punctuated by brief connectivity windows. Design for that reality.

#

Building for Resilience

Offline-first architecture shifts the burden from hoping connectivity works to ensuring the application works despite connectivity gaps. Power Apps provides the platform capabilities. The architect must design the data strategy, synchronization policy, and error handling to match the deployment reality of field operations.

The organizations that ship resilient field applications don’t apologize for network conditions. They design around them. Users work when connectivity permits synchronization and when it doesn’t. The application adapts to the network’s unpredictability rather than depending on the network’s reliability.

—

Consolidating Customer Intelligence: How Dynamics 365 Customer Data Platform Transforms Sales Pipeline Visibility and Revenue Forecasting

Your sales team operates across fragmented data sources. Pipeline data lives in the CRM. Customer account history sits in a separate system. Communication touchpoints scatter across email, Teams, and LinkedIn. Finance holds contract and payment data. The result is predictable: deal visibility remains partial, forecasting depends on gut feel rather than complete customer context, and sales reps waste cycles hunting information instead of closing deals. This fragmentation costs money. It slows deal progression. It creates forecast errors that ripple into quarterly results.

The underlying problem is not tool proliferation—it’s that modern selling requires a unified understanding of each customer that no single application delivers on its own. This is where Dynamics 365’s Customer Data Platform (CDP) capabilities enter the picture. The CDP layer consolidates disparate customer records, interactions, and context into a single coherent view, giving sales and finance teams the integrated information they need to execute reliably.

Understanding the CDP Layer in Dynamics 365

Dynamics 365 includes customer data management functionality built directly into Customer Insights (formerly Dynamics 365 for Customer Insights), which integrates tightly with Sales, Finance, and Operations. This CDP capability differs from third-party CDP platforms because it starts with enterprise transaction data already flowing through your Dynamics ecosystem, rather than attempting to ingest and map data from external sources. The practical benefit: implementation complexity drops, data quality improves because you’re working with source records you already own, and the unified customer view connects back to operational systems without middleware translation layers.

The CDP ingests records from multiple origins: Dynamics 365 Sales accounts and contacts, historical transaction data from Finance and Operations, marketing interaction data from automated campaigns, customer service interaction logs, Azure Data Lake connections for external data sources if needed, and real-time activity feeds from Teams or other collaboration tools your team uses. These records flow through entity mapping and deduplication logic (matching logic that identifies when two records represent the same real-world customer despite different IDs across systems), then resolve into unified customer profiles. Each unified profile becomes queryable and actionable within Sales, Finance, and Operations applications. This unified profile is what changes how your sales and finance functions operate.

How Unified Customer Profiles Impact Sales Execution

Consider a tangible scenario. A sales rep is preparing for a renewal discussion with a mid-market customer. Today, the rep opens the opportunity record in Dynamics 365 Sales and sees contract value and contract end date. To understand the customer’s actual spend across the organization, the rep must open a separate Finance portal to check accounts payable and payment history. To understand what support issues the customer has logged, the rep logs into Service separately. To understand whether this customer recently attended a product webinar or downloaded content, the rep logs into a separate marketing system. By the time the rep assembles this picture, an hour has passed. Worse, details often get missed because the rep doesn’t know which systems to check.

With Customer Data Platform unification, the rep’s unified customer profile surfaces all this context—recent transaction history, open support cases, known business issues, prior interactions, marketing engagement, and contract renewal dates—in a single pane. The context is there when the rep opens the account record. This changes the tone of the renewal conversation. The rep arrives prepared, knows what matters to the customer, and can propose relevant solutions rather than generic upgrades. Renewal close rates improve. Contract values increase because the rep understands the customer’s full operational context and can pitch solutions that address known pain points.

For finance and sales leadership, the same unified data improves forecast accuracy. CFOs and Sales VPs rely on accurate pipeline forecasting to guide capital allocation and operational planning. Yet pipeline forecasts built from incomplete customer context tend to be overoptimistic (reps weight deals more heavily than customer context supports) or miss risks (a customer with chronic payment issues or support problems may be churning despite apparently healthy active contracts). With complete customer history—including payment patterns, support escalations, prior upsells, and customer health scores—finance and sales can calibrate forecasts more accurately and identify deals at risk before they stall or slip.

The Enablement Challenge: From Unified Data to Behavioral Change

Consolidating data is the technical step. Driving adoption is where most organizations stumble. Sales reps trained on the old approach often continue checking separate systems by habit. Finance teams accustomed to a specific reporting layout may not immediately recognize the productivity gains available through the unified view. Implementation plans that skip enablement frequently result in the CDP sitting unused while teams continue fragmented workflows.

Effective deployment requires three parallel workstreams. First, map your data unification to specific business processes (how does complete customer context improve the renewal process? how does it change forecast calibration?). Second, train reps and analysts on the new workflow before go-live so they understand not just where information is, but why the consolidated view matters to their specific job. Third, measure outcome improvement (did deal cycle time drop? did forecast accuracy improve? did upsell rates increase?) and share results back to the team monthly so adoption feels like an improvement, not a mandate.

Organizations that execute these elements well see results within ninety days. Reps spend less time searching and more time on high-value customer conversations. Finance forecasts settle into a tighter range, reducing revenue surprises. Cross-sell and upsell attach rates increase because sales now has complete visibility into where each customer has already invested. Support organizations respond faster because they understand the customer’s business context and can diagnose issues more accurately.

Integration Across Finance, Sales, and Operations

The CDP doesn’t exist in isolation. Its value multiplies when integrated across Finance, Sales, and Operations workflows. Finance can see which customers are revenue-concentrating risks and flag them for relationship reviews. Operations can identify customers with persistent operational issues and proactively propose solutions. Sales can see predictable expansion opportunities because the unified profile reveals gaps where the customer already uses related products. This cross-functional visibility transforms the customer relationship from transactional (invoice, support, deal) into strategic (long-term value, risk management, growth potential).

The technical architecture matters here. Many organizations implement CDPs that require separate tools and manual integration points. Dynamics 365’s integrated CDP avoids this. Data flows directly from Sales, Finance, and Operations into unified profiles managed within the same ecosystem. This means no middleware delays, no data synchronization errors, and no expensive integration projects. Updates to customer records in any application reflect immediately in the unified profile and back to all other applications consuming that profile.

Timeline and Considerations for Your Organization

CDP deployment typically spans three to four months from planning to operations: four to six weeks of data mapping and quality assessment, four weeks of deduplication logic refinement and profile unification, two to three weeks of application configuration and workflow integration, then two to four weeks of enablement and controlled rollout. Organizations with complex multi-subsidiary structures or legacy data quality issues may extend this timeline, but the basic arc remains predictable.

The primary financial consideration is not software licensing (your Sales, Finance, and Operations seats already include CDP capabilities), but rather the implementation effort: data analyst and architect hours to map records, Dynamics configuration expertise for profile design and workflow connections, and business analyst time for enablement and change management. Typical deployment budgets range from 300,000 to 600,000 USD for mid-market organizations, depending on data complexity and number of integrations required. The return on investment materializes through improved forecast accuracy (fewer revenue surprises), faster deal cycles, higher renewal rates, and increased cross-sell attach. Organizations that measure these metrics often see payback within a year.

The first decision point is simple: do your sales and finance leadership teams have complete visibility into each customer’s operational footprint and financial relationship with your organization? If the answer is no, if your teams currently check multiple systems to understand a customer, if forecast accuracy remains soft despite a robust pipeline process, then CDP unification addresses a real and measurable business gap. The question is not whether Dynamics 365 can unify your data, but whether your sales and finance functions are ready to operate differently once that unification happens.


#DynamicsCDP #CustomerDataPlatform #SalesForecasting #CustomerInsights #SalesExecutionD365 #RevenueForecasting

Handling Long-Running Operations in Dataverse Plugins: Async Processing Patterns and Monitoring High-Volume Batch Jobs

Long-running operations in enterprise Dataverse environments present a consistent challenge. A synchronous bulk import that takes seven minutes blocks user interactions for seven minutes. A validation rule that queries 50,000 related records across subsidiaries times out and fails silently. A financial posting process that updates 15,000 journal entries locks user access and leaves the system unresponsive. These are not edge cases or theoretical problems; they represent the difference between a predictable, scalable system and one that feels brittle under actual load.

The Dataverse asynchronous (async) processing model exists precisely because these patterns are inevitable in real-world implementations. Understanding how async operations work, when to use them, and how to monitor them is foundational for any developer or architect responsible for high-volume or long-running data operations.

Why Synchronous Processing Fails Under Load

Synchronous operations execute immediately in the calling thread, blocking until completion. For most operations this is fine. A validation plugin that runs in 50 milliseconds does not materially impact the user. But three things happen when operations cross a certain time threshold.

First, the user’s request hangs. A form save takes seven seconds instead of 500 milliseconds. The application appears frozen. Users click buttons again. Connections time out. The business process stalls.

Second, database locks accumulate. Long-running updates hold locks on affected rows. Concurrent operations queue behind those locks. Queries that should take 100 milliseconds now take 10 seconds waiting for locks to release. The performance problem cascades across unrelated processes.

Third, plugin execution context serializes certain operations, creating bottlenecks. The platform enforces timeout limits on synchronous plugin execution (two minutes in most configurations). Exceed that, and the operation fails. If your plugin processes 10,000 records per invocation and crosses the timeout, the entire transaction rolls back. All work is lost, leaving data partially updated.

Asynchronous processing solves this by removing the blocking behavior entirely. Work is queued, executed in the background, and does not block the original request.

How Dataverse Async Operations Work

When an asynchronous plugin or workflow executes, Dataverse follows this sequence. First, the event occurs and synchronous plugins run to completion. Then, the platform serializes the execution context (the data object that the async operation will receive) and creates an AsyncOperation record in the system jobs table. That record enters a queue, ordered by creation date. When background resources become available, the system picks up the AsyncOperation record and executes the async plugin as if it were a synchronous operation running in its own isolated context.

This architecture has important implications. The async operation runs completely independently. It cannot see changes made to the original record after the async job was queued. It cannot throw exceptions that bubble up to the user; the user’s transaction completes successfully regardless of whether the async job eventually fails. If the async job fails, the failure does not cascade to the original data modification. The system records the failure in the AsyncOperation table, but the original record update stands.

The queue is first-in, first-out by default, but the system evaluates resource availability continuously. A job can remain suspended if the system is resource-constrained. High-volume environments often experience queuing, where jobs wait in the ready state until resources open up. Monitoring these queues is essential.

Async Patterns for High-Volume Operations

The dependency token pattern enables serialized async execution when order matters. Two async jobs created with the same DependencyToken value execute serially in creation order rather than in parallel. This is critical for scenarios where later work depends on earlier work completing first. For example, if job A aggregates revenue and job B calculates cost of goods sold based on job A’s output, assigning both the same dependency token ensures B waits for A.

However, dependency tokens apply only to async plugins that the system creates automatically. If your code manually enqueues async work, this mechanism does not apply. In those cases, custom coordination logic is necessary.

For truly high-volume scenarios, consider batching patterns. Instead of creating one async job per record, group records into batches and create one job per batch. A financial posting process might create one async job for every 500 journal entries rather than one job per entry. This reduces queue size, improves efficiency, and simplifies monitoring. The tradeoff is that if a batch fails, all records in that batch require reprocessing.

Monitoring AsyncOperation records is not optional in high-volume environments. Set up automated queries to track job states. Dataverse groups jobs into states: Ready (waiting for resources), Suspended (paused or waiting for dependencies), Locked (currently executing), and Completed (either succeeded, failed, or canceled). A consistently high count of jobs in the Ready or Suspended state signals a bottleneck. It may indicate that the system is resource-constrained, or that a particular job type is failing and retrying repeatedly.

Practical Monitoring Approach

Build queries that segment jobs by type, state, and duration. This query identifies workflow jobs stuck in progress:

GET /api/data/v9.2/asyncoperations?$filter=(operationtype eq 10 and statecode eq 2)&$select=asyncoperationid,name,createdon,startedon,executiontimespan,message&$orderby=createdon desc

Run this daily. Jobs that have been in progress for more than an hour warrant investigation. Long execution times indicate either genuine long-running work (which may be acceptable) or hung jobs that need manual intervention.

Similarly, track failed jobs:

GET /api/data/v9.2/asyncoperations?$filter=(statuscode eq 31)&$select=asyncoperationid,name,createdon,errorcode,message,friendlymessage&$orderby=createdon desc&$top=50

Group failures by error code. A spike in a particular error code indicates a systemic problem. For example, a sudden spike in error code 0x80040213 (record not found) suggests an upstream process is deleting records that dependent async jobs expect to exist.

Error Handling and Retry Logic

Dataverse retries failed async jobs automatically based on the operation type and error. By default, most operations retry up to three times. However, this default is not always optimal. A job that fails due to a transient network timeout may succeed on retry. A job that fails because of invalid business logic will fail on every retry, wasting resources.

Custom plugins can handle this differently. Dataverse serializes the exception information into the AsyncOperation table. Your monitoring logic can examine the error and decide whether to manually trigger a retry or escalate to a support queue. Do not rely on automatic retry for all scenarios; be intentional about which operations should retry and under what conditions.

The FriendlyMessage column provides user-readable error text. Use this for alerting and dashboards. The Message column contains technical detail. Both are valuable in troubleshooting.

Maintenance and Cleanup

Successful async operations remain in the AsyncOperation table indefinitely unless explicitly deleted. High-volume environments can accumulate millions of completed records. This creates three problems: table growth (performance degrades as the table scales), storage consumption, and noise in monitoring queries (finding actual failures becomes harder).

Implement scheduled bulk deletion jobs targeting successful operations older than a retention period. A typical retention policy keeps the last 30 days of successful jobs and deletes older records. Failed jobs are retained longer (90 days is common) so that patterns can be analyzed and root causes understood.

Register async plugins with automatic deletion enabled where the operation is fire-and-forget. This setting tells Dataverse to delete the AsyncOperation record as soon as the job completes successfully. This is safe when you do not need audit trails of the async work, but dangerous if you need to track whether the work occurred.

Conclusion

Long-running operations and high-volume data processing are not fringe use cases in enterprise Dynamics 365 environments; they are normal. Synchronous plugins work fine for most validation and update logic, but the moment you touch more than a few dozen records or engage in complex orchestration, the synchronous model breaks down.

Async operations move these workloads out of the user’s request path, allowing the application to remain responsive and scalable. But async brings complexity: you lose immediate feedback, you must monitor job states, and failures can be silent. The difference between systems that run reliably at scale and systems that collapse under load often comes down to whether developers understand async patterns and build proper monitoring from the start.

Start by identifying your long-running operations. Audit your plugin implementations for anything that touches more than a handful of records or makes multiple external calls. If you find them, plan to move that work async and set up monitoring before the load increases. Waiting until your system is slow is too late.

—

Handling high-volume Dataverse operations is a core competency for enterprise implementations. Routeget Technologies has guided developers and architects through async architecture decisions and implementation patterns on dozens of large-scale Dynamics 365 deployments. Understanding when to move to async, how to monitor effectively, and what patterns prevent cascading failures is what separates systems that scale cleanly from ones that collapse under load.

#DynamicsDataverse #AsyncPlugins #PluginDevelopment #DataverseArchitecture #D365DevOps #EnterpriseIntegration

Enterprise Power Automate Cloud Flow Architecture: Building Scalable, Fault-Tolerant Automation for Large Organizations

When your automation platform processes millions of records across hundreds of flows, architectural decisions that worked for single-tenant pilots stop scaling. A well-intentioned cloud flow that runs fine for 500 daily transactions suddenly times out when real-world volume hits 50,000. By that point, retrofitting the flow costs more in rework than planning it correctly from the start.

Enterprise-scale Power Automate success depends on how you architect cloud flows to handle the real constraints of production environments. This article walks through the technical patterns and architectural decisions that distinguish flows built for departments from flows built for organizations.

Understanding Power Automate Performance at Scale

Power Automate cloud flows run within Microsoft’s shared infrastructure, which means each flow competes for resources with thousands of others. Understanding these constraints is foundational to architecture decisions.

Cloud flows are subject to service limits: each request timeout is 120 seconds for timeout-based actions, and connector calls are rate-limited based on your tenant’s subscription level. In practice, this means a single action that fetches data from an external API might timeout if the API responds slowly or if your tenant is already near its daily API call quota. For flows running against large datasets, this isn’t a performance problem to ignore. It’s an architectural requirement to respect.

Parallel execution helps, but creates its own complexity. When a flow branches into multiple parallel paths (processing different records, querying different systems), all paths consume resources simultaneously. A flow that runs fine with five parallel branches might fail at scale when ten branches compete for connection pool capacity. Testing flows at the scale you’ll see in production isn’t optional. Testing at 10 percent of expected volume tells you almost nothing about what happens at full scale.

Designing for Throttling and Rate Limits

Every connector in Power Automate has throttling limits defined by the underlying service. Dynamics 365, SharePoint, SQL Server, and third-party APIs each have their own request rate limits. When a flow hits a rate limit, Power Automate queues requests, which introduces unpredictable latency. If your flow architecture assumes synchronous completion within 120 seconds, and the queue adds 30 seconds of waiting, you’ve just created a failure path in production.

Throttle-aware architecture separates flows that need tight timing from flows that can tolerate latency. A flow that needs to complete a transaction synchronously within a user-facing timeout should not depend on calling a heavily rate-limited external API. Instead, offload that call to an asynchronous flow that executes outside the user-facing window. Use variables to track state, store interim results in a database table, and let the user interface update asynchronously.

Connection throttling is often overlooked. If five flows all call the same Dynamics 365 instance simultaneously, they share a connection pool. Exhausting that pool makes subsequent calls queue. Flows that run on schedule should stagger their start times or use queuing patterns to avoid resource contention. Flows that respond to user actions should prioritize execution: a flow triggered by a user clicking a button deserves more resources than a background job that can run at 2 AM.

Error Handling and Graceful Degradation

The difference between a flow that fails silently and a flow that degrades gracefully is measurable in support tickets and customer escalations. Power Automate provides three essential error handling patterns that move flows from unreliable to production-ready.

The try-catch-finally pattern mirrors error handling in traditional programming. A “Try” scope contains actions that might fail. If any action fails, a “Catch” scope runs automatically via a run-after condition, logging the error, retrying if appropriate, or notifying an admin. A “Finally” scope runs regardless of success or failure, cleaning up resources or updating audit logs. This pattern ensures your flow has explicit paths for both success and failure, not just an unhandled exception that leaves flows stuck.

The terminate-with-status pattern goes further. Rather than letting flows end in an ambiguous state, use a boolean variable to track whether critical errors occurred. At the flow’s end, check this variable and call either “Terminate with Success” or “Terminate with Failure” to ensure the flow run reflects actual outcomes in Power Automate’s UI and accessible to downstream logic.

The flow-run-details-URL pattern addresses an operational reality: when flows fail at 2 AM, support teams need to diagnose quickly. Construct a clickable link to the flow run using the `workflow()` function, extracting the environment name, flow ID, and run ID. Include this link in failure notifications so troubleshooting starts with the actual error message, not a generic alert.

Beyond structured error handling, design for graceful degradation. Not every flow failure warrants stopping the entire process. If a flow is sending notifications to ten people and two notification endpoints are temporarily unavailable, the flow should succeed and log the partial failure, not terminate. Use apply-to-each with error handling per item, not all-or-nothing atomic operations.

Testing and Monitoring

Flows that go untested until production are flows that fail at scale. But testing Power Automate flows is different from testing traditional code.

Load testing matters. Run your flow against your target volume in a test environment and measure latency, resource consumption, and failure rates. A flow that completes in 30 seconds with 100 records might take three minutes with 10,000 records. Knowing this before production deployment prevents being surprised when performance degrades.

Timeout testing is often forgotten. Intentionally slow the connectors your flow calls (using test endpoints or delays) to confirm the flow handles the full 120-second timeout window gracefully. A flow that doesn’t handle timeout elegantly will fail without clear error messages.

Monitoring in production should track four dimensions: run count and duration (to spot performance regressions), failure rate and error reasons (to catch systematic issues before they cascade), connector throttling (to identify rate limit pressure), and flow run details (to enable rapid troubleshooting). Don’t wait for users to report that flows are broken. Monitor proactively and alert when metrics deviate from baseline.

Common Architectural Pitfalls

Over-parallelization creates resource contention when branches should run serially. Tight timeouts that don’t account for throttling guarantee failures at scale. Flows that suppress errors “for now” with conditional paths quickly become maintenance nightmares. Missing audit trails make post-mortem analysis impossible.

The most expensive architectural mistake is discovering at deployment time that a flow can’t handle the actual data volume or concurrency levels. This is solved not through clever coding, but through honest testing at scale before release.

Moving to Production

Production-ready Power Automate flows share common traits: explicit error handling with clear failure paths, timeout assumptions aligned with real throttling behavior, monitoring that exposes issues before they impact users, and testing that matches real volume. These aren’t optional refinements. They’re the difference between flows that work for pilots and flows that keep working when users depend on them.

Building at this level requires thinking beyond the flow canvas. It requires understanding the constraints of shared infrastructure, designing for failure, and respecting the difference between happy-path testing and production resilience. That’s how organizations scale from department-level automation to enterprise-grade solutions.


*Routeget Technologies helps enterprise organizations architect Power Automate solutions at scale, designing for the realities of production environments and building automation that survives the transition from pilot to platform.*


#PowerAutomateArchitecture #CloudFlows #EnterpriseAutomation #PowerPlatformDevelopment #FaultTolerance #PowerAutomatePerformance #MicrosoftAutomation

Tags: #PowerAutomateArchitecture #CloudFlows #EnterpriseAutomation #PowerPlatformDevelopment #FaultTolerance #PowerAutomatePerformance #MicrosoftAutomation

Building a Sustainable Power Automate Center of Excellence: Governance Without Gridlock

Most organizations that deploy Power Automate do so without any governance structure, then scramble to build one after their citizen developers have created hundreds of inconsistent, poorly monitored automations. The result is predictable: Shadow IT runs deeper, cloud costs spike unpredictably, and IT eventually responds with policies so rigid that the business stops creating new flows and the platform stalls. The tension between speed and control is real, but it does not require choosing one or the other.

A Center of Excellence for Power Automate is simply a structured approach to decision-making: who gets to build flows, what patterns we enforce, how we measure success, and where funding comes from. It is not bureaucracy. It is the difference between a platform that serves business strategy and one that devolves into a cost and compliance liability.

Why Power Automate Centers of Excellence Matter

Before the Cloud, automation meant capital expenditure on licensed tools, IT-owned build processes, and a multi-year return-on-investment narrative. Business units that needed a workflow change submitted requests and waited. Power Automate inverted this model. Individual contributors with no coding background can now build workflows that connect dozens of applications, move data, and execute business logic in minutes rather than months.

This democratization is valuable, but it creates an organizational problem. Without structure, a 500-person organization can quickly accumulate 2,000 flows built by people who do not know about each other’s work, who use different authentication patterns, who log into different cloud environments, and who have no shared understanding of which flows are business-critical versus experimental prototypes. When a flow breaks at 2 a.m. on a Saturday, no one knows why, because the person who built it is no longer with the company. When your automation bill spikes 40% month over month, you cannot explain why, because no one is tracking flow execution patterns.

A CoE provides visibility, standardization, and accountability without becoming an approval bottleneck. It articulates the expectations around flow design, security, data governance, and cost management so that developers can move quickly and IT can sleep at night.

Organizational Structure: Three Patterns That Work

The most effective CoE structures share a common shape: a small central team responsible for standards, enablement, and governance; a distributed network of power users embedded within business units; and clear escalation paths from edge to center.

The central team should be small, typically two to four people, depending on organization size. Its role is not to build flows for every department, but to establish patterns, mentor citizen developers, and make the hard calls when conflicts arise. The team member should come from IT but ideally have business acumen—someone who understands both technical architecture and why the business cares about a given workflow. This role often seats best as a product manager rather than a pure engineer, since the job is as much about communication and change management as it is about technical decisions.

Distributed power users are the actual force multiplier. These are individuals in Finance, Operations, Sales, or HR who have invested time learning Power Automate deeply and can build flows, mentor peers, and serve as the first line of triage when flows behave unexpectedly. Organizations often resist this approach because it seems to decentralize control, but experience shows the opposite. When power users exist within their own departments, flows get built faster, are maintained more reliably, and align better with business context because the builder is embedded in the problem domain. The CoE provides training, sets standards, and holds power users accountable to those standards, but does not make them beg for permission.

Escalation paths matter. If a power user wants to build a flow that touches sensitive financial data, or that orchestrates changes across multiple critical systems, the CoE should have a clear, lightweight process to evaluate the design and approve the build. This is not a veto gate; it is a collaborative design review. Most escalations resolve quickly because the CoE can flag real risks (poor error handling, missing audit trails, data loss exposure) and guide the builder toward a more robust solution. The business gets its flow, and IT maintains reasonable confidence in the architecture.

Governance Framework: Standards Without Bureaucracy

Power Automate governance typically fails in one of two directions: it is either too loose (anything goes, leading to chaos), or too tight (everything requires approval, leading to workarounds). A functional governance framework sits between these poles.

Start with flow taxonomy. Define three categories: production flows (business-critical, require naming conventions and documentation), standard flows (departmental automations that follow company patterns but do not require escalation), and experimental flows (one-off tests and prototypes, deleted after 90 days if not promoted to production). This simple taxonomy lets developers understand expectations immediately and lets IT focus oversight where it matters most.

Establish naming and documentation standards. This sounds bureaucratic but solves real problems. A flow named “P001” tells you nothing. A flow named “Sales-QuoteApproval-VP” immediately tells you the business domain, the function, and the approval level. When a developer checks the existing flows, they can find related work and avoid duplication. When you need to disable a set of flows for maintenance, you can identify all related ones quickly. Documentation templates (one sentence describing what the flow does, the owner contact, the systems it touches) take five minutes to complete and dramatically reduce the knowledge burden when the builder leaves the company.

Data governance rules must be specific to your risk profile. Most organizations should establish: flows that touch Dynamics 365 Finance or HR systems must use managed identities and log all operations to an audit table; flows that create, update, or delete records in any production environment must include error handling and notification to the flow owner on failure; flows that move data between systems must encrypt data in transit and log the data movement event; flows that exceed 50 executions per day should be reviewed quarterly to confirm they still provide business value. These rules are not arbitrary IT gatekeeping; they reflect the business’s real exposure to data loss, compliance violations, and cost overruns.

Funding and Stakeholder Alignment

A CoE that must justify its existence through a departmental budget burns out quickly. Instead, embed the cost in the automation project’s business case. When Finance proposes an automation that will save a manual process, the total cost of ownership includes the CoE’s contribution: the design review, the mentoring, the platform licensing, the monitoring and ongoing optimization. This aligns incentives. If the CoE is too restrictive or slow, the business unit pushes back and the executive sponsor hears about it. If the CoE is too permissive and allows bad automations to proliferate, the operations team sees costs rise and demands better governance.

Create a steering committee that meets quarterly, including representatives from major business units, IT leadership, finance, and compliance. This committee reviews CoE performance (how many flows, what categories, cost per automation), approves new platform features or tool purchases, and arbitrates any major policy changes. This keeps the CoE accountable and prevents it from becoming an insular IT function that loses touch with business needs.

Measuring Success

Set metrics that matter. Track the number of production flows, the average time to build a flow once it is approved, the ratio of successful executions to failures, and the cost per automation. More importantly, survey power users and business unit leaders annually on whether Power Automate is enabling them or creating friction.

A CoE that has reduced flow-creation cycle time from eight weeks (under an old IT process) to three days and has achieved 99.5% execution reliability is delivering value even if it has not eliminated every risk. The point is not perfection; it is enabled business agility coupled with acceptable risk.

Common Pitfalls

Organizations often stumble on a few predictable mistakes. The first is creating a CoE without giving it authority. If the central team cannot enforce naming standards or require design reviews, it becomes an advisory body that developers ignore, and you have gained nothing except an extra cost center. The second is over-investing in tooling before you have clarity on the actual problem. Buy governance software only after you understand what you are trying to govern; often a simple spreadsheet and a SharePoint site suffice. The third is confusing CoE with “IT approval committee.” Governance should be about patterns and risk management, not about gating every creative idea because IT wants to be in control. If a power user’s approach is sound but unconventional, approve it and monitor it; do not reject it because it does not match a template.

Finally, do not neglect the change management dimension. If your organization has relied on Shadow IT for years, a CoE that suddenly requires visibility into all flows will face resistance. Plan for a communication campaign, early wins that demonstrate the value of transparency, and meaningful involvement of power users in CoE decisions from the start.

Moving Forward

Building a Center of Excellence for Power Automate is not a one-time project; it is an organizational capability that evolves as the platform matures. Start by identifying your central team and your first set of power users. Define basic standards around flow naming, documentation, and data handling. Establish your escalation path for production flows. Monitor adoption, cost, and execution reliability. Adjust based on what you learn.

Organizations that take this approach typically report that Power Automate adoption accelerates within six months, not because governance is loose, but because developers know the expectations and can move with confidence. Costs become predictable because you understand what is running and why. And the platform becomes a genuine strategic asset rather than a shadow IT liability.

Routeget Technologies has implemented Power Automate Centers of Excellence for financial services, healthcare, and manufacturing clients, and the patterns that work remain consistent: clear governance that focuses on risk and enablement rather than control; distributed power users who are vested in the business outcome; and a small central team that removes obstacles and sets standards rather than approving every decision. The structure is less important than the commitment to treat Power Automate as a managed platform rather than a free-for-all tool.

#PowerAutomateCOE #FlowGovernance #LowCodeGovernance #ProcessAutomation #AutomationStrategy #EnterpriseAutomation

Power Apps Governance and Scaling: Building Enterprise Applications Without Creating Technical Debt

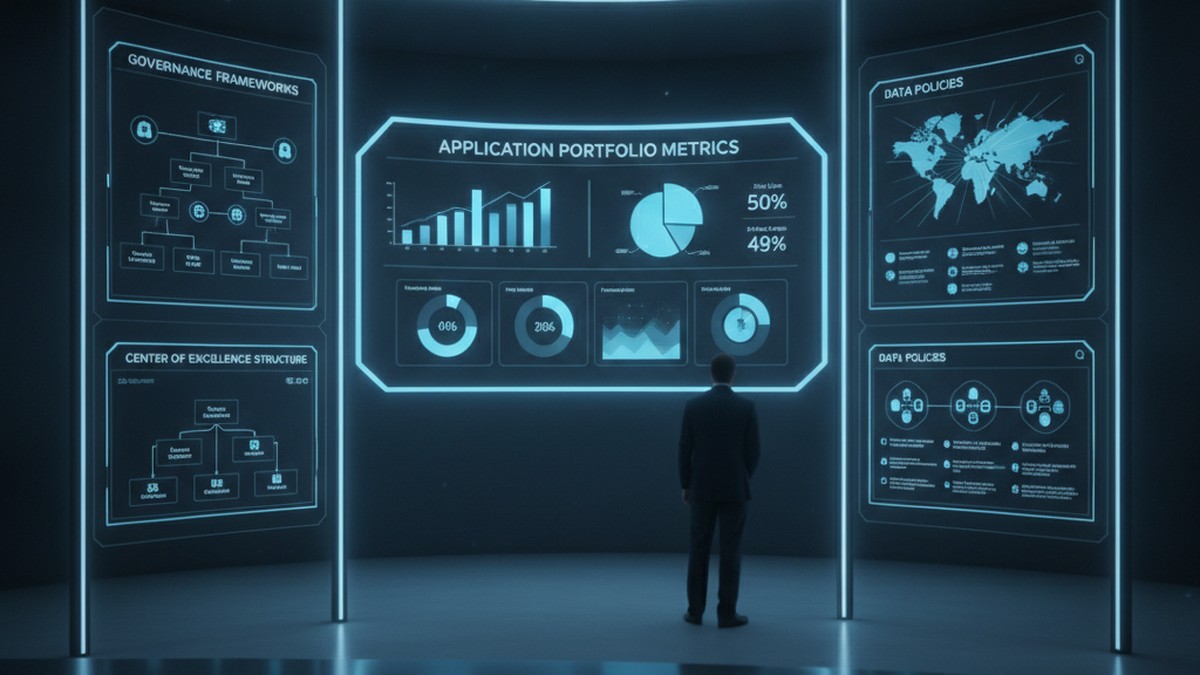
Enterprise Power Apps governance dashboard with application portfolio metrics and CoE framework

Problem Statement (Opening Hook)

Six months after launching your Power Apps initiative, you have 47 applications built across the organization. You’re congratulating yourself on driving digital velocity when IT discovers that 23 of those apps are querying the production Dataverse directly without connection audits, three apps are storing passwords in Power Automate flows, and nine apps were built with Dataverse tables that now conflict with the enterprise data model you’re implementing for Dynamics 365. You also cannot tell which apps are critical, which are experimental, and which are duplicates of work already done by other teams. This is not a Power Apps problem. This is a governance problem, and the cost of fixing it later vastly exceeds the cost of defining it now.

Why Power Apps Governance Matters at Scale

Power Apps succeeds because it is low-code. Business teams move faster. IT provisioning cycles shrink from months to days. Without governance, organizations end up managing application sprawl rather than portfolio. They face compliance risks when applications store regulated data without proper encryption. They accumulate technical debt through duplicate apps and integration spaghetti. Most critically, they lose the ability to retire old applications because no one remembers dependencies.

Governance does not mean blocking innovation. It means setting up boundaries so innovation happens inside a framework that scales. Done well, governance feels like enabling guardrails rather than restrictive rules.

The Three Pillars of Effective Power Apps Governance

Governance across Power Platform breaks into three interdependent areas: application lifecycle management (ALM), data governance, and access control. Each addresses a different aspect of operational risk, and each requires clarity before you have hundreds of applications in production.

ALM defines how applications move from development to test to production, who approves releases, and how rollback works. Without ALM discipline, applications get updated without testing and deployments happen without documentation. Microsoft Power Platform’s ALM tooling (solution containers, source control integration, deployment pipelines) is mature. Using it from the first application, rather than retrofitting later, saves significant effort.

Data governance specifies which Dataverse tables are available to which applications, which fields those applications can read and write, whether applications have direct table access or go through a custom API layer for auditing, and how data synchronization happens when multiple applications share tables. Organizations that skip data governance often discover halfway through Dynamics 365 F&O implementation that Power Apps developers were extending the General Ledger table directly, bypassing the compliance logic built into the F&O ledger posting engine. Starting with a canonical data model and enforcing read-write boundaries prevents those conflicts.

Access control governs who can create applications, what permissions they have, whether they can publish to production, and what user-level permissions applications inherit. Many organizations default to giving all users “create” permissions in Power Platform, then react with panic when app sprawl becomes visible. Instead, defining roles and mapping them to permission levels creates scalability. Skilled developers need broad creation rights. Business power users need constrained environments where they can build applications without affecting production infrastructure.

Enterprise Power Apps governance dashboard with application portfolio metrics and CoE framework

Common Governance Failures

Most organizations make one of three mistakes. The first is defining governance so rigorously it kills velocity. Requiring sign-off from multiple committees before publishing an app causes teams to work around the process in unsanctioned environments. The second mistake is defining no governance at all. Teams build freely until compliance audits arrive. Retrofitting governance then requires temporarily shutting down production applications to audit and repair them. The third mistake is defining governance on paper without technical enforcement. Policies exist but the actual permissions and Dataverse configurations never match. Effective enforcement requires embedding governance into administration, not just culture.

Effective governance finds the middle ground. It sets clear, enforceable boundaries while leaving room for teams to innovate within those boundaries. It is documented not in slides but in the actual configuration of your Dataverse, your solution containers, and your deployment pipelines.

Building a Practical Governance Framework

Start with application classification. Tier applications by criticality: mission-critical (runs the business and cannot fail), important (supports major business process and needs monitoring), and experimental (proof-of-concept or exploratory work). Mission-critical and important applications get the most scrutiny. Experimental applications get looser controls. This prevents governance overhead from killing innovation while ensuring critical work gets appropriate rigor.

Next, establish your Dataverse data architecture before widespread application development begins. Define which tables are canonical and which are read-only views or replicas. Specify who owns each table. Set up row-level security policies and field-level permissions. If applications bypass the model, audit logs show it. This enforces a single version of truth and prevents applications from accidentally conflicting.

Implement solution containers and source control integration. Every application goes into a solution container, not deployed loose to the environment. Solutions are version-controlled in Git. Deployments go through a clear pipeline: development environment, test environment, staging, production, with manual gates between stages. Automate testing at each stage where possible. This creates an audit trail of every change and makes rollback possible.

Enterprise development team collaborating with ALM workflows and CI/CD pipelines on display monitors

Set up a governance review board (often called a CoE governance committee) that meets monthly to review application portfolio health, approve new high-risk applications, and identify applications for retirement. The board includes IT architecture, security, compliance, and business process representatives. This is not a blocking committee. It is an enabling committee that helps teams navigate governance boundaries and flags risks early.

Finally, communicate governance as infrastructure, not as restriction. Frame governance conversations around what it enables: faster time to production for compliant applications, easier integration with enterprise systems, reduced security risk, and the ability to retire old applications without cascading failures. Teams that understand the rationale behind governance adopt it voluntarily.

Technical Debt and Long-Term Maintenance

Technical debt in Power Apps manifests quietly. An application built against a local Dataverse table works fine for six months until the enterprise decides to synchronize that table with Dynamics 365. The app breaks because its queries now hit a different data source. Another application stores customer IDs in a text field. When customer ID standards change, updating that field breaks any app that relied on the old format. A third application has hard-coded access credentials buried in flows. When those credentials rotate, the application goes dark.

These failures happen because applications were not architected for change. Avoiding technical debt requires discipline upfront: use API layers instead of direct table access, parameterize configuration values, separate data schemas from application logic, build retry logic into integrations, and document dependencies. It also requires governance processes that periodically review applications for architectural drift.

Balancing Speed and Control

The tension between moving fast and maintaining governance is real. The resolution is not to choose one or the other, but to acknowledge that different applications need different levels of control. A dashboard for business analytics needs different governance than an application that writes to the General Ledger. A proof-of-concept application needs different processes than a mission-critical customer portal. Tailoring governance to the application’s role allows you to move fast where speed matters and deliberate where risk is highest.

Organizations that execute this balance well report that governance, once established, does not slow velocity. If anything, it accelerates it. Teams know the boundaries. Deployments are predictable. Integration is straightforward. Failures do not cascade. Applications retire cleanly. The cost of operating the Power Platform ecosystem decreases even as the number of applications grows.

Building for Sustainable Scale

Power Apps’ promise is that business teams can build applications without IT intermediaries. Realizing that promise at scale requires intentional governance, not despite that governance, but because of it. The organizations building the most applications fastest are the ones with the clearest governance frameworks. They have defined what good looks like. They enforce it technically. They review it regularly. They adjust it based on what they learn.

If your organization is still in the early stages of Power Apps adoption, spending time now on governance infrastructure saves vastly more time later. If you are already in growth mode with sprawling applications, implementing governance means making deliberate choices about which applications to migrate to ALM pipelines first and which to retire. Either way, the question is not whether to govern Power Apps at scale. The question is how quickly you can build governance that enables scale rather than constrains it.

Routeget Technologies works with organizations across this journey, from establishing governance frameworks and Center of Excellence operations to implementing ALM pipelines and data architecture for large-scale Power Platform deployments. The difference between organizations that scale Power Apps sustainably and those that end up in technical debt rework usually comes down to governance discipline established early and reinforced consistently.

#PowerAppsGovernance #PowerPlatformCoE #ApplicationLifecycleManagement #LowCodeGovernance #EnterpriseArchitecture #DataverseGovernance #PowerAppsDevelopment #DigitalTransformation

Multi-Company Consolidation and Intercompany Eliminations in Business Central: Building Predictable Financial Reporting for Multi-Entity Organizations

Multi-company consolidation architecture in Business Central

Most finance leaders in multi-entity organizations face the same uncomfortable question every quarter: when you’ve pushed the consolidation close button, how confident are you that the consolidated revenue number sitting in front of the board actually represents what happened across all your companies? Not the individual piece that’s typically reliable, but the consolidated picture? That’s where consolidation becomes less about compliance and more about survival.

Business Central’s consolidation framework is deceptively straightforward on paper. Transfer general ledger entries from subsidiary companies into a consolidated company, eliminate intercompany transactions, and generate a trial balance. The reality of getting there, especially across multiple environments, different chart of accounts structures, and hundreds of intercompany transactions, is where most implementations hit friction.

The Two Paths to Multi-Entity Financial Reporting

Business Central offers two fundamentally different architectures for consolidation, and choosing between them shapes your entire finance operation.

Native Business Central Consolidation handles multiple subsidiary companies within the same environment. Each subsidiary is a separate legal entity (company), and the consolidated company pulls general ledger entries from all of them into a single trial balance. This works well for organizations with moderate complexity: two to six subsidiaries, similar chart of accounts structures, and predictable intercompany volumes. The native approach requires no additional licensing and runs against your existing Business Central instance.

Cross-Environment Consolidation pulls data across separate Business Central environments, typically when subsidiaries operate independently or have separate implementations. This approach demands Azure app registration and explicit API configuration beyond what most implementations document upfront. It gains you geographic flexibility and organizational autonomy at the cost of architectural complexity that surprises most finance leaders when they discover it.

The decision between these architectures should happen before implementation begins, not halfway through configuration. A CFO running five subsidiaries with different revenue streams should make that choice explicitly based on reporting requirements, not stumble into cross-environment consolidation because someone recommended “a separate environment for that subsidiary.”

Why Intercompany Eliminations Break Without Architecture

Intercompany eliminations are not an accounting problem. They are an architecture problem masquerading as accounting.

A subsidiary books a $500,000 sale to its sister company. The buying subsidiary records a $500,000 purchase from that same sister. The parent company sees $500,000 of revenue and $500,000 of expense moving through its chart of accounts. In a consolidated trial balance, these numbers double-count the same economic transaction, distorting both the consolidated revenue line and gross margin.

Eliminating this intercompany transaction seems straightforward: enter an adjusting entry in the consolidated company’s general journal, reverse out the duplicate revenue and expense, and your consolidated numbers reflect the economic reality of what actually happened outside the company. In practice, this process fails for three reasons that surface repeatedly in multi-entity implementations.

First: Account mapping complexity. When subsidiaries maintain different chart of accounts structures, you cannot simply reverse a $500,000 revenue entry in Subsidiary A against a matching $500,000 purchase entry in Subsidiary B. The account numbers don’t align. You must maintain a separate intercompany chart of accounts and map each subsidiary’s accounts to that shared chart, then map back to the consolidated company’s structure. This creates bidirectional mapping rules that are easy to misconfigure and difficult to audit later.

Second: Dimension fragmentation. Subsidiaries may use different dimensions to slice data. One subsidiary tracks revenue by sales region; another tracks revenue by customer segment. Consolidated reporting demands that these dimensions reconcile or remain separately reportable. Without deliberate dimension strategy upfront, finance teams end up manually reconciling consolidated totals back to subsidiary detail because the consolidated trial balance doesn’t break down by the dimensions that matter to the business.

Third: Timing and currency mismatch. Intercompany eliminations assume the subsidiary’s books match. If the subsidiary records a $500,000 sale in December and the parent records a $500,000 purchase in January, the consolidation period matters. Similarly, when subsidiaries operate in different currencies, the exchange rate used to record the transaction must align with the rate used to record the corresponding entry in the other company, or the elimination fails to net perfectly and leaves a mysterious gain or loss on currency conversion that nobody can explain.

These technical details are finance operations details. They cascade directly into close speed, error rates, and the executive team’s confidence in the numbers.

CFO reviewing consolidated financial statements in Business Central

Practical Path: Right-Sizing the Consolidation Approach

A common failure mode in consolidation implementations is overengineering for tomorrow’s complexity. Organizations build elaborate cross-environment consolidation architectures when today’s requirements could run entirely on native consolidation.

For two to six subsidiaries with predictable intercompany volumes: Start with native Business Central consolidation. It requires no licensing premium, minimizes Azure complexity, and works against your existing environment. The Business Units page becomes your consolidation control center. Test data before running consolidation (the “Test File” or “Test Database” action flags account number and dimension mismatches before they corrupt your close). Generate the Consolidated Trial Balance report (Report 17) and the G/L Consolidation Eliminations report (Report 16) to preview elimination impact before posting adjustments.

For cross-environment requirements or complex subsidiary structures: Allocate implementation time explicitly to Azure app registration, API endpoint configuration, and cross-environment testing. Document which company data moves which direction, which chart of accounts mapping applies at each step, and which dimensions matter to consolidated reporting. This is not something a finance team should discover mid-close.

For intercompany transaction volume above 200 per month: Evaluate ISV extensions like Binary Stream MEM (Multientity Management) or equivalent tools. Native Business Central consolidation handles centralized intercompany payables and receivables adequately, but it is not optimized for mass journal entry processing when intercompany volumes exceed what native functionality was designed for. ISV tools are cost-justified if they reduce manual reconciliation by five to ten hours per close cycle.

Building Eliminations into Your Close Process

Intercompany eliminations work best when they become a defined step in your close calendar, not an afterthought when the numbers don’t match.

Pre-close phase: Publish a “no intercompany transactions after X date” deadline to all subsidiary controllers. Require them to settle open intercompany payables and receivables (the native Business Central Intercompany Transactions module makes this transparent). Running consolidation after that deadline eliminates the problem of transactions in flight.

Consolidation phase: Run the Consolidated Trial Balance report. Compare this to the prior quarter. Material variances should be investigated before finalization. Use the G/L Consolidation Eliminations report to preview the impact of pending adjustments. Only post elimination entries if the consolidated numbers reflect the economic reality the business expects.

Post-close phase: Publish the consolidated trial balance to Finance stakeholders (CFO, Board reporting team, external auditors). Confidence in this number determines trust in all downstream financial statements.

The Bottom Line

Business Central’s consolidation engine solves a real problem: bringing multiple legal entities’ financial data into a single, trusted view. But consolidation success depends entirely on architecture decisions made before implementation starts. Choose between native and cross-environment consolidation explicitly. Map your chart of accounts and dimensions upfront. Define your intercompany elimination rules in writing before you book a single subsidiary transaction.

When you do this work, consolidation becomes predictable. The numbers reconcile. Your close accelerates. The board sees financial statements that actually represent what happened across the organization.

When you don’t, you spend the last three days of every close cycle chasing mysterious variances and rebuilding eliminations by hand.

The difference between those two outcomes isn’t luck. It’s architecture.


About Routeget Technologies: Routeget specializes in Business Central implementations for mid-market organizations with complex multi-entity structures. Our approach begins with consolidation architecture design before any configuration touches the system, ensuring your finance team closes faster with higher accuracy.

#MultiEntityConsolidation #BusinessCentralFinance #ConsolidationAccounting #IntercompanyEliminations #FinanceOperations #CFOStrategy #BusinessCentralCFO

Dataverse Environment Strategy: Consolidation Versus Segregation

Dataverse consolidation vs segregation architecture comparison

When you first deploy Dataverse, the storage bill arrives as a small surprise. When you deploy your tenth instance, it arrives as a budget problem. This escalation is not accidental. It reflects a choice you likely did not consciously make: the decision to separate Dataverse environments.

Most organizations start with a single development environment, then add a staging environment for UAT, then a production environment for the main line of business. Six months later, there’s a second production environment for a parallel business unit. A year in, IT has provisioned separate Dataverse instances for finance, operations, customer service, and a pilot project that “just needed a sandbox space.” Each instance accrues storage costs, backup overhead, governance complexity, and security review burden. The organization paid for all of it. Few asked whether they needed to.

The question “Should we consolidate or segregate?” never came up because it felt obvious: production should be separate from development. But that clarity evaporates once you have multiple business units, overlapping data needs, and genuine compliance constraints. Consolidation looks cost-efficient until you calculate the management burden. Segregation looks secure until you realize your core customer data lives in four places and nobody knows which is authoritative.

The answer is neither pure consolidation nor pure segregation. It is strategy.

Understanding the Cost and Governance Tensions

Dataverse pricing ties directly to storage consumption and the number of instances you maintain. A 10 GB storage license costs roughly 100 USD per year. An organization with ten segregated Dataverse environments, even with light usage, pays backup, redundancy, and management overhead across each one. The cloud infrastructure beneath Dataverse (Azure) charges for compute, storage durability, and replication regardless of how full your instance is. A mostly empty Dataverse environment costs nearly as much as a full one.

Segregation creates what appears to be security clarity: production data stays in production, development in development, finance data in finance. This isolation has genuine value. A misconfigured Power Automate flow in a development sandbox cannot accidentally update live customer records. A security breach affecting one environment need not compromise all of them. But segregation imposes a hidden cost: data synchronization, duplicate records, inconsistent customer views, and reconciliation overhead. If customer records live in both a finance Dataverse and an operations Dataverse, which is the source of truth when they conflict? Who owns the resolution process?

Consolidation eliminates that duplication. A single Dataverse instance holding all enterprise data means one source of truth for customer records, one master file for products, one system of record for financial transactions. You skip the synchronization overhead, the reconciliation disputes, and the headache of knowing which Dataverse has the current information. The cost per record drops. But the security model becomes more complex. Consolidation means granting broader data access to more users and applications, requiring tighter role-based access control, field-level security rules, and auditing to prevent accidental or malicious data leakage. A single misconfigured permission model puts more data at risk than a segregated approach would.

Business team reviewing Dataverse environment strategy and cost metrics

When Segregation Makes Economic Sense

Segregation is the right strategy when regulatory compliance or data residency mandates isolation. A healthcare organization subject to HIPAA cannot store patient records alongside non-protected business data in the same system without additional access controls that approach the complexity of separate systems anyway. A financial services firm with customer data subject to SOX or PCI compliance, or an organization operating in multiple countries with GDPR or localization requirements, often finds segregation is mandated by policy rather than chosen for efficiency.

Segregation also makes sense when a subsidiary or business unit operates as a distinct legal entity with its own data ownership and governance. If your organization acquired a company and that company operates with its own finance department, separate Dataverse instances may be required during the integration phase and might remain appropriate long term to respect the subsidiary’s operational autonomy, even if they cost more.

Segregation further proves necessary when the organization lacks the governance maturity to enforce consistent security policies across shared data. If your Power Platform practice is young, permissioning discipline is inconsistent, and no one has ownership over a unified data governance framework, adding data to a consolidated Dataverse risks creating visibility into sensitive information that should remain restricted. In that case, segregation by business unit or application buys time for your governance practice to mature.

When Consolidation Reduces Total Cost of Ownership

Consolidation is strategically sound when you have multiple business units sharing core data, such as customers, products, and suppliers. The finance department’s customer master should be the same record your sales team references. The supply chain’s product master should be the source of truth for the pricing your finance team uses in invoicing. Consolidation eliminates the cost and risk of maintaining parallel records and reconciling discrepancies when they diverge.

Consolidation also makes sense when your organization has established governance discipline and a clear data stewardship model. If you have defined data ownership (finance owns the general ledger, supply chain owns inventory, sales owns opportunities), have role-based security groups mapped to those functional areas, and have audit mechanisms in place to catch permission violations, a consolidated Dataverse becomes a platform strength rather than a security risk. Your cost per record drops, your data consistency improves, and you simplify the user experience by giving people access to the unified information they need rather than requiring them to navigate to separate systems.

Consolidation further makes sense for organizations with mature ALM (application lifecycle management) practices. Consolidated Dataverse allows you to deploy solutions and flows to shared data layers without the release complexity of managing separate instances. Your development, staging, and production environments can all point to logically separated Dataverse spaces within a single instance, reducing provisioning overhead and backup complexity.

Hybrid Models and Environmental Separation Within a Single Instance

Many organizations land on a hybrid approach: one or two consolidated production Dataverse instances for the main business, with a separate development/test environment reserved for experimental solutions and non-production use.

This model recognizes that some segregation is necessary (development must be isolated from production), while consolidation of core business logic and shared data eliminates duplication and cost. Within a single Dataverse production instance, you use solution layers and environment variables to manage configuration differences for different business units or applications, avoiding the need for separate instances.

The Operational Complexity Multiplier

Many organizations underestimate the operational cost of managing multiple Dataverse instances. Each instance requires backup policies, disaster recovery testing, access control reviews, security patching coordination, and licensing reconciliation. Each instance needs monitoring for performance issues. Each introduces a potential point of data quality failure. If you have ten Dataverse environments with inconsistent master data definitions, ten different backup schedules, and ten separate access reviews, you have essentially maintained ten times the governance surface area compared to one consolidated instance.

Recommendations for Decision-Makers

Before you provision another Dataverse instance, ask whether the request stems from genuine compliance isolation or from organizational convenience. If it is convenience, consider whether investing in your governance model (clearer role definitions, field-level security policies, auditing) would be more cost-effective than the ongoing operational overhead of maintaining a separate instance.

If you already have multiple instances, analyze the actual data sharing patterns. Do core business entities (customers, products, suppliers) need to be synchronized across instances? If so, you are paying the cost of segregation while accepting the complexity of consolidation. A strategic consolidation project to merge those shared entities might cost less over three years than the recurring duplication and reconciliation overhead.

Document your environment strategy explicitly. Do not let instances accumulate by default. Routeget Technologies works with organizations to audit their existing Dataverse footprint, quantify the cost-benefit of consolidation versus continued segregation, and design transition plans that respect compliance constraints while reducing total cost of ownership. The difference between a well-planned environment architecture and an ad-hoc collection of instances often runs to hundreds of thousands of dollars annually for larger deployments.

Hashtags: #DataverseArchitecture #EnvironmentStrategy #PowerPlatformGovernance #EnterpriseDataManagement #DataverseCostOptimization #CloudGovernance #MicrosoftDataverse

Cash Flow Forecasting in Dynamics 365 Finance: Why AI Predictions Still Miss Working Capital Reality

Cash flow forecasting dashboard showing projected vs actual data with KPI metrics

Most finance teams have spent years building cash flow forecasts in Excel, stitching together data from bank statements, accounts payable systems, and revenue pipelines into spreadsheets that someone updates manually every month. The work is repetitive, the data silos make it unreliable, and by the time the forecast is finished, half of it is already stale. Dynamics 365 Finance Insights offers an escape from that trap through AI-driven cash flow forecasting that learns from historical cash patterns and generates long-term projections automatically. The pitch is compelling: machines eliminate the tedium, surface patterns humans miss, and free finance teams to focus on strategy instead of spreadsheet mechanics.

But there is a critical gap between what the AI model can do and what finance teams actually need it to do. AI-driven cash flow forecasts excel at identifying mathematical patterns in historical data, yet they struggle with the qualitative, forward-looking factors that actually drive cash flow reality: planned capital investments that haven’t yet hit the books, seasonal customer payment behavior changes, supply chain disruptions that will compress inventory holding periods, or a merger that restructures the entire customer base. A finance controller or CFO who relies solely on the AI forecast without layering in business judgment will often walk into a liquidity surprise.

The real value of Dynamics 365 Finance Insights cash flow forecasting is not replacing human judgment but augmenting it. When finance teams use the AI forecast as a starting point and then overlay business context, decision-making velocity accelerates and accuracy improves dramatically. Getting this right requires understanding what the model can and cannot see, knowing when to trust the forecast and when to override it, and building the right governance layer to validate forecasts before they drive working capital decisions.

The Limits of Pattern Recognition in a Complex Cash Cycle

AI models underlying cash flow forecasting in Dynamics 365 Finance are fundamentally pattern-recognition engines. They ingest historical cash inflows and outflows from your bank accounts, accounts receivable aging, accounts payable schedules, and payroll cycles, then use time-series forecasting to extrapolate what comes next. If your company has ten years of data showing that December customer collections spike by 35 percent and February payment to suppliers compresses payables by 20 days, the model will capture those patterns and encode them into future projections. This works well for recurring, predictable dynamics.

What the model cannot see is anything outside its training window that will reshape cash behavior going forward. If your company just signed a contract to pay a major vendor upfront instead of on net-60 terms, the model knows nothing about it until that transaction flows through the bank. If you are planning to divest a business unit, the cash flow impact of losing that customer’s collections will not appear in the forecast until after the divestment occurs. If a customer base mix shift is underway (moving from long-tail small customers to a few large enterprise accounts), payment velocity and working capital requirements will change, but the model is still extrapolating patterns from a customer composition that no longer matches reality.

These are not failures of the AI model. They are inherent constraints on what backward-looking pattern recognition can accomplish in a forward-looking world. A CFO charting course for a 24-month cash position that blindly follows the AI forecast without accounting for known strategic changes is making a decision on stale information, regardless of how sophisticated the underlying algorithm is.

Cash flow forecasting dashboard showing projected vs actual data with KPI metrics

Where AI Forecasts Add Immediate Value

The practical value of Dynamics 365 Finance Insights cash flow forecasting becomes clear when you deploy it specifically for what it does well: automating the baseline forecast that captures recurring cash patterns. Instead of a finance controller manually updating a spreadsheet with assumptions about seasonal collections patterns, payroll cycles, and vendor payment terms, the AI model learns these patterns and generates updated projections whenever new transactional data arrives. The baseline becomes self-updating, and the finance team shifts focus from mechanical forecasting to exception-based analysis.

Dynamics 365 Finance Insights also surfaces forecast accuracy metrics, showing finance teams how well the model predicted actual cash outcomes over trailing periods. This feedback loop is valuable, because it reveals whether patterns the model identified have remained stable or have shifted. If the model historically predicted collections within plus-or-minus 3 percent but suddenly starts missing by 8 percent, that is a signal that underlying customer payment behavior has changed and warrants investigation.

What-if scenario analysis is another capability that multiplies the value of AI-driven forecasting. Once the baseline forecast is in place, finance teams can create alternate scenarios representing different business conditions (optimistic growth, pessimistic demand, recession response) and overlay them on top of the baseline. This capability let you rapidly explore how cash positions respond to different strategic choices without rebuilding the entire forecast from scratch.

The Three Scenarios Where AI Forecasts Lead Finance Teams Astray

Reliance on AI-only cash forecasting becomes problematic in specific, predictable scenarios that every finance team encounters:

Structural changes to cash flow drivers. When your business model shifts, historical patterns become unreliable. If you transition from on-premises software licensing (lump-sum collections upfront) to a subscription SaaS model (monthly recurring revenue spread over years), the AI model trained on your old licensing pattern will dramatically overforecast near-term collections. The model needs retraining on new data, but that can take months. In the interim, finance teams need human judgment to reframe the forecast against the new revenue model, or they will drastically overestimate liquidity.

One-time events with material cash impact. A large customer prepayment, a debt refinancing, an asset sale, a business combination, or an unexpected insurance recovery all create cash movements the model has no historical precedent for. These events typically require advance knowledge and business context to forecast. If a CFO knows a customer prepayment of $20 million is coming in Q2 but the AI model knows nothing about it, the combined view (baseline forecast plus known one-timers) is far more useful than either alone.

Seasonal and cyclical patterns that have shifted over time. AI models can capture long-term seasonal patterns, but if the magnitude or timing of seasonality has changed, the model can lag in detecting and adapting to that shift. A company that has historically seen strong Q4 collections might have shifted to a more consistent quarterly pattern due to customer base changes. The model will still expect a Q4 spike based on historical data, whereas a finance controller watching year-over-year trends will notice the pattern has evolved and adjust accordingly.

In all three scenarios, the disconnect is the same: the AI model is solving for accuracy on historical patterns, while finance teams are solving for visibility into forward cash positions shaped by strategy, one-off events, and changing market conditions. Neither is wrong. They are just operating on different time horizons and information sets.

Finance team reviewing cash flow forecasts and working capital data on dashboard systems

Building Governance Around AI Forecasts

The path to effective AI-driven cash flow forecasting in Dynamics 365 Finance is not to replace human judgment but to institutionalize how the two interact. This requires a lightweight governance framework that clarifies when the AI forecast is trusted as-is, when it needs overlay, and who is responsible for validating the forecast before it drives working capital decisions.

Start by establishing a forecast validation workflow that requires the finance controller or working capital manager to review and sign off on cash forecasts before they are used for liquidity planning or short-term borrowing decisions. This review should be structured and quick, not bureaucratic. The reviewer should check three things: Does the forecast direction match current business trends? Are known one-time cash events accounted for? Are there any recent structural changes to the business (pricing model shift, customer mix evolution, payment term changes) that the AI model would not yet have learned?

If the answers are yes, the AI forecast can proceed unchanged. If the answers are no, the review process should support rapid overlay of business context. Dynamics 365 Finance Insights allows finance teams to create scenario variants and what-if analyses that can quickly model known events or strategic changes on top of the baseline forecast. This is not rebuilding a forecast in Excel; it is using the system to layer business judgment on top of the AI baseline.

Over time, as the AI model learns from corrected forecasts and forecast validation patterns, the lag between model behavior and business reality should narrow. A finance team might discover that 80 percent of forecasts pass validation without change, while 20 percent require overlay of known one-timers or cyclical pattern adjustments. Documenting those patterns helps you identify where the model needs retraining or where business context should be automatically fed back into the forecasting process.

The Compound Effect of Forecast Discipline

Finance leaders often underestimate the leverage of accurate cash flow forecasting on decision-making velocity. If a CFO has high-confidence visibility into 24-month cash position, working capital decisions that would otherwise require contingency buffers can be optimized. Seasonal borrowing decisions become more predictable. Investment in accounts receivable improvement initiatives can be prioritized based on forecast impact. Strategic decisions about capital allocation, debt paydown, and dividend policies can be made with clearer information about future liquidity.

Conversely, a forecast that the CFO does not trust becomes either a shelf-ware artifact that no one uses, or worse, a forecast that is blindly followed and leads to strategic surprises. Many companies keep a spreadsheet forecast alongside their ERP forecast precisely because they do not trust the system forecast.

The investment in building governance discipline around AI-driven forecasting is usually small relative to its impact. A monthly 30-minute forecast review and validation workflow, combined with clear ownership for feeding business context back into the system, is enough to shift AI forecasts from mathematical curiosities to operational planning tools.

Making the Shift from Manual to Augmented Forecasting

The transition from Excel-based forecasting to AI-driven forecasting in Dynamics 365 Finance requires more than just enabling the feature. It requires reframing how finance teams think about forecasting: not as a document to be produced, but as an ongoing process that blends machine intelligence with human business judgment. The AI model generates the baseline, eliminating the mechanical work. Finance controllers validate and contextualize it, adding business judgment. Together, the two create a forecast that is both statistically grounded and strategically sound.

Organizations that make this transition successfully are usually those that treat the AI forecast as the starting point for a conversation, not the destination. They ask: Where does the forecast seem right, and where does business knowledge suggest it should be adjusted? What events on the horizon will reshape cash patterns that the model does not yet know about? How can we feed that business context back into the system to continuously improve forecast quality?

These questions shift forecasting from a cost center (people spending time in spreadsheets) to a strategic process (finance contributing to working capital optimization and capital allocation decisions). The shift is not automatic. It requires discipline, clear ownership, and a commitment to treating forecasts as living documents that evolve as business conditions change. But the payoff for finance organizations disciplined enough to make the shift is significant: better visibility, faster decision-making, and working capital strategies grounded in both mathematical rigor and business reality.

At Routeget Technologies, we help organizations build governance discipline around financial analytics and forecasting, ensuring that AI-driven insights inform rather than replace strategic decision-making. If you are implementing cash flow forecasting in Dynamics 365 Finance and want to ensure adoption and accuracy, our consulting team can help design the validation workflows and governance structure that turn machine forecasts into actionable business intelligence.

#DynamicsFinance #CashFlowForecasting #FinanceInsights #WorkingCapitalOptimization #CFOStrategy #FinancialPlanning #DynamicsF&O

Demand Forecasting in Dynamics 365 Supply Chain: Why AI Predictions Still Need a Finance Controller

Supply chain analytics dashboard showing demand forecasting data

Your supply chain forecasting process relies on a spreadsheet, email chains, and quarterly consensus meetings where people argue about whether next quarter looks “up” or “down.” By the time everyone agrees, demand has already shifted. Dynamics 365 Supply Chain includes native demand forecasting powered by machine learning, and it looks compelling: automatic pattern detection, seasonal adjustment, and predictions backed by months of transaction history. The promise is clear: let the algorithm handle it, and inventory optimizes itself.

But here’s what most supply chain leaders discover after three months of production use: the algorithm is confident and occasionally wrong in expensive ways. A Dynamics 365 demand forecast can show 10% growth next quarter because of a single promotion cycle two years ago that now looks like a trend. Or it can predict stable demand when a major customer just went silent. The numbers are rigorous; the business context is not.

This is not a Dynamics 365 limitation, but a forecasting reality that CFOs and supply chain directors need to understand before they flip the switch on full automation. The technology works. The question is how to use it without letting the model’s confidence substitute for financial discipline.

Supply chain planning dashboard with demand forecasting metrics

What Dynamics 365 Demand Forecasting Actually Predicts

Dynamics 365 Supply Chain uses machine learning to analyze historical demand patterns and generate point forecasts for future periods, typically one to twelve months out. The system takes transaction history (sales orders, purchase orders, inventory movements), identifies seasonality, trend, and cyclical patterns, and applies time-series decomposition to produce a predicted demand volume for each item in each period.

The key phrase is “point forecast”: a single number per period per item, not a range. It’s precise, quantifiable, and immediately actionable as a target for production planning, procurement, and inventory targets. The model uses techniques like exponential smoothing and ARIMA (AutoRegressive Integrated Moving Average) to weight recent history more heavily and adjust for seasonal swings observed over multiple years.

For many product categories, this works well. If you sell a consistent product with stable customer base and predictable seasonality, a machine learning forecast often beats manual judgment. The algorithm isn’t emotional, doesn’t anchor to last year’s number, and picks up subtle patterns that a spreadsheet jockey might miss. This is not theoretical; it’s production reality across hundreds of implementations.

The Finance Controller’s Problem with Pure Automation

The trouble arrives when the model’s assumptions break down. Here are three scenarios that appear in almost every supply chain forecasting implementation:

Scenario 1: A Large Customer Goes Quiet or Leaves. Your top customer, representing 22% of annual demand for a product family, doesn’t place an order for two periods. The demand forecast model has five years of history showing this customer as rock-solid steady, so the algorithm predicts normal consumption in period three, waiting for the order that never comes. A human supply chain planner would escalate the issue to sales or customer success immediately. A finance controller would note the drop in the forecast, not wait for the model to recalibrate across six more months of zero orders.

Scenario 2: One-Time Promotions Create False Trends. Last summer, you ran a promotional campaign that drove a 40% spike in demand for a specific product. The machine learning model, looking at the last 24 months of history, detects this spike and attributes a portion of it to an underlying trend shift rather than recognizing it as a one-time event. The forecast for next summer incorporates this “trend,” predicting sustained 20% elevation even though you have no plans to run the promotion again. A finance controller reviewing the forecast would flag this immediately (“Did we plan a promotion? No.”). The algorithm does not ask strategic questions.

Scenario 3: Timing Mismatch Between Demand Signal and Forecast Recalculation. You learn on Tuesday that a major product line is being discontinued. The demand forecast in Dynamics 365, calculated on last Friday, still predicts normal consumption through quarter-end. The model will not be recalculated until next Friday’s batch run. By the time the new forecast is available, you’ve already committed to purchase commitments and production schedules based on outdated data. A finance controller who is manually involved in forecast validation can adjust the prediction immediately.

In each of these scenarios, the machine learning model is not “wrong” in statistical terms. It’s following its design: predict based on historical patterns. The business context (personnel changes, campaign decisions, strategic shifts) happens faster than the model’s training cycle can absorb. Finance leaders know this. Supply chain leaders know this. But when the system is fully automated, nobody is asking the question.

The Dynamics 365 Approach: Automation With Financial Governance

Dynamics 365 Supply Chain’s forecasting engine does include governance features, but they work best when treated as mandatory checkpoints, not optional. The system allows you to:

Set override rules at the item or item-family level, specifying factors by which the model’s predictions should be adjusted (for example, “multiply this item’s forecast by 1.15 for next quarter because we’re running a promotion”). You can also set absolute override values, replacing the model’s prediction entirely for specific items in specific periods.

Use Demand Forecast Accuracy KPIs to measure how well the model’s past predictions match actual demand, broken down by item family and customer segment. If a forecast consistently misses by 15% for a certain category, that’s a signal to investigate whether the model’s assumptions are still valid or whether market conditions have shifted in ways the historical data doesn’t capture.

Manually adjust forecasts before they feed into production planning by creating a Demand Forecast Adjustments form, where supply chain planners and finance controllers can document specific business reasons for adjusting (or accepting) each model-generated prediction. This creates an audit trail: months later, you can see that Q2 forecasts were intentionally lifted 8% because of an announced customer expansion, distinguishing intentional adjustments from modeling error.

Integrate the demand forecast into a Dynamics 365 Planning Optimization run, which also accounts for supply constraints, lead times, and safety stock levels. The forecast is just one input; planning optimization adjusts based on the full supply picture.

None of these features bypass the algorithm. They layer financial and business governance on top of the automation, recognizing that pure model-driven forecasting works until it doesn’t, and having a second set of eyes looking at the numbers before they lock in procurement and production schedules saves more money than pure automation typically gains.

The Finance-Supply Chain Handoff: How the Best Teams Use Forecasting

Organizations that get strong results from Dynamics 365 demand forecasting typically follow a pattern:

Supply chain operations generates the base forecast using the machine learning model and treats it as a starting point, not a decision. They run the model on a fixed schedule (for example, every Friday afternoon) and document any configuration changes (for example, a customer’s demand type changes from baseline to promotional).

Demand planning, working with sales and marketing, reviews the forecast against known business events: major customer wins or losses, planned promotions, supply disruptions, or strategic inventory adjustments. They create documented adjustments in the system, so the model is informed of one-time events versus trends.

Finance and the controller function reviews the resulting forecast for cash flow, working capital, and procurement commitment implications before it locks in. A 30% demand lift for a product with a 90-day supply lead time means purchasing commitments, warehouse space, and cash flow assumptions need to shift accordingly. The finance controller’s approval step is the gate between “the model predicts” and “we’re committed to this plan.”

Production planning and procurement teams execute on the approved forecast, knowing it has been vetted by both demand planning and finance.

The entire cycle takes three to five days, depending on forecast complexity and business complexity. It’s not fully automated, but it’s not a spreadsheet-and-email process either. The machine learning model handles the analytical heavy lifting; human judgment handles the business context.

Getting Started Without Overhauling Your Current Process

If your organization currently uses manual forecasting or legacy forecasting tools, migrating to Dynamics 365 demand forecasting does not require overhaul on day one.

Start by running the Dynamics 365 forecast in parallel with your current process for one full planning cycle. Load several months of historical demand data into Dynamics 365 Supply Chain, configure the forecasting parameters (for example, seasonality windows, forecast time horizon), and let the model generate predictions. Compare the Dynamics 365 forecast to the forecast you would have created manually. Where do they agree? Where do they diverge, and why?

This parallel run gives you three things: validation that the model is picking up your business’s actual patterns, a baseline for measuring the model’s accuracy going forward, and team confidence that the system understands your supply picture before you make it a dependency.

Once you’re confident in the model’s direction, layer in governance. Designate a demand planning role in Dynamics 365 and grant that person permission to create forecast adjustments. Set up a simple adjustment log: which items are adjusted, by how much, and the business reason. Don’t try to perfect the process; just capture the decision.

Then pilot the forecast-to-planning integration with a subset of your highest-value items or customer segments. Run planning optimization using the Dynamics 365 forecast and compare the resulting purchase orders and production schedules to what you’re currently doing. If the plan improves (lower safety stock, fewer expedited orders, better cash flow alignment), expand the scope. If it diverges significantly from reality, investigate whether the forecast or the planning parameters need adjustment.

This three-step approach keeps risk contained while building organizational confidence that demand forecasting automation is working for you, not against you.

Conclusion

Demand forecasting in Dynamics 365 Supply Chain is a powerful tool for reducing guesswork and improving inventory efficiency. But “powerful” is not the same as “fully autonomous.” The best implementations treat the machine learning model as a rigorous analyst that handles pattern recognition at scale, paired with finance and supply chain leadership who understand the business context that no model can capture.

If your organization is evaluating demand forecasting or has already deployed it, the question is not whether to use the algorithm. It’s how to build a governance process that keeps human judgment and financial discipline in the loop without slowing your planning cycle to a crawl. Dynamics 365 makes that possible, as long as finance leaders and supply chain teams treat the forecast as input to a decision, not a decision itself.


Routeget Technologies brings enterprise Dynamics 365 implementation and optimization expertise to organizations across finance, supply chain, and customer engagement. Our consultants work with supply chain teams and finance leaders to design forecasting governance that balances automation with financial control, reducing inventory costs while improving forecast accuracy and auditability.

#DemandForecasting #DynamicsSupplyChain #InventoryOptimization #SupplyChainPlanning #FinanceAutomation #DynamicsERP #SCMStrategy