Dataverse Data Residency and Compliance: The Multi-Region Strategy Most CIOs Miss

Enterprise multi-region Dataverse architecture across geographic zones

Your organization operates in three countries. Your finance team demands European data stays in Europe. Your CFO asks how much you’re paying for redundancy across regions. Your compliance officer flags that your current architecture doesn’t align with the new data sovereignty requirements coming in Q4. And meanwhile, everyone assumes Dataverse handles this automatically because it’s Microsoft cloud.

It doesn’t. And most CIOs don’t realize the gap until they’re months into a Power Platform rollout.

Microsoft Dataverse pricing, architecture, and residency behavior are frequently misunderstood, partly because the documentation focuses on technical capacity and partly because the commercial implications only become visible at scale. Understanding Dataverse data residency is not a technical detail for your architects to worry about. It’s a strategic decision that affects compliance posture, operational cost, licensing efficiency, and your ability to support global operations within existing governance frameworks. Getting it wrong creates cascading problems: expensive data migration projects, compliance violations, or multi-region deployment architectures that cost far more than a thoughtful early strategy would have.

Enterprise multi-region Dataverse architecture across geographic zones

What Dataverse Data Residency Actually Means

Dataverse databases reside in a specific geographic region determined at provisioning time. This region assignment is permanent and cannot be changed after a database is created. Once you provision a Dataverse environment in West Europe, your customer records, inventory ledgers, and sales transactions remain in that region’s data centers indefinitely. Moving data between regions requires export-and-reimport workflows, which means downtime, validation effort, and business disruption.

The region you select during environment provisioning is not the same as the region where your application servers run or where your users are located. A Power App built on a West Europe Dataverse instance can be accessed and used from any geography, and the performance impact of geographic distance is usually negligible for most business applications. But the data itself stays where you provisioned it.

This distinction matters because many organizations assume they can simply create a Dataverse environment and let Microsoft handle residency automatically. They cannot. Residency is a conscious architectural choice made at provisioning time. If you have subsidiary operations in Canada, Australia, and Japan, you need separate Dataverse environments for each, each provisioned in its corresponding region, unless you have an explicit business case for centralizing data in a single region and accepting the compliance and latency trade-offs.

The Multi-Region Strategy: Options and Trade-Offs

Most enterprises adopt one of three approaches to Dataverse deployments across multiple geographies.

Centralized Single-Region Strategy means all subsidiaries and operations worldwide connect to a single Dataverse environment, usually provisioned in your headquarters region or your primary cloud region. This is the simplest from an architectural standpoint: one environment, one set of security policies, one licensing footprint. All operations use the same datasets, which eliminates data synchronization challenges and keeps organizational data unified. The trade-off is data residency compliance. If you operate in the European Union, storing EU customer data in a US-provisioned Dataverse does not comply with GDPR data residency expectations. Similarly, operations in Australia, Canada, or other regulated jurisdictions may violate local data governance requirements. You also incur network latency for users accessing Dataverse from distant regions, though this is typically 50-200ms and is not a business-critical problem for most transactional applications.

Multi-Region Isolated Environments means provisioning separate Dataverse environments in each major geography, with each environment containing only the data relevant to that region. A subsidiary in Germany operates its own Dataverse instance in West Europe. The Australian operations run their own instance in Australia Southeast. This approach satisfies data residency requirements and places data geographically close to users. The cost and complexity trade-off is significant. You now maintain multiple Dataverse environments, each with its own licensing, security configurations, and data models. Data integration between regions becomes a managed-sync problem: changes to a customer record in the European environment must be synchronized or reconciled with the global master record in the headquarters system, creating operational overhead and potential data quality risks if synchronization logic is not carefully designed.

Hybrid Hub-and-Spoke Strategy means maintaining a primary Dataverse for strategic or shared data (customers, products, organizational hierarchies) in one central region, with subsidiary Dataverse instances handling transactional and regional data separately. Each subsidiary has its own Dataverse for local customer records and operational data, while a central hub maintains the master customer list and product catalogs. This is architecturally sophisticated and requires disciplined data governance, but it balances compliance requirements with operational simplicity. Regional teams operate within their own data residency boundaries, while strategic dashboards and reporting pull from the hub using Power BI or other integration layers.
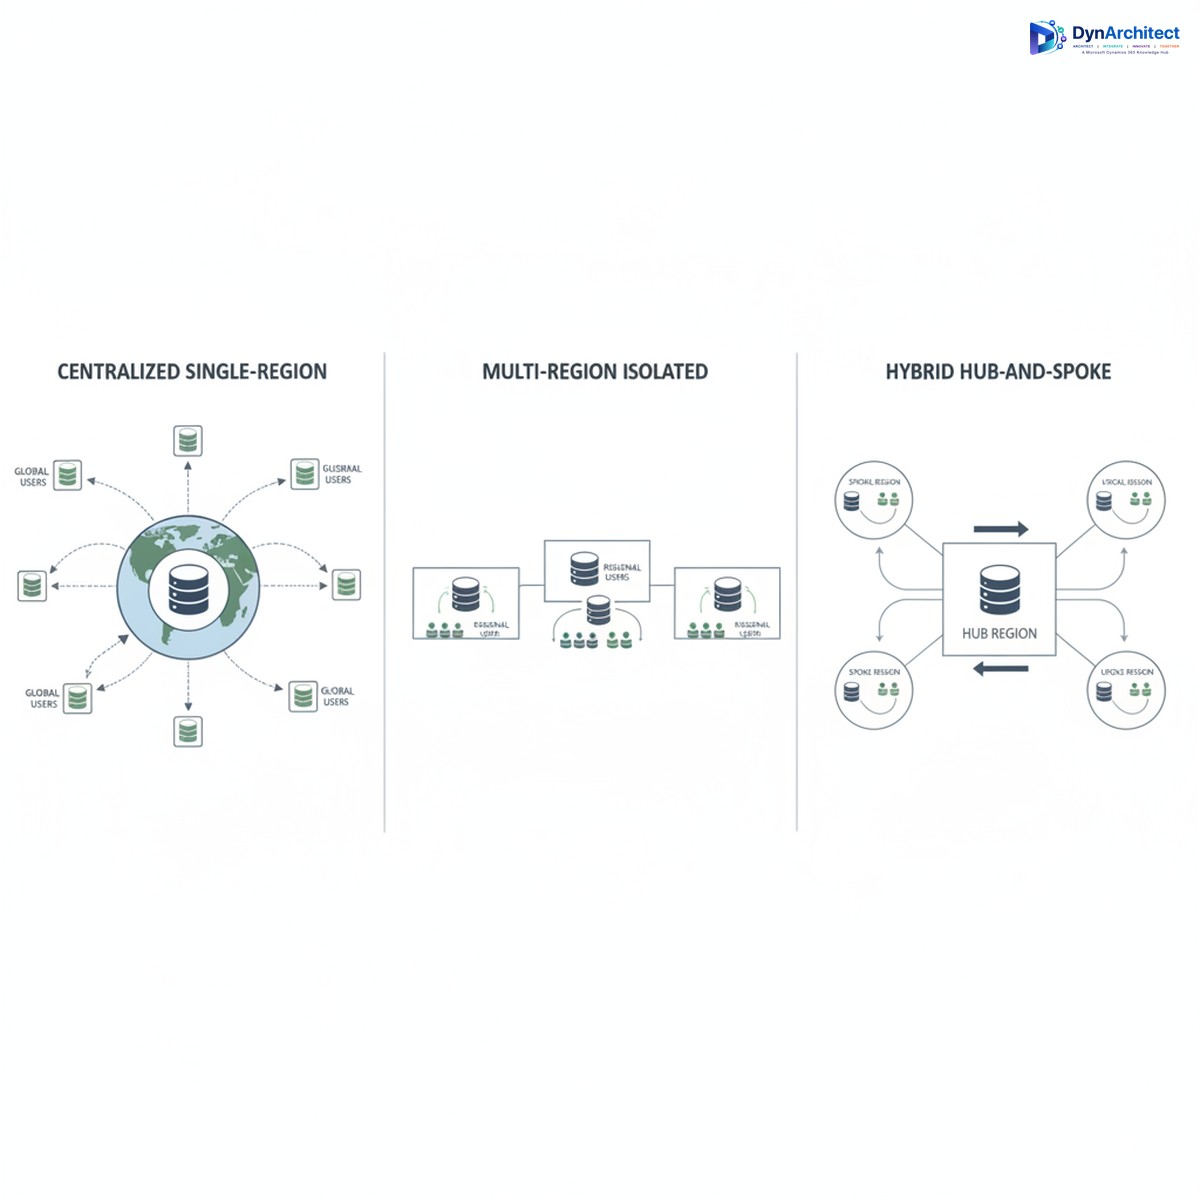
Comparison of three Dataverse deployment strategies: centralized, isolated, and hub-and-spoke

Licensing and Cost Implications

Many CIOs approach Dataverse licensing by counting total users and calculating a single per-user cost. This misses the actual cost structure. Dataverse licensing includes both user licenses (which grant access rights) and database storage licensing (which charges for actual data volume and database capacity). If you deploy isolated environments per region, you pay licensing for each separate environment. Ten gigabytes of data in a West Europe Dataverse plus ten gigabytes in an Australia Southeast Dataverse means licensing costs for twenty gigabytes of Dataverse storage, not ten.

This becomes material at scale. An organization with one hundred thousand customer records currently stored in a single Dataverse may not realize that splitting this data across three regional environments triples the Dataverse storage licensing footprint if done naively. If that organization also stores copies of data in on-premises systems or other cloud platforms for compliance reasons, the total cost of multi-region strategy can surprise finance teams who expected cloud consolidation to reduce overall data infrastructure spending.

Cost optimization strategies include careful database maintenance (removing obsolete records, archiving historical data), tiered storage architecture (hot data in Dataverse for operational use, cold data in Azure Blob Storage for compliance retention), and thoughtful environment consolidation where data residency requirements genuinely allow it.

Common Implementation Mistakes

Organizations frequently begin Power Platform rollouts with a single Dataverse environment in their primary region, assuming they can add residency strategy later. Months into deployment, when subsidiary operations are using Power Apps tied to that central environment, adding a separate regional environment requires data extraction and rearchitecting application logic to route data to the correct environment. This is expensive and disruptive.

A second common mistake is underestimating data residency requirements. Executives believe “it’s in Azure, so it’s compliant” without investigating whether the specific Azure region and data residency configuration actually satisfy regulatory obligations. GDPR, CCPA, data sovereignty laws, and industry-specific regulations (financial services, healthcare) all have different residency expectations, and “cloud” is not a compliance checkbox.

A third mistake is failing to track data ownership and sovereignty boundaries within a single environment. If you keep all data in a central US region, you still need clear governance about which records belong to which region and why they’re retained in a non-resident location. This is an audit finding waiting to happen if it’s not explicitly documented and justified.

Getting Started with a Residency-First Architecture

Before provisioning your first Dataverse environment, map your organization’s regulatory footprint and data residency requirements by region. Consult legal and compliance teams to understand which data categories are subject to residency mandates and which are not. Typically, customer records and certain operational data carry residency requirements, while master data like product catalogs and organizational hierarchies may not.

Sketch an environment strategy that assigns regions to Dataverse provisioning regions. For most multinational enterprises, this means at least one environment per major regulated geography. Document the business rationale for any exceptions (data categories that deviate from residency boundaries) so you have a defensible compliance position.

Engage your Microsoft partner and licensing team early to calculate the full licensing footprint of multi-environment strategy, including user licenses, database storage, and any advanced feature licensing. Compare this to your centralized baseline so leadership understands the trade-off.

Design your integration layer upfront. If you adopt hub-and-spoke, clarify which systems own each data domain and how synchronization will work. If you use isolated environments, specify how regional teams will access strategic data. This architecture conversation now, before systems are live, prevents expensive rearchitecting later.

Routeget Technologies has guided dozens of organizations through this planning process, helping them balance residency compliance with cost and operational efficiency. What often emerged was that thoughtful architecture early prevented millions in remediation costs later.

Data residency and Dataverse multi-region strategy is fundamentally a business decision, not a technology implementation. The CIO who makes this choice deliberately, in consultation with compliance, finance, and operations leadership, sets up a Power Platform footprint that scales confidently across geographies. The CIO who defers the decision and hopes it works out on its own tends to discover the problem after systems are live and users expect them to keep working.


#DataverseMultiRegion #CloudArchitecture #DataResidency #ComplianceStrategy #CIOGuidance #MicrosoftCloud #DataGovernance

Predictive Lead Scoring in Dynamics 365 Sales: Configuration and Model Governance

Your sales team receives three hundred leads per week, but only eight percent convert to qualified opportunities. Most sales leaders assume the problem is lead quality at source. The real problem is visibility: without a systematic way to identify which leads are most likely to convert, your reps spend time following up on prospects with low intent, while genuine high-intent leads sit in the queue waiting for attention.

Dynamics 365 Sales includes a native predictive lead scoring capability powered by machine learning. When configured correctly, it surfaces conversion likelihood as a numeric score directly on the lead form, helping your sales teams prioritize pipeline work and reduce time-to-qualification. The catch: most organizations enable the feature and assume it works immediately. In practice, predictive lead scoring requires careful model training, ongoing governance, and a clear understanding of what the model actually learns from your organization’s historical data.

This article walks through configuration, model governance, and the operational decisions that separate effective implementations from ones that generate noise without insight.

How Predictive Lead Scoring Actually Works in Dynamics 365 Sales

Dynamics 365 uses a machine learning model trained on your own historical lead-to-opportunity conversion data. The system looks back at leads created in your instance over a specified lookback window, typically six to twelve months, and identifies patterns: which fields, field values, and combinations of values correlate with leads that eventually converted to qualified opportunities.

Once trained, the model scores new incoming leads on a scale of zero to one hundred, with higher scores indicating higher predicted conversion likelihood. That score appears as a system-calculated field on the lead form and can be surfaced in views, charts, and mobile applications.

The model itself is not configurable at the formula level. You cannot adjust weights, add or remove features, or hand-code scoring logic. What you can configure is the data the model learns from: the lookback window, the definition of a converted lead, the data quality rules applied before training, and the threshold at which scores trigger actions such as automatic lead assignment or alerts to sales management.

Prerequisites and Data Quality Considerations

Before enabling predictive lead scoring, confirm that your historical lead data meets basic quality requirements. The model learns from whatever is in your database, including inconsistent statuses, duplicate records, and incomplete lead information. If your leads table has a high duplication rate or inconsistent status coding, the model’s training data is noisy, and its predictions will reflect that noise.

Specifically, check three things. First, confirm that your lead-to-opportunity conversion is tracked reliably. The model identifies a converted lead as one that was linked to a qualified opportunity. If your sales process sometimes creates opportunities without linking them to the originating lead, the model will treat those as unconverted, causing false negatives in the training data.

Second, verify that your lead statuses follow a consistent naming convention and that the lead status “Qualified” or your equivalent is used reliably. If some reps close leads with a status of “Closed (Won)” and others use “Qualified,” the model will see inconsistency and may under-weight the signals that should drive high scores.

Third, assess data completeness across key fields. If most leads in your database have empty Company Name, Industry, or other demographic fields, the model has less information to learn from and will depend heavily on behavioral signals alone, which can reduce accuracy for early-stage leads.

Configuration Steps and Model Training

In Dynamics 365 Sales, navigate to Settings and then Model Prediction Settings. Select Predictive Lead Scoring and choose Edit. The configuration form asks you to specify four items.

First, set the lookback window. This is the number of months of historical data the model will use for training, typically ranging from six to twenty-four months. A shorter window (six months) trains faster and reflects more-recent sales patterns, but may not include enough converted leads for the model to learn reliably if your conversion volume is low. A longer window (twelve to twenty-four months) provides more training data but may incorporate outdated sales patterns if your business model, market, or team composition has changed significantly.

Second, define the opportunity status that indicates a converted lead. Most organizations use “Qualified” or “Won,” but confirm this matches your actual sales process. If you have a custom opportunity status field, you can reference that instead.

Third, set the minimum lead age. This field controls which leads are included in the training set. A common choice is seven days, meaning only leads created at least seven days prior to the training run are included. This ensures the model trains on leads that have had time to be worked by the sales team and either qualify or close.

Fourth, optionally define additional filters to exclude low-quality records from training. For example, you might exclude leads where Company Name is empty, or leads created by batch imports from sources you consider unreliable.

Once you configure these settings and save, Dynamics 365 creates a training job. This job typically completes within a few hours, depending on the size of your lead table and the complexity of your data. After the job completes, the model is considered trained and begins scoring new leads automatically.

Monitoring and Governance

After the initial model training, predictive lead scoring runs on a daily schedule by default, scoring all new leads created since the last run. This means your model is static: it does not continuously learn or adapt. It only rescores existing leads if you manually trigger a retraining job.

This design choice has important implications. If your sales process changes (you add new qualification criteria, your target market shifts, or you acquire a company with different lead sources), your existing model will continue using old patterns. Conversely, if your model is performing well, leaving it static ensures consistent scoring behavior that your team learns to trust.

Establish a quarterly or semi-annual review cadence for model retraining. Pull a sample of leads scored high (eight five or above) and leads scored low (twenty five or below), and ask your sales leadership whether those scores match their intuition about lead quality. If high-scoring leads frequently fail to convert, the model may be picking up on signals that do not actually correlate with future sales success, suggesting your business environment has shifted.

Also monitor the score distribution over time. If your new leads average a score of forty but your model was trained on a cohort where the average score was sixty, that can indicate a change in lead source quality or inbound marketing mix. This is not necessarily bad, but it is a signal that the model may need retraining to reflect the new baseline.

Practical Integration: Actions Based on Scores

The score alone provides visibility, but the real value emerges when you use scores to trigger actions. Common integrations include automatic lead assignment to specific queues based on score thresholds, automatic field population (for example, setting Potential Revenue based on score and industry patterns), and creation of alerts or tasks for sales managers to follow up on high-score leads that remain unworked.

In Power Automate, create a cloud flow triggered when a lead is created or updated. Add a condition checking whether the predictive lead score is greater than seventy five. If true, set the lead owner to your highest-performing sales rep queue, or send an adaptive card notification to a sales manager with the lead details and score.

Be cautious with automatic routing based on score alone. If you route all high-score leads to a single rep, you create an artificial resource bottleneck. Instead, route to a queue and let the queue assignment rules distribute the load based on workload and territory. The score should inform priority within the queue, not become the sole routing criterion.

Common Pitfalls and How to Avoid Them

One frequent mistake is treating the predictive lead score as a definitive lead quality metric. The score reflects patterns from your past data, not market reality. A lead with a score of ninety does not guarantee a sale. It means that leads with similar characteristics converted historically, but circumstances change.

Another pitfall is enabling the feature and never revisiting it. If the model trains once and is never retrained, it will eventually drift out of sync with your business. Set reminders to review model performance quarterly and retrain semi-annually at minimum.

Finally, avoid over-automating based on scores. If you automatically disqualify leads below a certain score, you may discard leads that do not fit the model’s learned patterns but are actually viable. Instead, use scores to prioritize and segment, not to make hard gate decisions.

Predictive lead scoring works best when integrated into a sales process that still values human judgment and does not abdicate qualification decisions to an automated rule. The model is a guide, not an autopilot.

Conclusion

Predictive lead scoring in Dynamics 365 Sales can compress qualification cycles and help sales reps focus on high-intent leads. Success depends on clean historical data, careful configuration of the training window and conversion criteria, and regular model governance to keep scores aligned with your business.

Treat the initial model training as the beginning of an ongoing relationship with the feature. Monitor score distribution, retrain regularly, and integrate scores thoughtfully into your sales process rather than relying on automation alone. Done this way, predictive lead scoring becomes a genuine tool for sales productivity rather than a feature that runs silently in the background.

For organizations looking to deepen their approach to sales automation and lead management in Dynamics 365, Routeget Technologies provides implementation expertise and post-launch governance support that helps teams avoid common configuration errors and make the most of the platform’s analytics and scoring capabilities.

#PredictiveLeadScoring #DynamicsSalesOps #LeadQualification #SalesAutomation #DynamicsConfiguration #CRMImplementation #SalesProductivity


Tags: #PredictiveLeadScoring #DynamicsSalesOps #LeadQualification #SalesAutomation #DynamicsConfiguration #CRMImplementation #SalesProductivity

Intercompany Elimination Automation in Dynamics 365 Finance: The Journal Entry Trap Most Finance Leaders Miss

Finance operations team reviewing intercompany transactions

Opening Hook

You’re three weeks away from quarter-end close. Finance has forty intercompany transactions in the queue: payables between subsidiaries, recharges for shared services, allocation of corporate expenses. Your team has been manually creating elimination entries in Dynamics 365 Finance for two years now, checking each one against the subledger balances to make sure matching transactions offset properly. It works, but it’s a manual gauntlet—and every quarter, at least one entry gets posted twice, or one side doesn’t match the other, forcing a restatement. The real question isn’t whether you can automate it. It’s why you haven’t, and what you’re risking by waiting.

Intercompany elimination automation is one of those finance capabilities that sits between the realm of “obvious good idea” and “surprisingly complicated to implement.” Most organizations running Dynamics 365 Finance intend to automate it. Many skip it because the setup looks straightforward until you actually try to accommodate the real-world variations in how subsidiaries actually transact with each other. The result is that finance teams at medium and large enterprises spend days each close period on what should be a single-click process, and they accept monthly restatements as a cost of doing business.

The problem isn’t the tool. It’s the gap between what the elimination process *should* do and what most companies configure it to do.

Why Elimination Automation Fails in Practice

Intercompany elimination transaction flow diagram

Dynamics 365 Finance includes native intercompany elimination capabilities. You can set up elimination rules, run a batch process, and create the offsetting journal entries automatically. In theory, this solves the manual-entry problem. In practice, most finance teams who build this end up abandoning it or working around it because the actual requirements are messier than the standard feature handles.

The standard elimination process works like this: define a rule (for example, “eliminate all transactions between subsidiary A and subsidiary B”), run the process, and Finance creates an elimination entry that offsets the amounts on both sides. Clean. Logical. Doesn’t work for half your transactions.

Consider what actually happens at close time. You have intercompany payables where subsidiary A owes subsidiary B for consulting services. You have expense allocations where the parent company charged subsidiaries for IT overhead. You have intercompany sales that aren’t yet invoiced, sitting as accrued revenue. You have currency revaluation differences on intercompany balances. You have partial payments that leave hanging balances. You have transactions posted in different legal entities with different chart-of-accounts structures, so the elimination account on one side doesn’t perfectly mirror the elimination account on the other.

Standard elimination rules assume bilateral, matching transactions in symmetrical account hierarchies. Your actual data looks nothing like that. So when you run the elimination batch, you get partial results, exceptions, and holes you have to patch manually. The bottleneck doesn’t disappear; it just shifts from “enter elimination entries” to “fix elimination exceptions.”

Finance leaders often respond to this by either (a) maintaining manual entries anyway because they understand exactly what’s being eliminated, or (b) accepting that some intercompany balances don’t get eliminated and building manual reconciliation into the close checklist. Both options are expensive. Both hide the problem behind process discipline rather than solving it.

The Core Configuration Trap

The most common failure point is account-matching logic. Dynamics 365 Finance’s elimination feature requires you to specify which accounts on one side of the transaction pair with which accounts on the other side. This sounds straightforward: payables account 200100 on the subsidiary pairs with revenue account 400200 on the parent. For a multi-subsidiary enterprise, you end up with dozens of pairing rules, each of which assumes the same chart-of-accounts structure exists in every legal entity.

But most organizations don’t have symmetrical chart-of-accounts structures across subsidiaries. One subsidiary might use a three-digit cost center code as part of its account number; another uses a six-digit project code. One subsidiary’s chart reflects its regulatory requirements; another reflects its parent’s reporting structure. When you try to force a uniform pairing rule across this, the automation fails on the exceptions—and the exceptions are where your intercompany risk actually lives.

The second configuration trap is elimination method selection. Dynamics 365 Finance offers three elimination methods: by elimination account, by elimination rules, and by source dimensions. Many teams choose by elimination account because it sounds simpler: just specify the account number that identifies an elimination entry, and the system will eliminate matching balances. This works if every intercompany transaction is coded to the same elimination account. It fails the moment transactions are coded to different accounts based on business unit or transaction type, which is what most accounting policies actually require.

A third trap, often overlooked during implementation, is timing. The elimination process doesn’t recognize transaction reversals. If subsidiary A reverses an intercompany invoice in one period and reissues it in the next, the elimination logic might net them in one period (correctly) but not eliminate the new entry in the next (incorrectly). If you have accrual entries that roll forward, the system doesn’t know whether an accrual has been settled or not. You end up eliminating transactions that shouldn’t be eliminated, or leaving open balances that should have been cleared.

What Actually Works: The Approach That Finance Leaders Should Use

The finance teams with the most reliable elimination processes don’t rely on the standard feature to do all the work. Instead, they use Dynamics 365 Finance’s elimination tools as a framework, but they layer on additional validation and semi-automation. Here’s the pattern:

First, establish elimination rules that cover your high-volume, repetitive transactions. These are usually the 70 or 80 percent of intercompany activity that follows a consistent pattern: standard intercompany invoicing, allocated expenses, routine recharges. For these, the elimination batch process should work cleanly. Document what these rules eliminate, down to the account level and dimension combinations.

Second, build a separate process for exception handling. Run the elimination batch, but don’t post the results immediately. Export the elimination entries to Excel or a Power BI model, and validate them against your subledger balances before posting. Check that every elimination entry has a matching transaction on both sides of the elimination. Check that no entries are created for reversal transactions or accruals that should roll forward. This step takes time, but it’s a single review pass instead of forty manual entries, so it’s still a win. It also creates an audit trail for your external auditors.

Third, identify which intercompany transactions or balance types require manual elimination because they’re too irregular for the standard process. These might be settlement-in-progress balances, partial intercompany payments, or transactions that cross subsidiaries with fundamentally different chart structures. Document these explicitly. Don’t pretend the automation covers them. Instead, build a checklist that the finance team follows at close time to ensure these balances are explicitly reviewed and eliminated if appropriate.

Fourth, if your organization is running Dynamics 365 Finance with Power Automate or has development resources, invest in a custom validation flow. The flow should read the pending elimination entries, compare them to the underlying subledger transactions, check for matching invoices or supporting documentation, and flag entries that don’t pass basic reasonableness checks. This isn’t fully automatic elimination, but it’s a guardrail that catches the most common errors: duplicated entries, reversed entries posted as new eliminations, and account mismatches that slipped through the configuration.

The Business Case for Getting This Right

Finance organizations that automate 80 percent of intercompany eliminations and tightly control the remaining 20 percent typically see close cycles compress by two to three days. They reduce restatements for intercompany errors to nearly zero. They cut the finance team’s close-period overtime significantly. They have a documented process that external auditors can review with confidence.

But the real benefit is visibility. When intercompany eliminations are systematized, not manual, you actually know which transactions were eliminated and why. You have an audit trail. You can run analytics on intercompany activity and see patterns: which subsidiaries have the most outstanding intercompany balances, which transaction types take longest to settle, where cash is actually stuck in the system. That visibility drives better working capital management and faster cash conversion.

The risk of not doing this isn’t just operational. If your finance team is doing intercompany eliminations manually, you’re relying on individual judgment calls about what to eliminate and what to leave open. That’s fine until someone new joins the team, or someone leaves, and the institutional knowledge walks out the door. You end up with intercompany balances that neither the subsidiary nor the parent fully understands. You run into issues at audit time or during a consolidation review that force a restatement.

Getting Started

If you’re currently doing intercompany eliminations manually in Dynamics 365 Finance, your first step is to stop trying to fully automate them immediately. Instead, audit what you’re actually eliminating each month. Document the transactions, the accounts involved, the business rationale. This gives you the blueprint for what the automation should cover versus what requires manual review.

Build the elimination rules in a test environment first, and run them against three months of historical data. Don’t post the entries. Instead, compare what the system generated against what your finance team actually eliminated in those three months. Identify where the automation missed transactions or created incorrect entries. Fix the configuration. Repeat.

Once the automation covers the repetitive 80 percent cleanly, document what’s left as exception handling. Document the account pairing rules so that whoever is managing the process next year—or five years from now—understands why the automation is configured the way it is.

If you have the resources, layer on a Power BI dashboard or a Power Automate flow that validates elimination entries before posting. Even a simple check that counts invoices on both sides of the elimination catches most errors.

The close process is where finance leaders are usually most stretched during the month. Taking even two days off your close cycle is worth the implementation effort.

About Routeget Technologies

Routeget Technologies has spent years helping mid-market and enterprise finance organizations streamline their period-close processes in Dynamics 365 Finance. Intercompany elimination automation is one of the first things we look at during an implementation review because it’s one of the highest-return-on-effort improvements available. If your current close process is still mostly manual, we can help you audit what’s actually happening, design an elimination configuration that works for your subsidiary structure, and build the validation layer that keeps the automation reliable.


#IntercompanyElimination #DynamicsFinanceOps #FinanceAutomation #PeriodClose #ERPGovernance #FinanceTransformation #DynamicsFinance

Why CIOs Underestimate the Cost of Poor Sales Data Quality in Dynamics 365

Why CIOs Underestimate the Cost of Poor Sales Data Quality in Dynamics 365

Your CFO walks into your office with a question: “Why are our forecasts off by 30 percent every quarter?” Before you can answer, your VP of Sales chimes in about reps spending two hours a day manually cleaning data instead of selling. Both are describing the same invisible cost, and it’s draining millions in lost productivity and revenue visibility across your organization. Yet most CIOs budget for platform licenses and integrations while treating data quality as a business problem, not a technology one. It is, in fact, both.

Dynamics 365 Sales can deliver remarkable visibility into pipeline health and customer behavior. The platform excels at capturing, organizing, and surfacing information. But the data flowing through those systems reflects the behavior of thousands of individual salespeople who prioritize closing deals over database hygiene. When records remain incomplete, duplicated, or outdated, the platform becomes a liability: forecasts become guesses, reporting becomes hours of manual reconciliation, and decision-making suffers because nobody trusts what the dashboard shows.

The hidden cost goes far beyond compliance frustration. Poor data quality creates a cascade of operational friction that affects margins, customer retention, and employee satisfaction in ways that traditional IT budgets don’t account for.

The True Cost Architecture

Most organizations measure CRM data quality in a single dimension: “How complete is the contact record?” But the real impact spreads across at least four distinct operational costs that accumulate quickly.

First is the operational drag on sales teams themselves. When salespeople cannot trust the data they see, they replicate effort. A rep might open a contact record, find it incomplete, and spend thirty minutes calling the client to re-verify information that should already be there. This happens thousands of times a month across a medium-sized sales organization. Multiplied across annual hours and sales compensation, this single friction point can exceed six figures in lost productivity for a 50-person sales team.

Second is the cost of downstream process failures. When a lead record is incomplete or duplicated, it corrupts every downstream process that depends on it. Duplicate records lead to redundant follow-ups, wasted marketing spend, and customer frustration when they receive the same message twice. Bad data in the opportunity record means inaccurate revenue recognition, failed forecasting, and last-minute scrambles to understand why quarterly projections missed by millions.

Third is the cost of unreliable decision-making. A CFO looking at a forecast report cannot distinguish between a strong pipeline and a data quality problem. This uncertainty creates two bad outcomes: either decisions get made on incomplete information, or meetings get delayed while finance teams spend hours validating data that should be trustworthy. The cost is not always quantifiable, but it is real in terms of decision velocity and confidence.

Fourth is the cost of rework and remediation. Once data quality problems accumulate, fixing them becomes increasingly expensive. Hiring a data analyst to run one-off cleanup scripts, blocking users to perform bulk-import corrections, or buying third-party data enrichment services all represent unplanned spending that reflects poor data governance earlier in the system’s lifecycle.

Why Good Data Governance Saves More Than It Costs

The instinct to defer data governance is understandable. It requires investment in process design, user training, and often tooling. It feels like overhead when the system is already deployed and working. This thinking reverses the actual economics.

A typical medium-market organization running Dynamics 365 Sales generates 500 to 1,000 new lead or opportunity records per week across all teams and channels. Left unmanaged, data decay accelerates. Contacts move to new roles without updating their account relationship. Phone numbers become obsolete. Competitors are captured in competing fields depending on which rep filled them out. Over a year, 20 to 30 percent of records become partially corrupted or unreliable.

Establishing clear data governance on the front end prevents that decay from taking root. This means defining required fields based on business outcomes, not just technical minimums. It means automating common data entry patterns where possible using Power Automate or plugin logic. It means creating simple, non-punitive workflows that catch obvious errors at the moment of entry rather than after they’ve been analyzed and reported.

The investment horizon is short. A data governance program that costs 50,000 to 100,000 in the first year typically pays for itself within six to nine months when measured against the operational cost of poor data. A sales team that trusts their data moves faster through the pipeline. Forecasting becomes reliable, which means finance can commit with confidence. Marketing can stop buying more leads to compensate for poor conversion and instead optimize against better segmentation.

Implementation Starting Points

Data governance in Dynamics 365 is not a one-time project; it is an ongoing operational capability. Organizations that perform well typically start with three elements.

First is a clear definition of what constitutes “good data” for each entity type. This is more specific than “all required fields must be filled.” It means defining business rules such as “opportunities cannot proceed to stage 3 without a contact name, title, and confirmed budget” or “any contact created through a website form must have their source and campaign tracked.” These rules should be documented and then built into the platform using Dynamics 365 business processes and Power Apps to make them invisible to the user.

Second is a data steward function, even if it starts part-time. This person or small team owns the quality of the data flowing through the system. They don’t enter all the data themselves; instead, they establish procedures, monitor quality metrics, and coach sales and marketing teams on why the governance rules matter to their work. They also have authority to make targeted corrections and to intervene when patterns of bad data emerge from a particular source or team.

Third is ongoing monitoring through dashboards and reports that surface data quality metrics to both the operations team and to leadership. Metrics such as record completeness by account owner, duplicate detection reports, or the percentage of opportunities with populated deal stage history should be visible and trended. When leadership sees that data quality is improving, behavior changes. When sales managers see that their team’s data cleanliness affects forecast accuracy, they prioritize it.

Starting Before It Gets Worse

Most organizations do not invest in data quality until it becomes a crisis. A sales forecast misses badly and suddenly finance demands to know why. A compliance audit reveals that customer consent tracking is incomplete. A new analytics initiative fails because nobody can trust the underlying data.

The better time to invest is now, before the debt accumulates further. Dynamics 365 sales organizations running for more than two years almost always have significant data quality challenges. They are also almost always unaware of how much those challenges cost them operationally.

A focused effort to establish governance, train the organization, and implement basic controls typically takes four to eight weeks and involves both technology changes and process discipline. The return in operational clarity, team velocity, and decision confidence arrives within months. For a CIO, data governance in Dynamics 365 is not an IT infrastructure project; it is a business transformation initiative that returns value faster than most other platform investments.

The question is not whether your organization has a data quality problem. It does. The question is whether you address it by design or by crisis.


Routeget Technologies specializes in Dynamics 365 implementations and governance programs. Our Dynamics 365 consulting teams help organizations establish data quality practices that accelerate adoption and unlock the business value embedded in the platform.


#SalesDataQuality #Dynamics365CRM #DataGovernance #SalesOperations #CRMImplementation #DataManagement

Why CIOs Underestimate the Cost of Poor Sales Data Quality in Dynamics 365

Why CIOs Underestimate the Cost of Poor Sales Data Quality in Dynamics 365

Your CFO walks into your office with a question: “Why are our forecasts off by 30 percent every quarter?” Before you can answer, your VP of Sales chimes in about reps spending two hours a day manually cleaning data instead of selling. Both are describing the same invisible cost, and it’s draining millions in lost productivity and revenue visibility across your organization. Yet most CIOs budget for platform licenses and integrations while treating data quality as a business problem, not a technology one. It is, in fact, both.

Dynamics 365 Sales can deliver remarkable visibility into pipeline health and customer behavior. The platform excels at capturing, organizing, and surfacing information. But the data flowing through those systems reflects the behavior of thousands of individual salespeople who prioritize closing deals over database hygiene. When records remain incomplete, duplicated, or outdated, the platform becomes a liability: forecasts become guesses, reporting becomes hours of manual reconciliation, and decision-making suffers because nobody trusts what the dashboard shows.

The hidden cost goes far beyond compliance frustration. Poor data quality creates a cascade of operational friction that affects margins, customer retention, and employee satisfaction in ways that traditional IT budgets don’t account for.

## The True Cost Architecture

Most organizations measure CRM data quality in a single dimension: “How complete is the contact record?” But the real impact spreads across at least four distinct operational costs that accumulate quickly.

First is the operational drag on sales teams themselves. When salespeople cannot trust the data they see, they replicate effort. A rep might open a contact record, find it incomplete, and spend thirty minutes calling the client to re-verify information that should already be there. This happens thousands of times a month across a medium-sized sales organization. Multiplied across annual hours and sales compensation, this single friction point can exceed six figures in lost productivity for a 50-person sales team.

Second is the cost of downstream process failures. When a lead record is incomplete or duplicated, it corrupts every downstream process that depends on it. Duplicate records lead to redundant follow-ups, wasted marketing spend, and customer frustration when they receive the same message twice. Bad data in the opportunity record means inaccurate revenue recognition, failed forecasting, and last-minute scrambles to understand why quarterly projections missed by millions.

Third is the cost of unreliable decision-making. A CFO looking at a forecast report cannot distinguish between a strong pipeline and a data quality problem. This uncertainty creates two bad outcomes: either decisions get made on incomplete information, or meetings get delayed while finance teams spend hours validating data that should be trustworthy. The cost is not always quantifiable, but it is real in terms of decision velocity and confidence.

Fourth is the cost of rework and remediation. Once data quality problems accumulate, fixing them becomes increasingly expensive. Hiring a data analyst to run one-off cleanup scripts, blocking users to perform bulk-import corrections, or buying third-party data enrichment services all represent unplanned spending that reflects poor data governance earlier in the system’s lifecycle.

## Why Good Data Governance Saves More Than It Costs

The instinct to defer data governance is understandable. It requires investment in process design, user training, and often tooling. It feels like overhead when the system is already deployed and working. This thinking reverses the actual economics.

A typical medium-market organization running Dynamics 365 Sales generates 500 to 1,000 new lead or opportunity records per week across all teams and channels. Left unmanaged, data decay accelerates. Contacts move to new roles without updating their account relationship. Phone numbers become obsolete. Competitors are captured in competing fields depending on which rep filled them out. Over a year, 20 to 30 percent of records become partially corrupted or unreliable.

Establishing clear data governance on the front end prevents that decay from taking root. This means defining required fields based on business outcomes, not just technical minimums. It means automating common data entry patterns where possible using Power Automate or plugin logic. It means creating simple, non-punitive workflows that catch obvious errors at the moment of entry rather than after they’ve been analyzed and reported.

The investment horizon is short. A data governance program that costs 50,000 to 100,000 in the first year typically pays for itself within six to nine months when measured against the operational cost of poor data. A sales team that trusts their data moves faster through the pipeline. Forecasting becomes reliable, which means finance can commit with confidence. Marketing can stop buying more leads to compensate for poor conversion and instead optimize against better segmentation.

## Implementation Starting Points

Data governance in Dynamics 365 is not a one-time project; it is an ongoing operational capability. Organizations that perform well typically start with three elements.

First is a clear definition of what constitutes “good data” for each entity type. This is more specific than “all required fields must be filled.” It means defining business rules such as “opportunities cannot proceed to stage 3 without a contact name, title, and confirmed budget” or “any contact created through a website form must have their source and campaign tracked.” These rules should be documented and then built into the platform using Dynamics 365 business processes and Power Apps to make them invisible to the user.

Second is a data steward function, even if it starts part-time. This person or small team owns the quality of the data flowing through the system. They don’t enter all the data themselves; instead, they establish procedures, monitor quality metrics, and coach sales and marketing teams on why the governance rules matter to their work. They also have authority to make targeted corrections and to intervene when patterns of bad data emerge from a particular source or team.

Third is ongoing monitoring through dashboards and reports that surface data quality metrics to both the operations team and to leadership. Metrics such as record completeness by account owner, duplicate detection reports, or the percentage of opportunities with populated deal stage history should be visible and trended. When leadership sees that data quality is improving, behavior changes. When sales managers see that their team’s data cleanliness affects forecast accuracy, they prioritize it.

## Starting Before It Gets Worse

Most organizations do not invest in data quality until it becomes a crisis. A sales forecast misses badly and suddenly finance demands to know why. A compliance audit reveals that customer consent tracking is incomplete. A new analytics initiative fails because nobody can trust the underlying data.

The better time to invest is now, before the debt accumulates further. Dynamics 365 sales organizations running for more than two years almost always have significant data quality challenges. They are also almost always unaware of how much those challenges cost them operationally.

A focused effort to establish governance, train the organization, and implement basic controls typically takes four to eight weeks and involves both technology changes and process discipline. The return in operational clarity, team velocity, and decision confidence arrives within months. For a CIO, data governance in Dynamics 365 is not an IT infrastructure project; it is a business transformation initiative that returns value faster than most other platform investments.

The question is not whether your organization has a data quality problem. It does. The question is whether you address it by design or by crisis.

—

*Routeget Technologies specializes in Dynamics 365 implementations and governance programs. Our Dynamics 365 consulting teams help organizations establish data quality practices that accelerate adoption and unlock the business value embedded in the platform.*

—

#SalesDataQuality #Dynamics365CRM #DataGovernance #SalesOperations #DynamicsConsulting

Power Automate Desktop Flow Error Handling: Designing Reliable Unattended RPA for Finance Automation

Finance automation dashboard showing error logs and performance metrics

It is 8 a.m., and your finance team discovers the unattended desktop flow that processes overnight vendor invoices never completed. The bot logged into the ERP, opened the vendor invoice module, clicked through the first two forms, then stopped. No error message. No retry. By now, 500 invoices have piled up in the inbound folder, and the accounts payable clerk is manually logging them in. This scenario plays out in production environments every week, and the root cause is almost always the same: a UI element did not load in time, a dropdown rendered differently, or a network timeout caught the flow mid-interaction. The flow had no error handling, so it simply stopped, leaving no trace for anyone to diagnose.

This is the cost of unguarded desktop automation in finance operations. Unlike cloud-based flows with built-in retry mechanisms and structured error handling, Power Automate desktop flows operate at the edges of UI fragility. They click buttons, read text fields, and wait for controls to appear, making them dependent on stable selectors, predictable timing, and consistent system state. When any of those assumptions break, the entire unattended run fails silently, and your batch processing becomes a silent disaster.

Designing reliable desktop flows for finance means treating error handling not as an afterthought, but as a structural requirement. This guide walks through the strategies, patterns, and tools that let you build unattended RPA flows that tolerate real-world failures and keep your finance processes moving.

Where Errors Hide in Desktop Flows

Desktop flows fail at predictable boundaries. Understanding where to expect trouble is the first step toward preventing it.

UI interactions are the most fragile component of any desktop flow. A selector depends on stable element IDs, control names, or image references. But ERP forms change with updates, browsers render elements in different orders depending on load times, and dropdowns sometimes load asynchronously. A web automation expert will click a “Save” button that works perfectly in test, then fails in production because the button did not render before the click action fired.

File operations introduce another failure mode. Your flow reads vendor invoices from a network folder. But network connectivity drops for a second, a filename contains unexpected characters, or the file gets locked by another process. Without explicit error handling, the flow crashes and the batch stalls.

External system calls add latency and timeout risk. When your flow posts data to Dynamics 365 Finance and Operations or calls an API, network delays or rate-limiting can cause timeouts. The flow queues the request, waits 30 seconds, and gets no response. Without retry logic, it treats a temporary timeout as permanent failure.

Database operations can fail if the connection drops, the schema changes, or a unique constraint violation occurs. These are recoverable errors, but only if your flow is designed to catch them.

The critical insight is that none of these failures are truly catastrophic. A file-read error is recoverable (retry a few seconds later). A UI selector failure might be fixable with a fallback selector. A rate-limited API call should wait and retry, not fail the entire batch. But standard desktop flow design treats them all as terminal.

Structuring Error Detection and Recovery

Error handling and retry logic flow diagram

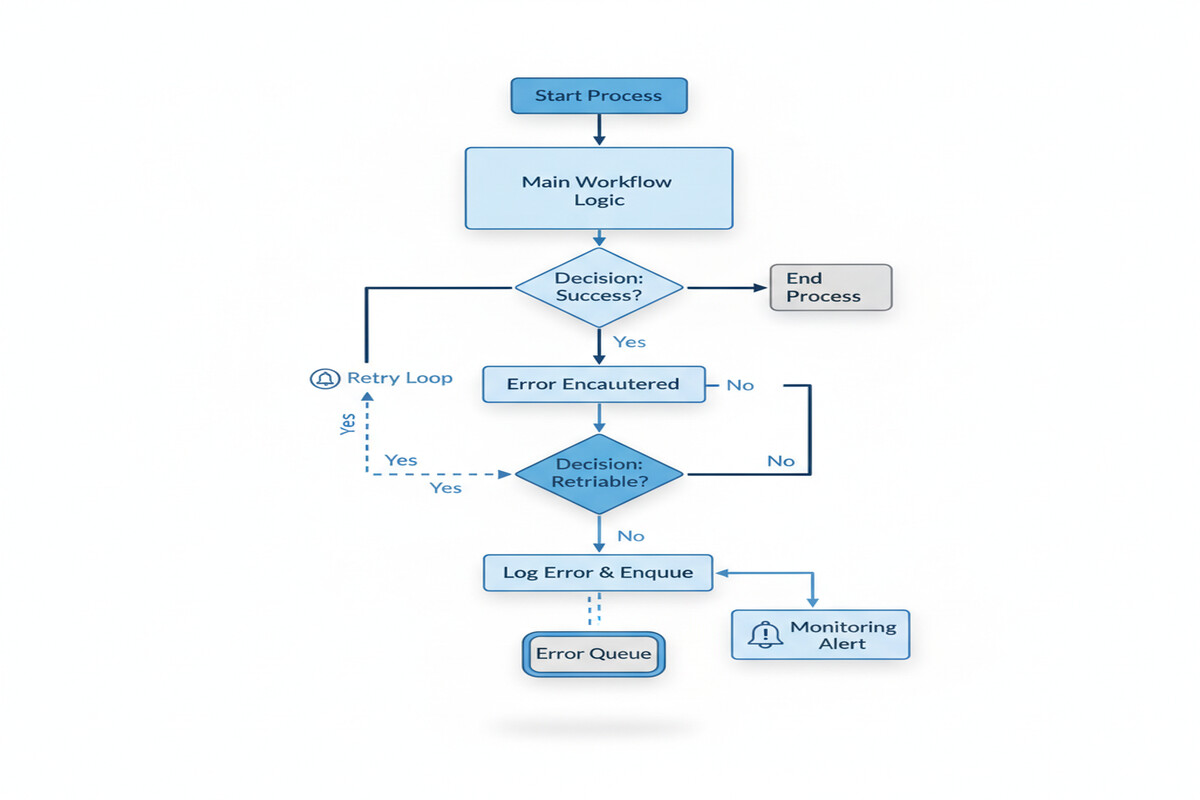
The fix starts with deliberate error handling at every risky operation. In Power Automate desktop flows, this means wrapping key actions in error-handling blocks and designing recovery logic for each failure type.

For UI interactions, implement multiple selector strategies. Your primary selector targets a button by its automation ID, but include a fallback that searches by image or OCR text. If the first method fails, the flow tries the second before declaring defeat. Add explicit waits with timeouts before clicking, giving slow-loading forms time to render. Rather than hoping a dropdown appears in exactly 2 seconds, wait up to 10 seconds but proceed immediately if it appears sooner.

For file operations, check that files exist before attempting to read them. Wrap file reads in error handlers that catch “file not found” or “access denied” errors. Implement a retry loop that waits 3 seconds and tries again, up to three times. This handles transient network glitches without manual intervention. Log every file operation to your audit trail, including timestamps and error details.

For API calls, build explicit timeout and retry logic. When calling a Finance and Operations endpoint, set a reasonable timeout (10 to 15 seconds for most invoice operations), then add retry logic. If the call fails, wait a few seconds, then retry. This pattern, called exponential backoff (where wait time increases with each retry), handles temporary network issues and transient service problems. After three retries, log the failure and move to the next item, rather than halting the entire batch.

For validation errors (OCR confidence too low, GL account does not exist, vendor number invalid), treat these differently. These are not temporary failures; they reflect real data quality issues. Log the validation failure with details, add the item to a “review queue” in Dataverse, and continue processing. This partial-failure pattern is critical for batch operations: some items succeed, some need manual review, and the entire batch does not fail because of one bad invoice.

Building Visibility Through Monitoring

Error handling is only useful if you know when it is being triggered. Build monitoring into your flows from the start.

Every error should be logged to a structured destination. Create a Dataverse table called “Desktop Flow Error Log” with fields for flow name, timestamp, error type, error message, affected item (invoice number, vendor ID), and status (retry pending, review needed, failed). When your flow encounters an error, write a record to this table before proceeding.

Implement email and Teams alerts for critical failures. If a flow encounters more than three failures in a single run or fails to process more than 10 percent of items, send an alert to your finance operations team. Include the error log snippet so they can see which items need attention.

Create a Power BI dashboard showing flow performance metrics: items processed per run, success rate, average processing time per item, and top error types. Track these over weeks to identify patterns. Perhaps 95 percent of failures are “GL account not found,” indicating a data quality issue in your GL master. Perhaps 80 percent fail between 2 a.m. and 3 a.m., suggesting a scheduled database backup that blocks access.

Use Dataverse to maintain a “dead-letter queue” of failed items. When an error is unrecoverable after retries, the flow moves the item to this queue instead of simply stopping. Your finance team reviews the dead-letter queue each morning, triaging items for manual processing or corrective action.

A Practical Implementation

Consider a concrete scenario: your flow processes vendor invoices from a shared folder, extracts details via OCR, validates data against your GL, and posts to Dynamics 365 Finance and Operations.

The flow starts by listing files in the folder. Error handling: check that the folder exists and is accessible. If not, log a failure and exit gracefully.

For each file, the flow reads it (error handling: retry three times if locked or inaccessible). It applies OCR to extract vendor number, invoice amount, and GL account. If OCR confidence is below 85 percent, log the item as “low confidence” and queue it for review. This is not a retry scenario; it is a data quality gate.

The flow validates the vendor number against your vendor master via Finance and Operations API. Error handling: wrap in try/catch. If the call times out, retry with exponential backoff (wait 3 seconds, retry; wait 6 seconds, retry; wait 12 seconds, retry). If it still fails, log and queue for review. If the vendor is not found, the flow logs this specific error and moves the item to the review queue—retrying is pointless.

Finally, the flow posts the invoice to Finance and Operations. Wrap this in retry logic: try once, then retry twice with waits. If all three attempts fail, log the invoice with full details to the error table and dead-letter queue.

Throughout, track metrics: items processed, succeeded, reviewed, and failed. At the end of the run, log a summary and send an alert if the failure rate exceeds your threshold.

Designing for Partial Success

The mindset shift is subtle but profound. Design flows to succeed partially. Some invoices post immediately. Some fail validation and go to the review queue. Some hit transient API errors, retry, and eventually post. Some encounter unrecoverable errors and go to the dead-letter queue.

This requires that underlying systems support idempotency (running the same operation twice produces the same result, not duplicates). It requires careful state tracking so your flow knows which items have been processed. It requires monitoring that surfaces failures quickly.

Test error paths as deliberately as you test the happy path. Identify the three highest-risk operations in your flow. Add explicit error handling to each. Add logging. Set up alerts. Then scale from there. This is how you build desktop flows that run unattended, at scale, in production finance environments, turning silent failures into managed, observable exceptions.

Routeget Technologies brings deep experience in building production-scale RPA for finance automation, from designing error-resilient flows through monitoring strategy and alerting. If your organization is scaling unattended desktop automation and needs guidance on reliability and governance, we can help navigate the implementation challenges that most organizations discover too late.


#PowerAutomateErrorHandling #RPAFinance #DesktopFlowRetry #UnattendedAutomation #DynamicsFinanceAutomation #AutomationReliability #ProcessMining

Business Central Multi-Company Consolidation: The Feature Gap Finance Leaders Don’t See Coming

Every CFO implementing Business Central for a multi-entity organization asks the same question within weeks: “Where is the consolidation module?” The answer exposes a gap that often catches finance leadership off guard. Unlike Dynamics 365 Finance & Operations, Business Central has no native intercompany consolidation engine. That feature absence is not a bug or a temporary roadmap item; it is a deliberate design choice rooted in BC’s architecture and target market. Understanding why matters because misreading this reality creates expensive downstream problems that finance teams discover months into a rollout.

Microsoft designed Business Central for the midmarket: primarily single-entity or loosely-coupled organizations. The platform assumes most BC customers either operate a single legal entity or maintain separate database instances per company, with consolidation handled outside the system via Excel, Power BI, or external tools. This works perfectly for a manufacturer with one operating company and a few regional sales offices that don’t require true intercompany transactions. It breaks down immediately when a customer has acquired three subsidiaries, each on their own BC instance, and the CFO’s finance team needs consolidated group financial statements by the first of the month.

The confusion stems partly from BC’s multi-company user interface. Users can navigate between separate companies within a single BC tenant, giving the appearance of a unified system. The reality is different: each company is a separate database schema. Transactions post to separate general ledgers. The multi-company feature is a navigation and reporting convenience, not a consolidation backbone. Finance teams often believe consolidated reporting is one Power BI dashboard away from a solution, only to learn that the data model required for accurate consolidation—elimination entries for intercompany transactions, equity rollforward, minority interests, revaluation adjustments—exists nowhere in BC’s native feature set.

This creates three categories of actual problems that surface during the consolidation planning phase.

The first problem is intercompany transaction elimination. Suppose you have a parent company and two subsidiaries, all on BC. The parent company invoices subsidiary A for management services; subsidiary A invoices subsidiary B for purchased goods. Without a native consolidation module, each invoice posts as a real customer or vendor transaction in the receiving company’s books. During month-end, finance must manually identify these intercompany flows, create reversing entries, and ensure the elimination amounts match across companies. A single unmatched penny means the consolidated balance sheet won’t balance. In organizations with hundreds of intercompany transactions monthly, this becomes a bottleneck that often forces consolidation closes to slip by five to ten days, and the effort eventually drives demand for a dedicated consolidation software license on top of BC.

The second problem is equity and capital structure. BC tracks retained earnings and equity per company, but consolidation requires rolling forward opening equity at the subsidiary level, eliminating the subsidiary’s equity against the parent’s investment in subsidiary account, and calculating minority interests if the parent doesn’t own 100 percent. These calculations are external to BC’s financial reporting model. The CFO’s team either builds them in a separate tool—Power BI, Excel with Power Query, Anaplan, or similar—or manages them manually by GL account. The risk is high: a missed rollforward or incorrect elimination can distort group equity and overstate or understate the parent’s ownership claim, triggering downstream issues in audit, regulatory reporting, and capital plan discussions.

The third problem is revaluation and adjustment transactions. Many multi-entity organizations consolidate in a reporting currency different from local currencies, requiring foreign exchange revaluation adjustments. Some organizations consolidate at a higher price point than operational books, requiring allocation or writeup entries. Some pursue purchase accounting adjustments for recently acquired entities. All of these must be managed outside BC. The more adjustments required, the more likely a consolidation team will abandon BC as the source and instead build a separate consolidation layer in dedicated software, accepting BC as a operational ledger system only.

For organizations that absolutely require native consolidation, the paths are limited. Some choose to consolidate via Power BI Desktop, building the elimination logic in DAX measures and the data model, then publishing consolidated statements to a workspace. This works for companies willing to accept Power BI’s design constraints: limited support for large intercompany matrices, long refresh times if transaction volumes are high, and a reporting-only layer that does not feed back into GL for audit trail purposes. Others select a dedicated consolidation tool such as OneStream, Certent, Tableau, or Microsoft’s own Anaplan. The consolidation software becomes the single source of truth for group reporting, pulling operational data from BC instances and producing the consolidated financial statement. This creates a license cost external to BC, a separate user community, and a need to manage data integration and reconciliation between BC and the consolidation platform.

A third path, less common but increasingly pragmatic, is to implement BC only at the consolidated level and keep subsidiary ledgers in their existing systems. The parent company runs BC and reconciles to the subsidiary ledgers via month-end intercompany settlements rather than consolidating underlying GL detail. This works well for organizations that acquire mature, stable subsidiaries and want a clean integration without forcing migration. It requires a more complex intercompany/intersegment accounting setup in BC but avoids the consolidation feature gap entirely. The parent GL becomes the group GL, and subsidiaries report upward rather than consolidating downward.

The best practice for any organization evaluating BC for a multi-entity structure is to answer the consolidation question before implementation, not during. The CFO’s finance team should clearly define what consolidation means for their organization: Do they need elimination of intercompany transactions? Do they need IFRS 10 consolidation with minority interests? Will they require foreign exchange revaluation? Will they consolidate monthly, quarterly, or annually? Once the scope is clear, BC’s ability to support it is measurable. For organizations needing full consolidation with elimination logic and frequent reporting cycles, a dedicated tool is the right choice. For organizations needing rolled-up reporting from operationally separate entities with limited intercompany transactions, BC plus Power BI often suffices. For organizations running subsidiary ledgers as operational feeds to a parent BC company, BC alone works well. The critical mistake is assuming BC includes consolidation as a standard feature and discovering the gap after implementation begins.

Routeget Technologies regularly advises finance organizations on this trade-off. The organizations that achieve the smoothest multi-entity BC implementations are the ones that separate the operational ledger expectation from the consolidation expectation during vendor selection and architecture planning, rather than treating consolidation as a feature that should simply be there because D365 F&O includes it. BC’s architectural simplicity—what makes it fast and cost-effective for single-entity and straightforward multi-entity scenarios—is also what creates the consolidation feature boundary. Organizations that acknowledge and plan for that boundary find BC delivers real value; those that don’t often end up paying for a consolidation layer they didn’t budget for, installed alongside BC rather than within it.


Hashtags: #BusinessCentralConsolidation #MultiCompanyFinance #ConsolidationStrategy #FinanceOperations #ImplementationPlanning #CorporateFinance #AccountingAutomation

Managing AI Builder Confidence Scores in Production: When Automation Accuracy Isn’t Good Enough

Finance dashboard with AI prediction confidence scores

A finance manager runs invoice processing through an AI Builder model trained to extract vendor, amount, and GL account from scanned receipts. The model reaches 94 percent accuracy in testing. On day one of production, it auto-posts a $50,000 invoice with the wrong GL account, costing two hours of detective work to fix. By day three, five more misclassifications land in the general ledger. The automation is disabled, invoices return to manual entry, and the project sponsor asks why the “accurate” model is still making costly mistakes.

The gap between testing accuracy and production safety isn’t a technology failure. It is a failure to account for what an accuracy metric actually tells you. An AI Builder model reporting 94 percent accuracy means one in roughly seventeen predictions will be wrong. In a finance system processing hundreds of transactions daily, “one in seventeen” is not acceptable for automated posting without human review. The difference between “generally accurate” and “safe to automate without oversight” requires a different measurement: confidence scoring and an intelligent routing system that uses it.

AI Builder provides confidence scores for most prediction tasks, but using them effectively means understanding what they measure, when to trust them, and how to handle predictions the model makes with low confidence. This is not a checkbox feature; it is the foundation for building automation that decision-makers can actually rely on.

What Confidence Scores Actually Measure

AI Builder returns a confidence value between zero and one for each prediction, representing the model’s statistical certainty about that specific output. This is not accuracy. Accuracy measures model performance across the entire test dataset. Confidence measures the model’s internal uncertainty about a single prediction.

A confidence score of 0.95 does not mean “95 percent likely to be correct.” It means the model’s learned patterns suggest this particular prediction is reliable according to its internal probability distribution. In practice, a prediction with confidence 0.95 is more likely to be correct than one with confidence 0.70, but the exact correlation between confidence and correctness depends on the specific model, the data it was trained on, and how representative production data is compared to training data.

This distinction matters because it changes how you use confidence as a decision signal. If you treat 0.95 as “definitely correct,” you will deploy the same ratio of errors as the model’s test accuracy (roughly one in seventeen). If you treat 0.95 as “probably correct compared to 0.70, but still worth a second look,” you can build a routing system that catches most of the risky predictions before they enter your core system.

Setting Confidence Thresholds

The first production decision is where to draw the threshold. Below a certain confidence value, the prediction goes to human review. Above it, the prediction enters automated processing. This threshold is not universal; it depends on the cost of a wrong decision, the volume of predictions, and the effort required for human review.

For invoice GL account classification, assume the model produces 200 invoices weekly. A wrong classification triggers a reconciliation loop and audit trail entry. The cost of each error includes accounting time, potential audit complexity, and systems rework. In this scenario, a threshold of 0.85 might be reasonable: predictions below 0.85 (roughly 10 percent to 15 percent of volume) go to a human queue for quick spot-check. Predictions above 0.85 (85 percent to 90 percent of volume) post automatically.

The threshold should shift based on downstream impact. For automated categorization of customer service tickets routed to a bot, a lower threshold (0.70 or 0.75) is acceptable because the cost of a misrouting is low and the human agent catches it immediately. For automated loan denial decisions, a much higher threshold (0.95 or 0.98) makes sense, even if it means a larger manual review queue, because the business and compliance cost of an incorrect decision is high.

Setting the threshold requires pilot data. Before full production, run the model on a representative sample of recent work and examine the distribution of confidence scores and their relationship to correctness. Plot confidence against error rate. Often you will find that confidence correlates imperfectly with accuracy, and you can identify a sensible threshold that balances automation volume and error risk.

Building Confidence-Aware Routing

AI Builder rarely runs in isolation. The typical pattern is: AI Builder predicts, Power Automate routes based on the prediction and its confidence score, and either a downstream system consumes the result or a human queue surfaces it for review.

In Power Automate, fetch the confidence value from the AI Builder action result. Most AI Builder prediction actions return not just the predicted value but also a confidence value. Check your specific model’s return schema; the confidence field might be named confidence, confidence_score, or included in a nested object depending on the prediction type. Extract it and pass it to a branching decision.

Workflow diagram showing confidence-based AI prediction routing

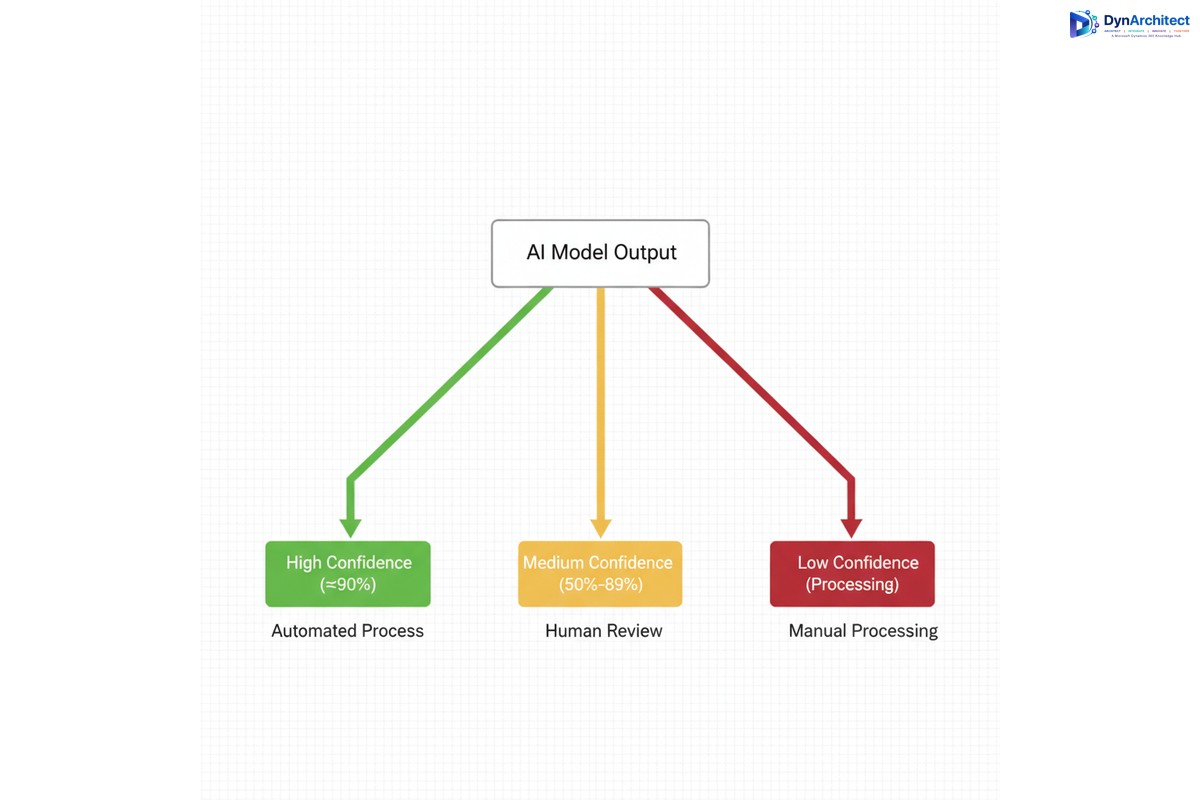
A three-branch routing pattern works well. If confidence is above the high threshold (0.90), route to automatic processing. If confidence is between thresholds (0.70 to 0.90), route to a human review queue with the prediction pre-populated and confidence displayed so the reviewer knows the model’s own uncertainty level. If confidence is below the low threshold (0.70), surface it as a flag case requiring full manual processing without the model’s suggestion, since a very low confidence prediction adds noise rather than help.

Within the human review queue, confidence becomes a sorting signal. Cases with confidence 0.88 should be reviewed before cases with confidence 0.72. The reviewer can quickly spot-check high-confidence cases and will catch more errors per hour on the lower-confidence cases that truly need scrutiny.

Handling Distribution Shift

Confidence scoring works well when production data matches the data the model was trained on. It breaks down when production introduces new patterns, edge cases, or systematic differences. A model trained on 2024 invoices will assign lower confidence to invoices with a new vendor format, or with line items in a currency not present in training data. A model trained on US customer data will assign lower confidence to customers from a region poorly represented in training.

This phenomenon is called distribution shift. When it occurs, confidence scores become less predictive of correctness. A prediction with confidence 0.85 that would normally be correct 85 percent of the time might only be correct 70 percent of the time if production data has drifted significantly.

Monitoring for distribution shift requires tracking two things: the overall distribution of confidence scores week to week, and the error rate within each confidence band. If the average confidence drops from 0.82 to 0.74 over a month, suspect distribution shift. If errors within the 0.80 to 0.90 band spike from two percent to eight percent, confirm it.

When distribution shift is detected, retrain the model on recent production data, or apply transfer learning to adapt the existing model to the new patterns. This is not a one-time task; models decay over time, and quarterly retraining cycles are standard practice for models in production.

Audit, Compliance, and Decision Logging

Finance and compliance teams require a complete audit trail for every automated decision. Confidence scores are part of that trail. For each automated transaction, log not just the decision and the predicted value, but also the confidence score at the time the decision was made. If the transaction is later questioned, an audit shows both what the model predicted and how confident it was.

In many organizations, automated decisions below a regulatory threshold (perhaps any transaction over a certain amount, or any customer marked for special review) automatically escalate to a human approval step regardless of confidence. This is appropriate. Automation should accelerate routine decisions, not replace governance.

Document your confidence thresholds as part of your automation governance. Record the date the threshold was set, the reasoning behind it, and any changes. If an error occurs, this documentation becomes part of the root cause analysis. It demonstrates that the automation was designed with business intent, not implemented carelessly.

Monitoring and Iterative Improvement

After the first month of production, analyze the correlation between confidence and actual outcome. If predictions with confidence above 0.85 are wrong just two percent of the time while predictions with confidence 0.70 to 0.85 are wrong thirty percent of the time, your threshold is well-calibrated. If predictions above 0.85 are wrong ten percent of the time, your threshold is too aggressive and you need to raise it to 0.92 or 0.95.

Set up dashboards that track confidence distribution, error rates by confidence band, and the volume of cases routed to each path. Alert if the error rate in the automated path exceeds a threshold (perhaps 5 percent). Alert if average confidence trends downward, signaling model decay.

Use this monitoring data to refine your model quarterly. Collect the cases that were routed to human review, particularly those where the human disagreed with the model prediction. Use disagreement cases as negative examples to retrain the model, improving its calibration.

Conclusion

Confidence scoring transforms AI Builder from a tool that makes predictions to a tool that makes predictions and quantifies its own uncertainty. Using confidence well means treating it not as a precision guarantee but as a sorting mechanism that reduces risk by routing uncertain predictions to humans who can make the final call. This shifts the conversation from “is this model accurate enough?” to “how do we use this model’s accuracy in a system that cannot tolerate errors?” The second question is the one that actually gets projects to production and keeps them there without creating extra work downstream. Routeget Technologies helps organizations build exactly this kind of safeguarded automation, where AI is an accelerant for human decision-making, not a replacement for accountability.


#AIBuilderConfidence #AIAutomation #FinanceAutomation #AIMLModeling #DynamicsAI

Dataverse Conditional Access & MFA: Enterprise Auth Strategy Without Breaking Power Platform

You’ve mandated that your organization must enforce conditional access policies and multi-factor authentication across all cloud services. It’s the right call from a security standpoint. Your CISO is demanding it, your compliance framework requires it, and your risk assessment puts it at the top of the priority list.

But then you hit the wall: conditional access policies that work perfectly for Microsoft 365 web applications cause Power Platform apps to stop authenticating altogether. Users can no longer access the Power Apps that run critical business processes. Your integration flows in Power Automate start failing because they’re hitting MFA challenges mid-workflow. The Dataverse API connections that your Line of Business applications depend on suddenly require interactive authentication that isn’t available in batch processing scenarios.

The tension isn’t theoretical. It’s real, it’s urgent, and it forces you to choose between security governance and operational continuity. Most organizations resolve this tension by weakening their conditional access policies, carving out exceptions for Power Platform, or exempting service accounts from MFA entirely. All of those choices push you further from true security maturity.

There’s a better path, but it requires understanding how Dataverse, Conditional Access, and the Power Platform authentication layer actually interact.

Why Standard Conditional Access Policies Break Power Platform

Conditional Access is a powerful feature in Azure AD. It evaluates device compliance, sign-in risk, geographic location, and dozens of other signals before granting authentication tokens. When you create a policy that requires MFA for all cloud apps, or limits access to corporate-managed devices, you’re making a sound security decision.

The problem: Power Platform applications don’t authenticate the same way that Outlook or SharePoint do.

When a user opens Power Apps in a browser, they’re presented with an interactive login page. That interface can handle MFA prompts, device compliance checks, and the full conditional access flow. So far, so good. But many organizations use Power Apps in ways that don’t involve a browser:

  • Mobile apps built on Power Apps don’t always gracefully handle MFA challenges in the middle of a user session.
  • Service accounts that run cloud flows in Power Automate are trying to authenticate without user interaction, which violates the interactive requirement of most conditional access policies.
  • Custom applications that use the Dataverse Web API through a service principal must request tokens in a non-interactive context. If your conditional access policy requires MFA or device compliance checks, the token request fails.
  • Integration scenarios where your on-premises LOB application authenticates directly to Dataverse hit the same wall.

The Dataverse API itself doesn’t block these scenarios. Azure AD’s conditional access policies do. The authentication platform is saying, “I need interactive user presence to validate MFA,” but the application doesn’t have a way to provide it.

The Real Cost of Over-Exempting Service Accounts

When token requests fail, the most common workaround is to exempt service accounts from conditional access policies. If you carve out an exclusion for all accounts in a particular group, those accounts no longer need to satisfy MFA requirements, even though their access might be just as sensitive as any human user’s.

This creates a security problem that goes deeper than it first appears:

First, service accounts become targets. If a threat actor gains access to a service account password, they have a golden ticket to your Dataverse environment without triggering MFA challenges. They can run integration flows, extract data, or modify records in batch operations that are harder to detect than interactive user activity.

Second, the exemption tends to expand over time. One service account becomes two. Two becomes five. Then you’re exempting entire groups. The exception becomes the rule, and your conditional access policy devolves into a symbolic gesture rather than a functioning security control.

Third, you lose the audit trail. When a service account isn’t subject to conditional access policies, you don’t get the same visibility into what it’s doing. Azure AD doesn’t log conditional access evaluations for exempt accounts. Your security team can see that the account authenticated, but not whether it was accessing data from an expected location, or whether the request exhibited anomalous characteristics.

Implementing Conditional Access for Power Platform Without Breaking Applications

The solution requires thinking about service accounts, Power Apps clients, and Dataverse API access as three distinct authentication scenarios, each with different architectural requirements.

Scenario 1: Interactive Power Apps and Power Automate Usage

This is the easiest scenario to secure. When a user opens Power Apps or Power Automate in a browser, they’re in an interactive context. Standard conditional access policies apply directly. You can require MFA, enforce device compliance, and apply geographic restrictions without breaking the user experience.

The key is to ensure that your Power Apps environment is registered in Azure AD as a cloud application, and that conditional access policies explicitly include it. Many organizations assume that Power Apps are covered by broad policies that target “all cloud apps,” but Power Apps needs explicit mention in the policy scope.

For Power Automate, the situation is slightly different. Cloud flows that require user interaction can handle MFA. But the moment you implement a background cloud flow, you’re in a non-interactive context. Conditional access policies that require MFA will block the token request.

Scenario 2: Unattended Cloud Flows and Service Accounts

This is where most organizations struggle. A cloud flow that processes orders, sends notifications, or synchronizes data is running without a user present. It needs a way to authenticate to Dataverse without triggering an MFA challenge.

The recommended approach is to use a managed identity or a service principal with a certificate-based credential, combined with a conditional access policy that evaluates non-interactive sign-ins differently than interactive ones. Instead of requiring MFA for all accounts, your policy should:

  • Require MFA for interactive sign-ins from all user accounts.
  • Skip MFA for service accounts or managed identities, but enforce stronger authentication (certificate-based credentials instead of passwords).
  • Apply additional controls to service accounts, such as restricting geographic locations or requiring authentication from specific networks.

The idea is that MFA is one control among many. If you compensate for the absence of MFA with other controls (certificate authentication, network restrictions, IP allowlisting), you maintain a strong security posture without blocking legitimate application access.

Scenario 3: Custom Applications and Direct Dataverse API Access

When a Line of Business application calls the Dataverse Web API directly, it’s requesting a token using application credentials. This is always a non-interactive flow. Conditional access policies that block non-interactive sign-ins will block this access.

Here’s where conditional access policies designed for interactive users start to feel restrictive. Your policy might say “Require MFA and a corporate device,” but neither condition can be evaluated for a non-interactive application. You’re forced to choose between blocking the integration or exempting the service account.

The better solution is to use a service principal with certificate-based authentication, combined with conditional access policies that allow certificate-authenticated service accounts to authenticate without MFA, but apply other compensating controls: network-based restrictions, role-based access control, and comprehensive audit logging.

Designing the Authentication Flow

Here’s how to architect this at the enterprise level:

Step 1: Segment Your Conditional Access Policies by Sign-In Type

Create two distinct conditional access policies: one for interactive sign-ins and one for non-interactive sign-ins. The interactive policy can be strict (require MFA, device compliance, geographic restrictions). The non-interactive policy should be more lenient on the authentication factor, but compensate with additional controls.

Step 2: Use Certificate-Based Credentials for Service Principals

Never use passwords for service accounts that need to authenticate to Dataverse. Certificates are more secure, easier to rotate, and compatible with conditional access policies that distinguish between interactive and non-interactive flows.

Step 3: Implement Network-Based Restrictions

Use conditional access policies to restrict service accounts based on network location. If your integration platform is running on premises, create a policy that allows your service principal to authenticate only from that server’s IP address. This adds a layer of security: even if credentials are compromised, the attacker can’t authenticate from an arbitrary location.

Step 4: Enable Comprehensive Logging and Monitoring

Enable Azure AD sign-in logs and audit logs. Monitor for sign-in failures, authentication attempts from unexpected locations, large batch operations, and privilege elevation. Use Azure Sentinel or a SIEM to correlate these signals and alert on anomalous activity.

Step 5: Test and Validate Before Enforcement

Before enforcing conditional access policies broadly, test them with your Power Platform applications, integrations, and service accounts. Use the conditional access policy’s report-only mode to see which authentication attempts would be blocked, then adjust policies to allow legitimate scenarios.

Implementation Challenges and How to Avoid Them

Challenge 1: Power Apps and Power Automate Have Different Requirements

Power Apps desktop application, mobile apps, and cloud flows each have slightly different authentication behavior. Test each scenario in your environment.

Challenge 2: Certificate Rotation Is Easy to Forget

Service principals with certificate-based credentials need regular rotation, typically every 1 to 2 years. Implement automated certificate rotation using Azure Automation or App Service certificate management.

Challenge 3: Conditional Access Policies Interact With Each Other

If you have multiple policies, they’re all evaluated. A token request must satisfy all applicable policies. Regularly review your policy set and consolidate where possible.

The Path to Zero Trust

Implementing conditional access and MFA for Power Platform and Dataverse is a step toward Zero Trust security architecture. Instead of trusting an account because it has MFA enabled, you trust accounts based on multiple signals: device state, location, authentication method, audit trail, and runtime behavior.

For Dataverse environments that handle sensitive data or run mission-critical processes, this level of security maturity is essential. The key is to design your authentication architecture around your actual use cases, not around a generic policy that exempts half your accounts.

Your CISO wants to see conditional access and MFA enforced. Your application owners need Power Platform and integrations to work reliably. These goals aren’t in conflict if you architect the authentication layer thoughtfully.