Business Central Inventory Valuation Methods: Why FIFO, LIFO, and Weighted Average Choices Reshape Working Capital and Tax Liability

Business Central inventory costing methods FIFO vs LIFO comparison

When most finance teams implement Business Central, inventory costing defaults to FIFO. It’s the system default, it feels familiar, and no one on the implementation team flags it as a strategic decision. Then, 18 months into production, the conversation happens in the CFO’s office: your inventory balance sheet valuation has drifted significantly from what your tax accountant expected, your working capital metrics look different than they did under your legacy system, and your auditors are asking uncomfortable questions about whether the method you’re using actually aligns with your declared accounting policy.

This scenario repeats across organizations that underestimate the costing method decision as a finance strategy choice rather than a technical configuration. The truth is that your selection of FIFO, LIFO, weighted average, standard, or specific costing in Business Central ripples through your financial statements, your tax position, your working capital calculation, and your audit trail in ways that matter far more than most implementation teams realize.

## Why the Costing Method Choice Actually Matters to the Bottom Line

Business Central’s inventory costing method determines which purchase prices flow into your cost of goods sold and which prices remain sitting in inventory on your balance sheet. This distinction seems technical, but the financial impact is substantial. When prices rise, different costing methods produce radically different results: one method increases your reported profits and tax liability, another decreases both, and a third lands somewhere in between. The method you choose today locks in a path for your working capital metrics, your borrowing capacity, and your tax strategy for years to come.

Beyond the numbers, the costing method choice also determines how flexibly you can adjust costs after posting, whether you can back-date transactions without recalculating everything downstream, and how much discipline you need from your inventory and purchasing teams to keep the GL in sync with your ledger. Some methods are forgiving when you discover a $5,000 invoice weeks after posting; others force you to recalculate thousands of ledger entries and reconcile your entire inventory GL account.

## FIFO: The Default That Often Feels Wrong Under Inflation

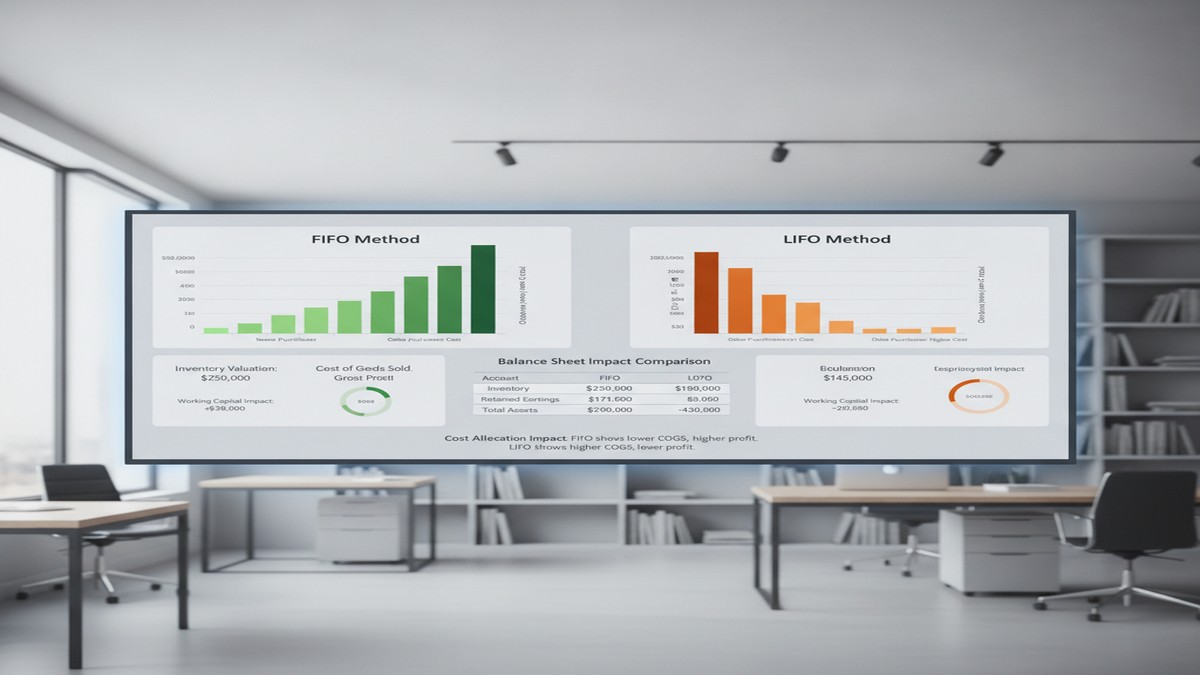
First-In, First-Out assumes that the oldest items purchased are the first ones sold. When prices are stable or declining, FIFO produces intuitive results. When prices rise, FIFO increases your reported inventory value and profits, which sounds good until tax day arrives and your tax liability rises with it. In an inflationary environment, FIFO inflates your balance sheet. Your inventory looks more valuable, which helps you approach lenders and improves your current ratio. Your cost of goods sold stays lower, making gross margins look better. But your reported profit grows, and so does your tax bill.

FIFO is also straightforward to reconcile. Business Central tracks which purchase transactions were consumed in which sales, so tracing cost flows back to specific purchase invoices is relatively transparent. If you discover a cost error in a purchase invoice, you can correct it without triggering a cascade of recalculations across the entire inventory GL. These operational benefits make FIFO the path of least resistance for many finance teams.

The constraint worth noting: once you set an item to FIFO in Business Central, you cannot change to a different costing method if any ledger entries exist for that item. This lock-in effect means your initial FIFO choice is likely permanent for years, even if business conditions shift.

## LIFO: The Tax Advantage with Regulatory Complications

Last-In, First-Out assumes that the most recently purchased items are sold first, which produces the opposite financial effect of FIFO. In an inflationary environment, LIFO decreases your reported profits and tax liability, which is why LIFO became popular during high-inflation eras as a way to reduce tax burden. Your cost of goods sold rises faster, your gross margin shrinks on paper, and your reported profit falls, which lowers your tax bill.

The catch is significant: LIFO is disallowed in many countries and regions outside the United States. If your organization operates internationally or plans to expand outside the US, LIFO creates compliance complications and audit friction. Some jurisdictions view LIFO as a method that artificially depresses profit, and regulators restrict or disallow its use entirely. For this reason, LIFO is increasingly rare in global organizations, even though it retains tax appeal in the US market.

## Weighted Average: The Middle Ground for Volatile Costs

Weighted average costing calculates a single average unit cost at a defined interval (daily, weekly, monthly, quarterly, or per accounting period). Every item consumed during that period uses the same average cost. This method produces results that fall between FIFO and LIFO, making it a reasonable choice when your product costs are volatile or you have mixed, homogeneous inventory such as chemicals, raw materials, or commodities where tracing individual purchase costs to specific sales is impractical.

The operational trade-off with weighted average is important: if you back-date a transaction, Business Central must recalculate all affected ledger entries and inventory GL entries within that averaging period. A single invoice correction that appears weeks after posting can trigger a recalculation wave that touches hundreds of inventory transactions. This recalculation risk makes weighted average less attractive in environments where posting errors surface late or where regular transaction corrections are common.

## The Real Decision Framework: What Finance Leaders Should Actually Evaluate

Selecting your costing method should be driven by three distinct questions, not by which method your legacy system used or which option appears first in the setup wizard.

First, what is your product cost environment? If product costs are stable or predictable, FIFO is operationally clean. If your costs are volatile and inventory is homogeneous, weighted average is more defensible. For highly valued, easily identifiable items, specific costing gives you exact cost tracking.

Second, what is your tax and financial reporting strategy? If you want to minimize tax liability in an inflationary environment, LIFO appeals. If you want to maximize reported profits and borrowing capacity, FIFO serves that goal. If you want a neutral middle ground that doesn’t swing too far either direction, weighted average is stable. This decision is not a technical question; it is a finance strategy question that should involve your tax accountant and CFO.

Third, what are your regulatory and audit constraints? If you operate globally, LIFO creates complications. If your auditors have strong opinions about industry-standard methods, align with those expectations upfront. If your working capital and cash flow metrics are tightly monitored by lenders, verify that your costing method choice aligns with debt covenant calculations.

Once these three questions are answered, the technical choice becomes clear.

## Common Mistakes That Surface After Cutover

Finance teams frequently discover problems with their costing method choice only after cutover has been running for months. One common mistake is defaulting to FIFO because the implementation team knew no better, then realizing too late that your tax strategy would have favored weighted average or that your auditor expected a different method. Another frequent issue is underestimating the back-dating problem with weighted average, only to discover months later that regular cost corrections trigger massive recalculation waves that destabilize your GL.

A third mistake is failing to ensure that your Dynamics purchasing and inventory teams understand the costing method you selected. If your team does not know that you have chosen LIFO, for example, they may manage inventory in a way that contradicts LIFO’s assumptions, making your GL reconciliation substantially harder and your audit trail less defensible.

## Resetting the Choice Requires Planning

If you discover six months after cutover that you selected the wrong costing method, reversing the decision is expensive and disruptive. The technical constraint is absolute: you cannot change an item’s costing method if ledger entries exist. Resetting requires either creating new item numbers and migrating open inventory to those new items, or conducting a full inventory revaluation and GL restatement. Both paths are operationally messy and often require auditor involvement to ensure the transition is defensible.

For this reason, getting the choice right upfront is worth the investment of time and expert input before cutover.

## The Real Impact: Working Capital and Strategic Positioning

The costing method you choose in Business Central is not a technical detail to delegate to the implementation team; it is a financial strategy decision that affects your reported working capital, your tax position, and your balance sheet strength for years to come. FIFO inflates your inventory value and profits during inflation, making your balance sheet look stronger to lenders but increasing your tax bill. Weighted average cushions you against cost volatility but exposes you to recalculation risk. LIFO minimizes taxes but creates regulatory complications.

Organizations that treat the costing method choice as a strategic decision, led by their CFO and tax accountant rather than by the technical implementation team, avoid costly reversals after cutover and build a Business Central GL that supports their actual financial and tax strategy. Routeget Technologies helps finance and operations teams make this strategic choice before implementation, ensuring that your Business Central configuration aligns with your working capital goals and tax objectives from day one.

The choice you make now will shape your financial statements for years. Make it deliberately.

—

#BusinessCentralInventory #InventoryCosting #WorkingCapital #BusinessCentralFinance #FIFOvLIFO #CFOStrategy #DynamicsFinanceOps #FinancialAccounting #CostAccounting #BusinessCentralCore

Finance team analyzing Business Central inventory valuation in office

About Routeget Technologies: Routeget Technologies is a Microsoft Dynamics consulting firm helping enterprise and mid-market organizations implement, optimize, and extend their Microsoft technology investments. Our teams combine deep technical expertise with business advisory experience to deliver implementations that drive operational efficiency and financial impact.


Real-Time Dashboard Design in Power BI: When Live Connections Hurt Performance and What to Use Instead

Many organizations treat “real-time reporting” as a checkbox requirement rather than a technical decision. A director asks for a dashboard showing “live data” without specifying what live actually means, and teams immediately configure Direct Query connections to Dynamics 365 databases. Six months into production, those dashboards crawl under concurrent user load, and the director’s dashboard times out during CFO presentations.

The problem isn’t live data itself. It’s that live data in Power BI comes in distinct flavors, each with different performance trade-offs, and choosing the wrong flavor destroys performance at scale. This article shows which real-time architecture fits which scenario, and when you’re better off abandoning the real-time requirement altogether.

Power BI Import Mode vs Direct Query performance comparison dashboard

Understanding the Real-Time Spectrum

First, clarify what “real-time” means in your context. Most organizations conflate three different concepts: data freshness (how old is the data?), query latency (how fast does a dashboard query execute?), and update frequency (how often is new data available?). These are not the same.

A dashboard showing data refreshed every 15 minutes queries a cached aggregate table with instant response times. Alternatively, a dashboard querying a live Dynamics 365 database via Direct Query has zero latency from the database, but if 20 people open the dashboard simultaneously, queries become serialized and latency skyrockets. The “real-time” label obscures the actual performance characteristics.

Start by asking: How old can data be before a decision changes? A sales dashboard 10 minutes stale versus current-to-the-second rarely affects sales decisions. A finance dashboard showing expense reports can be 4 hours stale. A customer service dashboard showing ticket volume can be 30 minutes stale. Only a handful of use cases actually require sub-minute freshness.

Once you’ve anchored the actual freshness requirement, choosing an architecture becomes simpler.

Direct Query and Its Hidden Costs

Direct Query sends every user interaction as a live database query. No caching, no aggregation, just immediate translation of dashboard filters into T-SQL. On paper, this sounds ideal: always current, no data warehouse, minimal complexity.

In practice, Direct Query introduces three performance traps.

First, concurrent users crush database performance. When ten analysts open a Power BI dashboard simultaneously, Direct Query generates ten database queries in parallel. Add 15 more analysts, and suddenly transaction processing slows because the database is saturated with analytical queries. Power BI’s server-side caching helps only for identical queries. If each analyst filters by a different region, caching provides no benefit. You end up purchasing database resources purely for analytical load.

Second, complex calculations become prohibitively expensive. Direct Query works best for simple filtering and aggregation. The moment you need running totals, customer rankings, or month-over-month comparisons, you’re pushing calculations to the database or computing them in Power BI’s layer, both adding latency or complexity.

Most Dynamics 365 finance dashboards need these calculations. A cash flow dashboard ranking open invoices by days overdue, or a revenue dashboard showing year-to-date totals by region and product, requires a data warehouse layer or pre-computed calculations. With Direct Query, you can’t pre-compute anything because data always changes.

Third, network latency compounds with every filter. Each dashboard interaction triggers a new database query and network round-trip. In a data warehouse scenario, filtering might take microseconds (querying an in-memory cache). With Direct Query, it’s network latency plus database query time, often 2-5 seconds per interaction. A dashboard requiring five clicks to drill into detail takes 25+ seconds if each click pauses for network response. Users notice immediately.

Power BI analyst working with dashboards in modern office environment

Import Mode with Scheduled Refresh: The Workhorse

Import mode loads data into Power BI’s in-memory model, which you refresh on a schedule. For most enterprise dashboards, this is correct.

A finance dashboard might refresh every 4 hours. A sales dashboard every 30 minutes. A customer service dashboard every 15 minutes. Those intervals sound stale, but usually align with actual business decision cycles. A finance controller doesn’t make working capital decisions every 15 minutes; 4-hour refresh is sufficient. A sales manager checks pipeline daily, not per minute; hourly refresh is adequate.

Import mode’s advantage is simplicity at scale. Load data once, then serve the cached model to hundreds of concurrent users with zero database load. Your Dynamics 365 database doesn’t know dashboards exist. Add 50 new dashboard users tomorrow without anyone noticing performance change.

The model also compresses dramatically. A Dynamics 365 Finance general ledger with 50 million line items might compress to 500 megabytes in Power BI. A Direct Query approach queries the full 50 million rows every time a user opens a dashboard; an Import model loads once and serves fast queries.

Within Import mode, you gain access to calculated columns, measures, and DAX for sophisticated analytics. Calculate running totals, percentile rankings, trend lines, and complex financial metrics without touching the source database.

The trade-off is data freshness. If refresh happens every 4 hours and a user opens a dashboard at 3:59 AM, they see data from midnight. For operational dashboards needing sub-hourly updates, this becomes a problem. For strategic dashboards, it’s almost never an issue.

Hybrid and Push Approaches for Selective Real-Time

When some dashboard components need near-live data and others can be stale, hybrid approaches split the difference. A sales pipeline dashboard might import historical pipeline data (which changes slowly) but stream real-time opportunity counts from an API endpoint. These work only when you cleanly separate stale and live components.

Push Datasets allow you to stream data into Power BI in real-time, bypassing the database. A Dynamics 365 Finance workflow or custom service pushes event data (new orders, posted invoices, received payments) directly to Power BI as it happens. This is genuinely real-time and scales well because pushing is asynchronous.

Push Datasets make sense for operational dashboards tracking events: a manufacturing floor dashboard showing production events, an order-processing dashboard tracking fulfillment, or customer service dashboards displaying incoming tickets. They don’t work for analytical dashboards computing aggregates across historical data.

Choosing the Right Architecture

Start with business need, not technology.

For dashboards where data can be 4+ hours stale (finance reporting, executive dashboards, strategic analytics), use Import mode with nightly or 4-hour refresh. Build sophisticated DAX calculations. Serve unlimited concurrent users. This is your default.

For dashboards where data must be no more than 30-60 minutes stale (sales dashboards, customer service metrics, supply chain), use Import mode with more frequent refresh. Most dashboards fall here.

For operational dashboards tracking events (manufacturing, fulfillment, incident response), use Push Datasets if you can instrument the source system, or Dataflow with 5-10 minute refresh if you can’t.

For the rare sub-minute freshness requirement, use Direct Query, but explicitly cost the decision: calculate additional database licenses and query load needed. When directors hear “real-time reporting costs an additional 500k in database infrastructure,” cost-benefit calculations usually change.

Common Mistakes

Don’t design for yesterday’s requirements. Dashboards created for three analysts often serve 50 within a year. Design with Import mode and you’re prepared for scale.

Don’t confuse data freshness with query performance. A 4-hour-old dataset queried instantly feels faster than live data queried in 5 seconds.

Don’t use Direct Query because documentation says it’s for “live data.” Use it only after consciously calculating database costs.

The path forward is simple: pick the slowest freshness requirement you can justify, then design using Import mode. Scale up refresh frequency only if performance and business case demand it. Most organizations that follow this pattern end up with fast, stable dashboards and minimal infrastructure cost.

About Routeget Technologies: Routeget specializes in enterprise analytics and reporting architecture for Microsoft Dynamics 365 and Power BI implementations. Our consulting team helps organizations design dashboard strategies that balance business requirements with infrastructure costs, ensuring analytics scale with your organization without creating database performance bottlenecks.

#PowerBIDashboard #PowerBIPerformance #DataVisualization #RealTimeDashboards #PowerBIDirectQuery #PowerBIArchitecture #DataAnalytics

Cash Flow Forecasting in Dynamics 365 Finance: Why AI Predictions Still Miss Working Capital Reality

Cash flow forecasting dashboard showing projected vs actual data with KPI metrics

Most finance teams have spent years building cash flow forecasts in Excel, stitching together data from bank statements, accounts payable systems, and revenue pipelines into spreadsheets that someone updates manually every month. The work is repetitive, the data silos make it unreliable, and by the time the forecast is finished, half of it is already stale. Dynamics 365 Finance Insights offers an escape from that trap through AI-driven cash flow forecasting that learns from historical cash patterns and generates long-term projections automatically. The pitch is compelling: machines eliminate the tedium, surface patterns humans miss, and free finance teams to focus on strategy instead of spreadsheet mechanics.

But there is a critical gap between what the AI model can do and what finance teams actually need it to do. AI-driven cash flow forecasts excel at identifying mathematical patterns in historical data, yet they struggle with the qualitative, forward-looking factors that actually drive cash flow reality: planned capital investments that haven’t yet hit the books, seasonal customer payment behavior changes, supply chain disruptions that will compress inventory holding periods, or a merger that restructures the entire customer base. A finance controller or CFO who relies solely on the AI forecast without layering in business judgment will often walk into a liquidity surprise.

The real value of Dynamics 365 Finance Insights cash flow forecasting is not replacing human judgment but augmenting it. When finance teams use the AI forecast as a starting point and then overlay business context, decision-making velocity accelerates and accuracy improves dramatically. Getting this right requires understanding what the model can and cannot see, knowing when to trust the forecast and when to override it, and building the right governance layer to validate forecasts before they drive working capital decisions.

The Limits of Pattern Recognition in a Complex Cash Cycle

AI models underlying cash flow forecasting in Dynamics 365 Finance are fundamentally pattern-recognition engines. They ingest historical cash inflows and outflows from your bank accounts, accounts receivable aging, accounts payable schedules, and payroll cycles, then use time-series forecasting to extrapolate what comes next. If your company has ten years of data showing that December customer collections spike by 35 percent and February payment to suppliers compresses payables by 20 days, the model will capture those patterns and encode them into future projections. This works well for recurring, predictable dynamics.

What the model cannot see is anything outside its training window that will reshape cash behavior going forward. If your company just signed a contract to pay a major vendor upfront instead of on net-60 terms, the model knows nothing about it until that transaction flows through the bank. If you are planning to divest a business unit, the cash flow impact of losing that customer’s collections will not appear in the forecast until after the divestment occurs. If a customer base mix shift is underway (moving from long-tail small customers to a few large enterprise accounts), payment velocity and working capital requirements will change, but the model is still extrapolating patterns from a customer composition that no longer matches reality.

These are not failures of the AI model. They are inherent constraints on what backward-looking pattern recognition can accomplish in a forward-looking world. A CFO charting course for a 24-month cash position that blindly follows the AI forecast without accounting for known strategic changes is making a decision on stale information, regardless of how sophisticated the underlying algorithm is.

Cash flow forecasting dashboard showing projected vs actual data with KPI metrics

Where AI Forecasts Add Immediate Value

The practical value of Dynamics 365 Finance Insights cash flow forecasting becomes clear when you deploy it specifically for what it does well: automating the baseline forecast that captures recurring cash patterns. Instead of a finance controller manually updating a spreadsheet with assumptions about seasonal collections patterns, payroll cycles, and vendor payment terms, the AI model learns these patterns and generates updated projections whenever new transactional data arrives. The baseline becomes self-updating, and the finance team shifts focus from mechanical forecasting to exception-based analysis.

Dynamics 365 Finance Insights also surfaces forecast accuracy metrics, showing finance teams how well the model predicted actual cash outcomes over trailing periods. This feedback loop is valuable, because it reveals whether patterns the model identified have remained stable or have shifted. If the model historically predicted collections within plus-or-minus 3 percent but suddenly starts missing by 8 percent, that is a signal that underlying customer payment behavior has changed and warrants investigation.

What-if scenario analysis is another capability that multiplies the value of AI-driven forecasting. Once the baseline forecast is in place, finance teams can create alternate scenarios representing different business conditions (optimistic growth, pessimistic demand, recession response) and overlay them on top of the baseline. This capability let you rapidly explore how cash positions respond to different strategic choices without rebuilding the entire forecast from scratch.

The Three Scenarios Where AI Forecasts Lead Finance Teams Astray

Reliance on AI-only cash forecasting becomes problematic in specific, predictable scenarios that every finance team encounters:

Structural changes to cash flow drivers. When your business model shifts, historical patterns become unreliable. If you transition from on-premises software licensing (lump-sum collections upfront) to a subscription SaaS model (monthly recurring revenue spread over years), the AI model trained on your old licensing pattern will dramatically overforecast near-term collections. The model needs retraining on new data, but that can take months. In the interim, finance teams need human judgment to reframe the forecast against the new revenue model, or they will drastically overestimate liquidity.

One-time events with material cash impact. A large customer prepayment, a debt refinancing, an asset sale, a business combination, or an unexpected insurance recovery all create cash movements the model has no historical precedent for. These events typically require advance knowledge and business context to forecast. If a CFO knows a customer prepayment of $20 million is coming in Q2 but the AI model knows nothing about it, the combined view (baseline forecast plus known one-timers) is far more useful than either alone.

Seasonal and cyclical patterns that have shifted over time. AI models can capture long-term seasonal patterns, but if the magnitude or timing of seasonality has changed, the model can lag in detecting and adapting to that shift. A company that has historically seen strong Q4 collections might have shifted to a more consistent quarterly pattern due to customer base changes. The model will still expect a Q4 spike based on historical data, whereas a finance controller watching year-over-year trends will notice the pattern has evolved and adjust accordingly.

In all three scenarios, the disconnect is the same: the AI model is solving for accuracy on historical patterns, while finance teams are solving for visibility into forward cash positions shaped by strategy, one-off events, and changing market conditions. Neither is wrong. They are just operating on different time horizons and information sets.

Finance team reviewing cash flow forecasts and working capital data on dashboard systems

Building Governance Around AI Forecasts

The path to effective AI-driven cash flow forecasting in Dynamics 365 Finance is not to replace human judgment but to institutionalize how the two interact. This requires a lightweight governance framework that clarifies when the AI forecast is trusted as-is, when it needs overlay, and who is responsible for validating the forecast before it drives working capital decisions.

Start by establishing a forecast validation workflow that requires the finance controller or working capital manager to review and sign off on cash forecasts before they are used for liquidity planning or short-term borrowing decisions. This review should be structured and quick, not bureaucratic. The reviewer should check three things: Does the forecast direction match current business trends? Are known one-time cash events accounted for? Are there any recent structural changes to the business (pricing model shift, customer mix evolution, payment term changes) that the AI model would not yet have learned?

If the answers are yes, the AI forecast can proceed unchanged. If the answers are no, the review process should support rapid overlay of business context. Dynamics 365 Finance Insights allows finance teams to create scenario variants and what-if analyses that can quickly model known events or strategic changes on top of the baseline forecast. This is not rebuilding a forecast in Excel; it is using the system to layer business judgment on top of the AI baseline.

Over time, as the AI model learns from corrected forecasts and forecast validation patterns, the lag between model behavior and business reality should narrow. A finance team might discover that 80 percent of forecasts pass validation without change, while 20 percent require overlay of known one-timers or cyclical pattern adjustments. Documenting those patterns helps you identify where the model needs retraining or where business context should be automatically fed back into the forecasting process.

The Compound Effect of Forecast Discipline

Finance leaders often underestimate the leverage of accurate cash flow forecasting on decision-making velocity. If a CFO has high-confidence visibility into 24-month cash position, working capital decisions that would otherwise require contingency buffers can be optimized. Seasonal borrowing decisions become more predictable. Investment in accounts receivable improvement initiatives can be prioritized based on forecast impact. Strategic decisions about capital allocation, debt paydown, and dividend policies can be made with clearer information about future liquidity.

Conversely, a forecast that the CFO does not trust becomes either a shelf-ware artifact that no one uses, or worse, a forecast that is blindly followed and leads to strategic surprises. Many companies keep a spreadsheet forecast alongside their ERP forecast precisely because they do not trust the system forecast.

The investment in building governance discipline around AI-driven forecasting is usually small relative to its impact. A monthly 30-minute forecast review and validation workflow, combined with clear ownership for feeding business context back into the system, is enough to shift AI forecasts from mathematical curiosities to operational planning tools.

Making the Shift from Manual to Augmented Forecasting

The transition from Excel-based forecasting to AI-driven forecasting in Dynamics 365 Finance requires more than just enabling the feature. It requires reframing how finance teams think about forecasting: not as a document to be produced, but as an ongoing process that blends machine intelligence with human business judgment. The AI model generates the baseline, eliminating the mechanical work. Finance controllers validate and contextualize it, adding business judgment. Together, the two create a forecast that is both statistically grounded and strategically sound.

Organizations that make this transition successfully are usually those that treat the AI forecast as the starting point for a conversation, not the destination. They ask: Where does the forecast seem right, and where does business knowledge suggest it should be adjusted? What events on the horizon will reshape cash patterns that the model does not yet know about? How can we feed that business context back into the system to continuously improve forecast quality?

These questions shift forecasting from a cost center (people spending time in spreadsheets) to a strategic process (finance contributing to working capital optimization and capital allocation decisions). The shift is not automatic. It requires discipline, clear ownership, and a commitment to treating forecasts as living documents that evolve as business conditions change. But the payoff for finance organizations disciplined enough to make the shift is significant: better visibility, faster decision-making, and working capital strategies grounded in both mathematical rigor and business reality.

At Routeget Technologies, we help organizations build governance discipline around financial analytics and forecasting, ensuring that AI-driven insights inform rather than replace strategic decision-making. If you are implementing cash flow forecasting in Dynamics 365 Finance and want to ensure adoption and accuracy, our consulting team can help design the validation workflows and governance structure that turn machine forecasts into actionable business intelligence.

#DynamicsFinance #CashFlowForecasting #FinanceInsights #WorkingCapitalOptimization #CFOStrategy #FinancialPlanning #DynamicsF&O

Power Apps Business Alignment: When Custom Apps Get Built But Never Adopted

Your operations team just demoed a custom Power App to solve a recurring data-entry bottleneck. The app works technically. It’s deployed. Three months later, your finance team is still using the old spreadsheet-based process while the app sits idle.

This scenario repeats across hundreds of organizations building on the Power Platform. Power Apps makes it possible for business teams to build applications without professional developers, lowering the friction to create. But that low-friction building phase often masks a harder problem: getting the organization to actually use what gets built. The technology isn’t the constraint. The constraint is adoption, and most business decision-makers aren’t accounting for it when they greenlight Power Apps investments.

The challenge cuts both ways. CIOs and IT Directors approving Power Apps want to democratize application development and reduce dependency on professional development teams. Business leaders want faster solutions and quicker time-to-value. Power Apps delivers on those promises technically, but without clear ownership and user alignment from the start, projects that succeed in building often fail in landing.

The Two Adoption Failures Nobody Talks About

Most organizations that struggle with Power Apps adoption encounter one of two distinct failure modes, each rooted in different planning gaps.

The first failure is the misalignment project. A team builds a Power App to solve what they believe is a broadly understood problem, but the application’s workflows don’t match how the intended users actually work. A procurement team might design an approval-flow app optimized for the approval process as they understand it, but if field operators or managers submit requests in different ways depending on their context, the app creates extra friction instead of reducing it. The result: users abandon the app because working around it is faster than using it correctly. This isn’t a technical failure; the app functions as designed. It’s a design failure disguised as a user-adoption problem.

The second failure is the audience mismatch. A Power App gets built to serve a specific department or function, but the organization’s structure or priorities shift between when the project starts and when it launches. A regional operations app rolls out just as the company consolidates regions. A vendor-management app launches as procurement pivots to a new supplier strategy. The app was never designed for the new reality, and users inherit a tool that doesn’t match their actual needs. Again, adoption stalls because the tool doesn’t align with the current organizational context.

Both failures look the same from above: teams invest in building something, launch it, and watch adoption languish. But the root cause isn’t resistance to change or poor training; it’s a planning gap that existed before a single line of code was written. Business decision-makers sign off on Power Apps projects expecting fast iteration and rapid value, but many organizations treat the discovery and requirements phase as something to compress rather than something to do rigorously.

The Business Case for Upfront User Alignment

The power of Power Apps lies in its accessibility and speed of iteration. But that speed creates a hidden trap: it’s easy to start building without having actually nailed what you’re building or who will use it. Professional development teams can’t start building without requirements; users have to articulate what they need. Power Apps teams, by contrast, often start iterating with a looser sense of requirements, and the assumption is that feedback from users will shape the app as it grows.

That works if users are directly involved in the iteration cycle. It fails when the app is built inside a team and then handed to users for adoption without that collaborative refinement. The team that built it has ownership; the team that inherits it has skepticism.

The business decision-maker’s role is to enforce a prerequisite: before funding a Power App, clarify who will use it, how their day-to-day work will change, and whether those users are aligned on the change. This is not bureaucracy; this is preventing wasted investment.

Concretely, this means asking before the project starts:

Are the intended users aware this app is being built and involved in shaping it? If the answer is that an app is being built “for” a team rather than “with” a team, adoption risk is high. User involvement in requirements and design iteration is not optional; it’s a prerequisite for adoption.

Is the organizational context stable enough for this app to land? If the department is undergoing restructuring, if reporting lines are shifting, or if the function’s process is being redesigned separately from the app project, the app’s requirements are likely to change before it’s even finished. Aligning the app timeline with the organizational change timeline matters.

Does the app solve an actual pain point, or does it automate a process that’s working acceptably and just feels inefficient? The distinction matters for adoption. Users adopt apps that solve problems they feel acutely. They tolerate but don’t embrace apps that make acceptable processes slightly more efficient. If the value proposition is “this will save you a couple of hours per week,” adoption will be tepid. If it’s “this will eliminate a workflow that regularly delays your month-end close,” adoption will be stronger.

Are there informal workarounds or shadow IT systems already in place to solve this problem? If so, the app has to be meaningfully better than the existing solution, not just different. If a team has built a Access database that works for them, a Power App that does roughly the same thing won’t displace it just because it’s cloud-based or newer.

Governing Power Apps for Adoption, Not Just Speed

Business team collaborating on software design and user alignment

The shift from asking “Can we build this?” to “Will users actually use this?” requires a light governance layer that focuses on adoption rather than control. Most organizations approach Power Apps governance as a security and compliance exercise: which connectors are allowed, who can publish apps, what data can be accessed. Those questions matter, but they’re insufficient.

A business-focused governance approach adds a few adoption gates. Before a Power App is approved for organization-wide rollout or integration into critical processes, someone independent of the building team validates that users have been involved in design, that the app solves a felt pain point (not just an imagined one), and that the launch plan includes training and ongoing support. This sounds like bureaucracy, but done right it’s a 30-minute review conversation that prevents months of wasted effort from an app nobody will use.

The approver doesn’t need to be IT. An operations director, a functional manager, or someone from a Center of Excellence can conduct this review. The point is adding a voice that asks whether the app fits the users’ needs and context, not just whether the app is technically sound.

The Role of Ongoing Support in Sustaining Adoption

Building and launching an app is not the end of the adoption work; it’s the beginning. Yet many organizations treat the launch as a project end and shift resources away. A Power App that solves a pain point on day one needs to be refined as users work with it and discover edge cases. An app that isn’t updated or supported after launch will lose adoption as users encounter bugs, workarounds, or changes to the underlying process.

This isn’t an argument for endless feature building. It’s an argument for someone being accountable to users after the app is live: answering questions, capturing feedback, fixing bugs, and evolving the app as the business changes. If users submit a feature request and hear nothing for three months, they assume the app is abandoned and revert to the old way of working.

For business decision-makers, this means budgeting for post-launch support as part of the app investment, not as an afterthought. Whether that support comes from an in-house center of excellence, a dedicated team member, or a consulting partner, the accountability has to be clear.

A Realistic Path Forward

The organizations that succeed with Power Apps are not faster at building; they’re more deliberate about alignment before building and more committed to adoption after launch. They involve users from the start, validate that the app solves a real problem, ensure the organizational context is stable enough for the change, and commit resources to ongoing support.

This might feel like it slows down the promise of rapid low-code development. In a sense, it does. But it also prevents the false speed of building something nobody uses. A Power App that launches faster but is adopted by 30 percent of the intended users has a lower return on investment than an app that takes slightly longer to launch but is adopted by 80 percent of users.

Routeget Technologies has seen this pattern repeatedly across organizations building on the Power Platform: technical execution is almost never the constraint. Adoption is. We work with business leaders and IT teams to ensure Power Apps initiatives align users, stakeholders, and support structures before projects start, so the apps that get built are the apps that actually land.

The question is not whether your organization can build custom Power Apps. Modern platforms make that democratization real. The question is whether you can build apps that users will actually adopt. That requires thinking beyond the build and into the governance and support that follow.

—

#PowerAppsBusiness #UserAdoption #PowerPlatformGovernance #BusinessAlignment #CustomApplications #DigitalTransformation #OperationalExcellence

Field-Level Security in Dataverse: Building Role-Based Permission Models That Scale

Dataverse field-level security and role-based access control dashboard

The Hidden Complexity of Dataverse Permission Models

Most Dataverse implementations begin with a straightforward role hierarchy: sales users get access to leads and opportunities, finance teams see accounts and invoices, support staff manage cases and contacts. But as your organization grows, the model breaks down. You accumulate teams with overlapping responsibilities, regions with different compliance requirements, and sensitive columns that only executives should see. The role count multiplies. Users end up in seven or eight roles just to get the right combination of privileges. Column-level security requests pile up with no clean way to grant access to one field without exposing others. This is where field-level security enters not as a bolt-on convenience, but as a structural necessity.

Understanding Dataverse Security Layers

Dataverse provides three distinct permission layers, and confusing their purposes is a common design mistake. Row-level security controls which records a user can view or modify. It operates at the record level and relies on ownership, team membership, or hierarchical queries over business unit relationships. Role-based privilege sets determine what actions a user can perform (create, read, update, delete, assign) and on which tables or attributes they can perform them. These are coarse-grained controls; a role grants update access to an entire table, not to specific columns within it. Field-level security fills the gap between these two layers. It restricts access to specific columns for users who hold particular security roles or field security profiles. A user might have full update access to an account record through their role privileges, but field-level security can prevent them from viewing or editing the account’s annual revenue or credit rating fields.

Understanding this hierarchy is crucial for design. Many organizations try to solve field-level problems by creating more roles or narrowing table privileges. The result is role bloat that becomes impossible to audit or maintain. Field-level security, by contrast, keeps the role structure lean while providing precise column-level control.

Designing Scalable Field-Level Security Profiles

The technical foundation of FLS in Dataverse is the field-level security profile. Each profile specifies which columns a user can read or write. Multiple profiles can be assigned to the same user, and they combine additively: if one profile grants read access to a column and another grants write access, the user can write. Profiles are assigned through user records, not through roles, which is a critical design distinction. A user’s role determines their overall table and action privileges. Their field-level security profiles refine that access to specific columns.

Effective field-level security design starts with an inventory of columns that require restricted access. Columns typically fall into tiers: public columns that everyone in the organization can see (account name, contact details), internal columns that only certain roles should access (cost structure, internal notes), and restricted columns that require executive-level or compliance-driven access (personal identifiers, audit flags, regulatory fields). Once you have this inventory, you design profiles that correspond to job functions or organizational units. Instead of a profile per user or role, create a smaller set of reusable profiles that can be applied broadly. For example, you might have a “Finance Manager” profile that grants access to cost and revenue columns, a “Support Specialist” profile that blocks access to pricing and margin data, and an “Executive” profile that includes all columns except those marked as not-for-distribution. Users then receive the profiles they need to do their jobs, often in combination.

Common Implementation Pitfalls and Performance Implications

Most field-level security failures stem from three mistakes. First, overpermissive profiles that grant access to columns without a clear business justification. A single broad profile defeats the purpose of FLS and creates audit risk. Second, inconsistently applied profiles: some users have field restrictions while others with similar roles do not, creating data access inconsistency that auditors and compliance teams discover during reviews. Third, forgetting that field-level security does not prevent access through APIs, mobile clients, or integrations. A user might be blocked from viewing a column in the web UI, but if your Power Automate flow or plug-in runs as that user, the flow can still read and modify the column. Restricting API-level access requires separate configuration in custom connectors and API permissions.

Performance implications are often overlooked. Field-level security adds overhead to queries, especially when many profiles are assigned to a user or when profiles access overlapping sets of columns on large tables. Microsoft’s telemetry shows measurable latency increases on tables with thousands of records and highly granular field-level security configurations. The impact is usually minor for interactive workloads but can become significant in batch operations or bulk imports. Test thoroughly with realistic data volumes before deploying complex FLS configurations to production.

Integration with Azure Active Directory and Role Mapping

In many organizations, field-level security profiles should map to Azure AD groups or job roles defined in your identity management system. If your organization maintains Azure AD groups for finance staff, support teams, and executives, you can automate field-level security profile assignment through Power Automate or Azure Logic Apps when users are provisioned or change roles. This prevents manual profile assignment from becoming a maintenance bottleneck. The automation also ensures that when a user moves to a different department, they gain access to the columns required for their new role and lose access to columns they no longer need.

Be cautious about assigning profiles in bulk based on role names. If an Azure AD group includes contractors or external partners in addition to full-time employees, those contractors inherit the field-level security profile along with everyone else. Audit your group memberships before automating profile assignment, and maintain a separate security group or naming convention for profiles that should apply only to internal staff.

Testing, Auditing, and Migration Strategies

Effective field-level security requires testing at both the feature level and the integration level. At the feature level, verify that users assigned to a profile cannot query, read, or update restricted columns, either through the UI or through API calls. Use test accounts assigned to each profile to validate access. At the integration level, test that your automated role mapping and profile assignment work correctly when users are added, removed, or moved between groups. A common failure point is assuming that removing a user from an Azure AD group automatically removes their field-level security profiles; depending on your automation, it may not. Build automated tests that validate both positive cases (users who should have access do) and negative cases (users who should not have access don’t).

Auditing field-level security requires capturing field access attempts, particularly for sensitive columns. Enable plug-in tracing for custom connectors and use built-in Power Platform security audit logs to review who accessed which columns and when. Tools like the Center of Excellence (CoE) starter kit include reports that surface inactive field-level security profiles, which can be candidates for removal.

If you are retrofitting field-level security into a mature system where users already have broad column access, plan a phased migration. Begin with read-only restrictions on the most sensitive columns: executives and finance staff can read certain fields, but no one can modify them outside of specific processes. Gradually restrict write access, and monitor user behavior to catch legitimate use cases that your initial FLS model did not account for. Communicate clearly with teams before restricting access so they understand the why and can flag business processes that would break under the new model.

Building for the Long Term

Field-level security in Dataverse is not a one-time implementation. As your organization evolves, columns that were once public may become sensitive, and sensitive columns may need broader access. Design your profiles to be maintainable: document which profiles are in use, which columns each profile restricts, and why those restrictions exist. Periodically review profiles against your current data governance policies and remove or consolidate profiles that have become redundant. Organizations that treat FLS as an afterthought find themselves managing dozens of overlapping profiles within a few years. Organizations that treat it as an intentional governance mechanism maintain clear, auditable permission models that survive organizational change.

DynArchitect helps organizations design and implement scalable enterprise technology solutions, including Dataverse governance, security architecture, and role-based access control strategies that grow with your business.

#DataverseSecurity #FieldLevelSecurity #DataverseGovernance #PowerPlatformSecurity #RoleBasedAccessControl #DataversePermissions #CloudArchitecture

Revenue Leakage in Dynamics 365 Sales: How Customer Insights Reveals the Customers and Deals Your Sales Team Is Overlooking

Sales analytics dashboard showing customer data, revenue trends, and risk indicators

Every sales leader knows the tension: your forecast shows healthy pipeline, yet deals slip, renewal customers disappear, and you discover too late that a key account has been quietly moving spend to a competitor. By then, the revenue is gone. The uncomfortable truth is that most sales organizations are missing revenue opportunities because they lack complete visibility into customer health. Dynamics 365 Sales gives you the transaction history, but it doesn’t automatically tell you which customers are at churn risk, which territories are underserving high-value segments, or which accounts have unmet needs your sales team has overlooked.

This visibility gap creates revenue leakage—the silent drain of money your organization should be capturing but isn’t. It’s not a process problem or a capability problem. It’s a data problem. Sales teams today operate with fragmented customer views, pulling insights from email, spreadsheets, and half-remembered conversations rather than from a unified, AI-informed customer profile.

Dynamics 365 Customer Insights, integrated with Dynamics 365 Sales, changes that equation. It surfaces the customer and deal patterns your sales team is missing, turning reactive forecasting into proactive opportunity identification. Here’s why this matters, and how to use it.

The Hidden Cost of Incomplete Customer Visibility

A typical enterprise sales organization manages accounts across multiple product lines, regions, and sales representatives. Within that sprawl, visibility breaks down. A customer’s service interactions, support history, and product usage patterns live in separate systems. Your CRM captures what the sales team recorded, often days or weeks after the conversation. Marketing knows about digital engagement and content downloads but doesn’t automatically share that with the sales team. Finance sees transaction history but not the potential for expansion.

The result is that your sales team operates on a partial picture. A renewal customer who shows declining product usage may not trigger an alert until the renewal comes due—too late to course-correct. A high-value prospect showing strong product engagement may never get the right follow-up because the sales process doesn’t connect product behavior to account value. A territory might be systematically underserving customers in a high-margin segment simply because the data to identify those customers never reaches the account manager’s workspace.

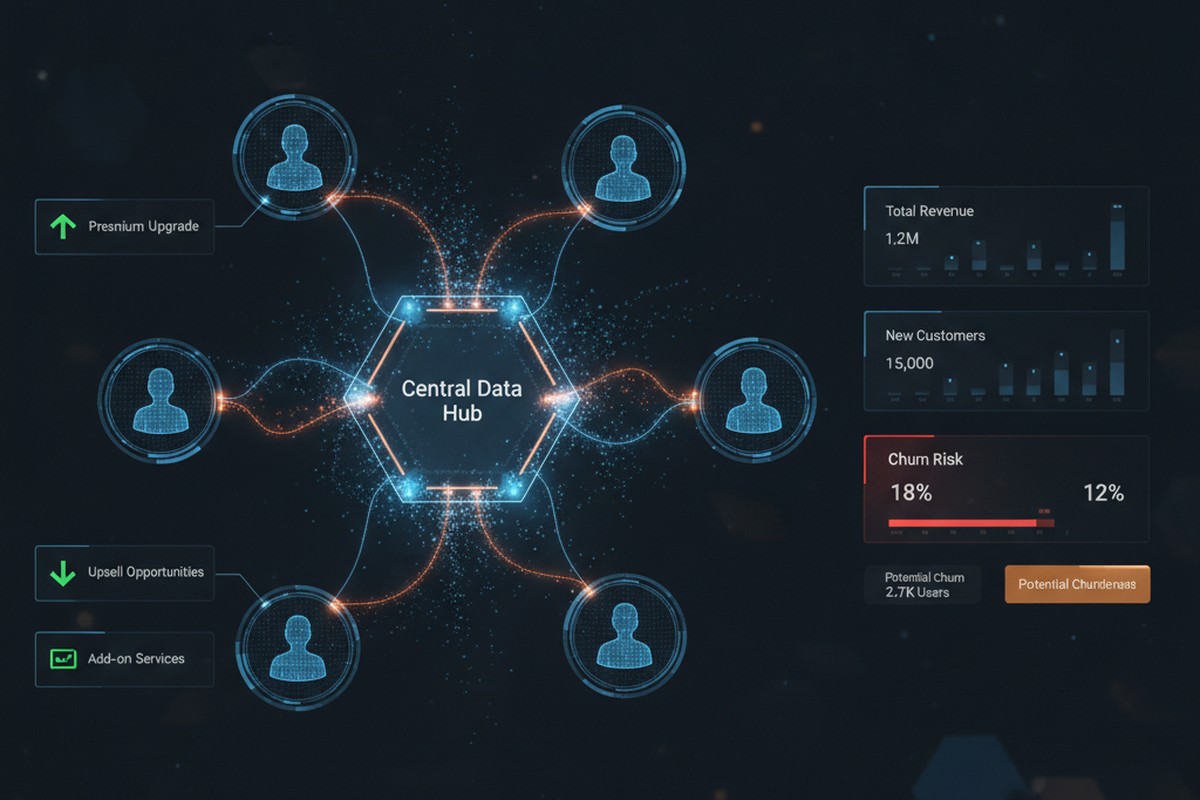
Customer insights and sales analytics visualization showing interconnected customer data, churn risk indicators, and upsell opportunities

None of these problems are individually dramatic. But they accumulate. A single missed upsell here, a renewal at risk there, a territory misaligned by segment. Over a year, across a 50-person or 500-person sales organization, the revenue impact becomes material. This is revenue leakage: money your organization should capture but doesn’t because the visibility isn’t there to act on it.

What Customer Insights Reveals

Dynamics 365 Customer Insights does three things that Dynamics 365 Sales alone cannot do: it unifies fragmented data, it applies AI to detect patterns, and it surfaces those patterns directly where sales works.

First, unification. Customer Insights pulls data from Dynamics 365 Sales, Service, and Finance, along with external sources like transactional systems, email engagement platforms, and even product usage telemetry if you’re licensing that data. It resolves duplicate customer records, maps fragmented customer identities across systems, and builds a single unified customer profile. That profile then becomes the source of truth for your sales team, not the sum of dozens of disconnected systems.

Second, AI-driven pattern detection. Once your customer data is unified, Customer Insights applies machine learning models to detect risk and opportunity. It identifies which customers are at churn risk based on behavioral signals: declining engagement, reduced transaction frequency, increasing support tickets for infrastructure issues rather than feature adoption. It flags cross-sell and upsell candidates by finding customers with strong product engagement, high contract value, and similarity to customers who have successfully adopted adjacent products. It detects territory misalignment by showing which high-value customer segments are under-represented in each territory’s current assignment.

Third, integration into sales workflows. Customer Insights insights aren’t buried in a separate analytics portal. They live inside Dynamics 365 Sales, where your sales team already works. A segment insight becomes a targeted list for account managers. A churn risk indicator appears on the customer card, prompting a proactive outreach. Territory realignment recommendations come with data backing that makes the business case clear to sales leadership.

Three Revenue Leaks Customer Insights Stops

In practice, this surfaces three common revenue leaks that Dynamics 365 Sales alone doesn’t catch.

Churn risk not detected until renewal: A customer’s service organization starts requesting more support tickets. Their product usage plateaus. They haven’t attended your quarterly business reviews. But your sales team doesn’t know this yet because the renewal isn’t for eight months. By the time the renewal date arrives, the customer has already decided to leave. Customer Insights detects these behavioral signals and flags the account as at-risk, giving your sales team months to engage, understand the underlying issues, and propose solutions before the customer decides to leave.

Upsell and cross-sell opportunities invisible in transaction history: An existing customer has been steadily growing revenue with one product line. Their usage of that product is high relative to their segment peer group. They have no adoption of your complementary product, despite a clear business case. But this pattern doesn’t surface in your CRM unless a sales rep manually reviews the account and spots it. Customer Insights identifies customers matching this profile (high engagement with Product A, zero adoption of Product B, high segment value) and presents the opportunity to the account manager in a curated list. The sales team then has clear targeting and clear messaging: here are ten accounts that look exactly like your most successful cross-sell deals.

Territory assignments that systematically underserve high-value segments: A sales rep covers a territory by geography or existing customer base, as most do. But unbeknownst to anyone, their territory is underindexed for your highest-margin customer segment. There are five high-value customers they should be servicing more aggressively, but the assignment wasn’t based on segment data. Customer Insights analyzes territory composition and identifies these gaps. Sales leadership can then realign assignments, pair reps, or adjust compensation to prioritize the underserved segment, recovering revenue that was never really lost but never properly prioritized either.

Making It Work: Implementation Reality

Deploying Customer Insights for revenue recovery requires more than licensing and configuration. It requires discipline around data and alignment between sales and the teams supporting data quality.

Start narrow. Don’t try to build a unified customer profile from all your data at once. Pick your three to five highest-priority leakage patterns: churn risk, a specific high-margin upsell use case, or territory underutilization in a specific segment. Build the data foundation for those patterns first. That usually means cleaning Dynamics 365 Sales and Finance data, establishing integrations with service and support systems, and clarifying the business definitions your models need (what signals constitute churn risk for your product and industry, what engagement level constitutes strong adoption, what segments you care most about).

Then connect insights to action. An insight that doesn’t make it to a sales rep’s attention is just reporting. Customer Insights insights should flow into Dynamics 365 Sales as filtered lists, dynamic segments, or automated workflow triggers. When a customer hits a churn-risk threshold, a task appears on the account manager’s dashboard. When your AI identifies a cross-sell candidate, it lands in a weekly opportunity list. This requires configuration, but it’s configuration that makes the investment pay off.

Finally, track adoption and adjust. Sales teams don’t automatically trust new data. They trust data that repeatedly surfaces patterns they already sense. So measure: what percentage of churn-risk customers your team engages, what percentage of AI-identified cross-sell opportunities convert, what revenue the territory realignment recovered. As results emerge, adoption increases and the business case for the investment becomes clear.

The Compound Effect

Revenue leakage seems invisible because it’s measured by the opportunities you didn’t see, not by the deals you lost. A customer renewal that didn’t happen looks like a churn, not a miss. A customer segment your territory didn’t pursue looks like normal variation in segment mix, not a systemic gap. But when you unify customer data and apply AI to detect patterns, these invisible leaks become visible. And visible problems are fixable.

For a 100-person sales organization with average deal size of $50,000, recovering even one additional deal per quarter per rep through improved territory alignment or churn prevention represents $5M to $10M in annual recurring revenue. The math compounds as your organization scales. Customer Insights is not the only solution to revenue leakage, but it’s one of the few tools that surface the patterns causing the leak in the first place.

Dynamics 365 Sales will always show you what happened. Customer Insights shows you what you’re missing. For sales leaders serious about revenue recovery, that difference is strategic.


About Routeget Technologies: Routeget specializes in Dynamics 365 implementations for enterprise sales and service organizations. We help sales leaders establish data governance and customer analytics strategies that uncover revenue recovery opportunities through Customer Insights and Dynamics 365 Sales integration. If your organization is looking to reduce revenue leakage through better customer intelligence, we’d welcome a conversation.

#DynamicsSales #CustomerInsights #RevenueLeakage #SalesAnalytics #SalesForecasting #CustomerDataPlatform #SalesLeadership

Building Custom APIs in Business Central: A Developer’s Guide to Extending Integration Capabilities

Developer workspace with multiple monitors showing AL code and API documentation

# Building Custom APIs in Business Central: A Developer’s Guide to Extending Integration Capabilities

Business Central’s Power Automate connector and standard OData endpoints cover a wide range of integration needs. For a mid-market company syncing a handful of cloud services, these out-of-the-box capabilities are often sufficient. But the moment you need to expose Business Central data to a proprietary third-party system, enforce complex business logic at the API boundary, or build a consistent integration layer that multiple services depend on, you’ll quickly discover the limits of connector-based approaches.

Custom API endpoints in Business Central provide a way out. Unlike the Power Automate connector, which exposes a read-only view of standard entities, custom APIs let you control exactly what data flows into and out of your system, apply authorization rules at the endpoint level, and define the exact REST semantics your downstream systems expect.

Developer workspace with multiple monitors showing AL code and API documentation

## When Standard Connectors Stop Working

The Power Automate connector and OData endpoints both serve important purposes, but they operate under constraints that custom APIs remove. The Power Automate connector simplifies workflow automation by automatically discovering Business Central tables and fields, but this convenience comes with limited flexibility around response formats, pagination, and error handling. OData endpoints provide more control but still expose the underlying data model directly, which means any future schema changes can ripple into dependent systems.

A custom API, by contrast, sits between your Business Central data layer and external systems. It acts as a versioned contract that isolates external consumers from internal schema changes. If you add a field to a table, rename a lookup, or refactor your data structure, the API’s public interface remains stable as long as the underlying business logic does.

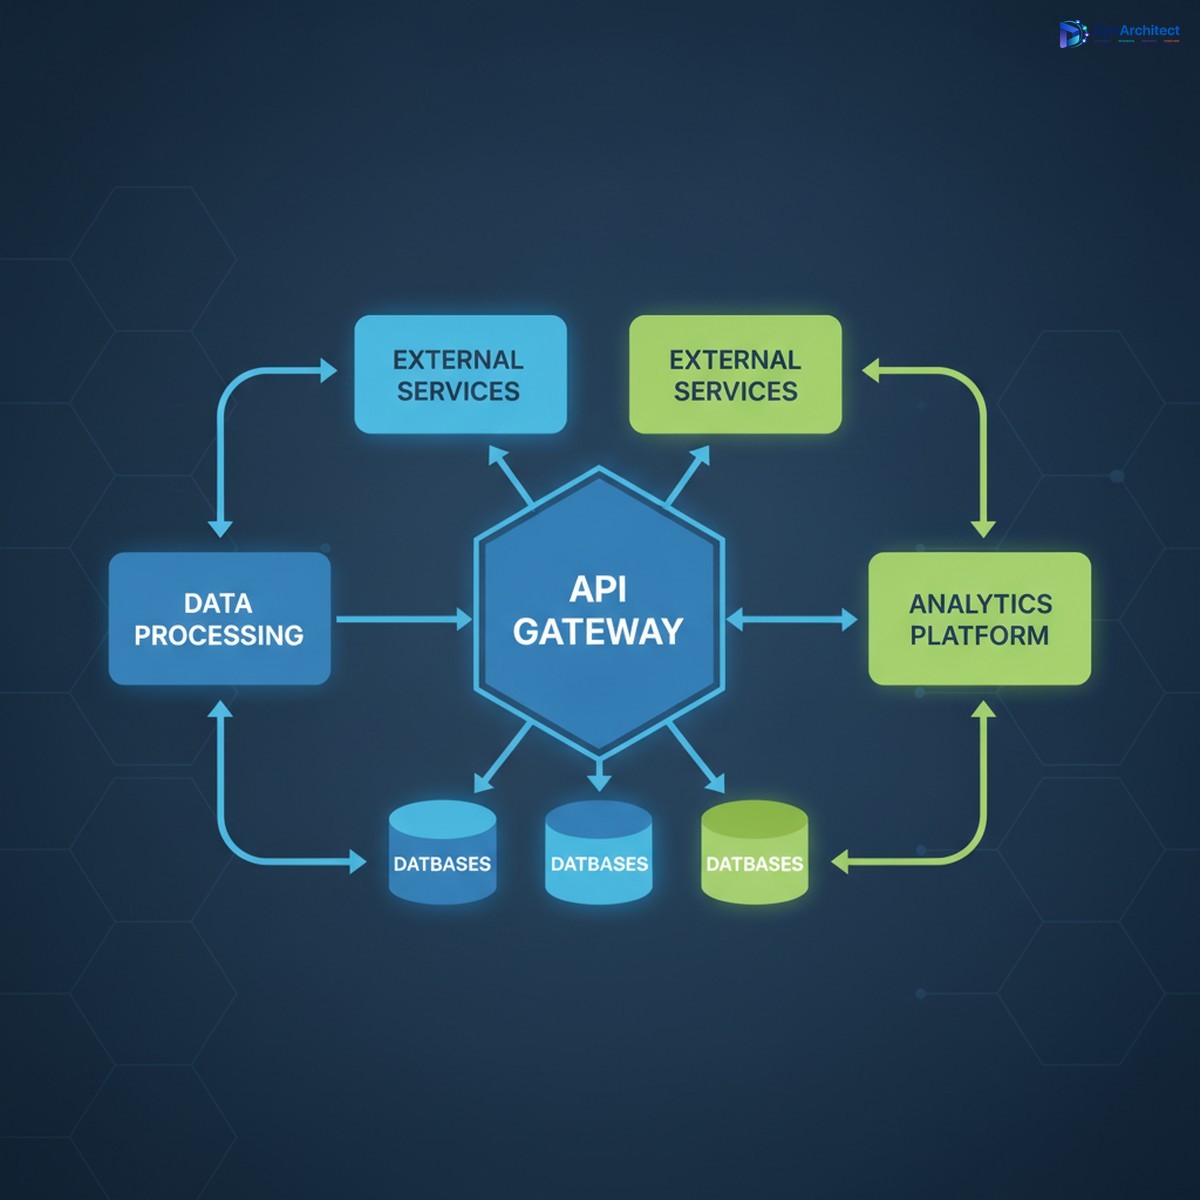
Cloud architecture diagram showing API gateway with multiple integrated systems

## Building Your First Custom API in AL

In Business Central, custom APIs are built using AL, the business application language. The core construct is an API page, which combines the declarative benefits of page design with REST exposure. Here’s the basic pattern:

A custom API page declaration specifies an entity name, which becomes the REST resource path (/api/custom/v1/orders, for example), and then maps AL fields to the underlying Business Central tables. Unlike a traditional page, which is designed for user interaction, an API page focuses on data structure and response shape.

“`
page 50100 OrderAPI
{
PageType = API;
EntityName = ‘Order’;
EntitySetName = ‘Orders’;
…
}
“`

From this declaration, Business Central automatically exposes a REST endpoint. A POST request creates a record, GET retrieves records, PATCH updates, and DELETE removes records, following standard HTTP semantics.

## Controlling the Request Surface

One of the key advantages of building custom APIs is control over the data you expose. You’re not forced to expose every field on a table. Instead, you explicitly declare which fields appear in the API, rename them if needed for compatibility, and define read-only vs. read-write properties.

This becomes essential when integrating with legacy systems or third-party services that expect a specific data structure. If your external partner’s API expects a field called `CustomerOrderID` but Business Central calls it `BillToCustomerNo`, the custom API layer translates between them. This translation insulates both systems from breaking changes on the other side.

Equally important is the ability to hide internal details. Not every field a Business Central user needs to see belongs in an external API. You can expose only order headers, hide internal cost allocations, and require that all modifications go through specific validation routines your custom API enforces.

## Authentication and Authorization at the API Level

All Business Central APIs, custom or standard, authenticate via Azure AD (Entra ID) OAuth. Your calling system requests a token using a service principal or delegated credentials, and Business Central validates the token before allowing access to the API.

However, custom APIs let you layer additional authorization logic on top of Azure AD authentication. You might check that the caller’s organization ID matches the data they’re requesting, or enforce that only a specific external system can modify orders within certain value ranges.

This can be implemented in the page’s trigger code, before any data is returned or modified:

The API code can inspect the authenticated caller’s identity, query Business Central tables to determine if access is allowed, and reject the request with a specific HTTP status and error message if not.

## Versioning Your API Without Breaking Clients

Over time, your API contract will evolve. You’ll add new fields, deprecate old ones, or change the structure of nested objects. Custom APIs handle this through explicit versioning.

The standard approach is to include a version number in the API path itself: `/api/custom/v1/orders` vs. `/api/custom/v2/orders`. This allows you to support legacy clients on the v1 endpoint while new clients use v2. You might even run both endpoints simultaneously, pointing v1 to an older page definition and v2 to an updated one, ensuring that existing integrations don’t break.

Alternatively, you can deprecate individual fields by keeping them in the response but marking them in documentation as no longer updated. This gives calling systems time to migrate to newer fields before you remove them entirely.

## Testing and Monitoring Your Custom API

A custom API is only as good as its reliability in production. Before deploying to a live environment, test the API endpoints thoroughly using tools like Postman or custom scripts that simulate your downstream systems. Verify that create, read, update, and delete operations all work as expected, that error responses include meaningful messages, and that rate limits and timeouts behave predictably.

Once deployed, monitor the API’s health through Business Central’s telemetry and logging infrastructure. Log each API call with caller identity, HTTP status, and execution time, so you can diagnose performance issues or unexpected errors after the fact. If an external system starts making requests at an unusual rate or fails repeatedly, your logs will reveal it quickly.

## A Practical Example: Order Sync Between Business Central and an ERP Partner

Consider a scenario where your organization uses Business Central as the primary system of record for financial data, but integrations with a warehouse management system (WMS) require real-time updates whenever an order ships. A custom Order API exposes the minimum fields the WMS needs: order number, line items, quantities, and ship-to address.

The API page includes trigger code that, on insert or modify, validates that quantities are non-negative, ship-to addresses are complete, and the order type is supported by the WMS integration. If validation fails, the API returns a 400 error with a message explaining what was missing or invalid. This prevents the WMS from receiving half-formed orders that it cannot process.

When the order is ready to ship, the WMS sends a PATCH request to the same endpoint with shipping carrier and tracking information. The custom API updates Business Central with those details, logs the update for audit purposes, and returns a 200 response confirming success.

## Common Pitfalls to Avoid

One frequent mistake is exposing too much data in a single API endpoint. A page that joins ten tables and returns dozens of fields might seem comprehensive, but it becomes slow, difficult to version, and hard to secure. Instead, design lean APIs that return only what the caller needs, and create separate endpoints for different use cases.

Another pitfall is inadequate error handling. If your custom API hits an exception in AL code and doesn’t catch it, the response will be a generic 500 error with a stack trace. External callers have no idea what went wrong. Always wrap business logic in try-catch blocks, translate exceptions into meaningful HTTP status codes (400 for bad requests, 409 for conflicts, 422 for validation failures), and include a human-readable error description.

Finally, don’t overlook throttling. If you don’t set rate limits on your API endpoints, a poorly behaved client or a denial-of-service attack can consume all available Business Central resources. Use Business Central’s built-in throttling policies to cap the number of requests per minute per caller.

## Moving Forward

Custom APIs transform Business Central from a closed system to an extensible platform. They enable you to control the shape of your data, enforce business rules at the boundary, and maintain a stable contract with external systems even as your internal architecture evolves.

If you’re currently wiring integrations together with Power Automate flows and OData endpoints, custom APIs might be the missing piece that gives you the control and clarity your architecture needs. At Routeget Technologies, we’ve helped organizations design and implement custom API strategies that streamline integrations and reduce long-term maintenance burden.

—

**#BusinessCentralAPIs #CustomIntegration #ALDevelopment #BusinessCentralExtensibility #APIDesign #IntegrationArchitecture #DevelopmentPatterns**

#BusinessCentralAPIs #CustomIntegration #ALDevelopment #BusinessCentralExtensibility #APIDesign #IntegrationArchitecture #DevelopmentPatterns

Automated Workflow Sprawl in Power Automate: How Finance Leaders Can Prevent the Cost Explosion Most Orgs Don’t See Coming

Finance leaders across enterprise organizations are discovering an uncomfortable truth about Microsoft Power Automate adoption: the platform that promises to eliminate manual work through low-code automation often becomes a hidden cost center once it reaches production scale. The culprit is not a licensing pricing error, but a governance gap. Organizations typically purchase Power Automate licenses based on anticipated user volume or a modest number of bots, only to find themselves facing exponential cost growth within 12 to 18 months. The reason is straightforward: they underestimated the volume of workflows that would be built, and they failed to establish guardrails to manage that sprawl before it spiraled into a compliance and budget problem.

The early signs appear incremental. A department discovers Power Automate and begins automating quote-to-invoice workflows. Finance enablement builds flows for journal entry generation. HR creates robotic process automation bots to automate onboarding. Each initiative seems reasonable in isolation, delivering clear ROI. But without a centralized finance governance model that tracks cost per flow, enforces retry limits, and manages premium connector usage, cloud flow sprawl becomes the default outcome. By the time the Finance organization sees the full bill, they are managing hundreds of flows across dozens of teams, with no clear visibility into which flows are actually delivering value and which are simply consuming API request capacity.

This article is written for finance leaders, IT directors, and CFOs who are either experiencing unexpected Power Automate cost overruns or want to prevent them as they scale.

The Real Cost of Power Automate is Not on the Price Sheet

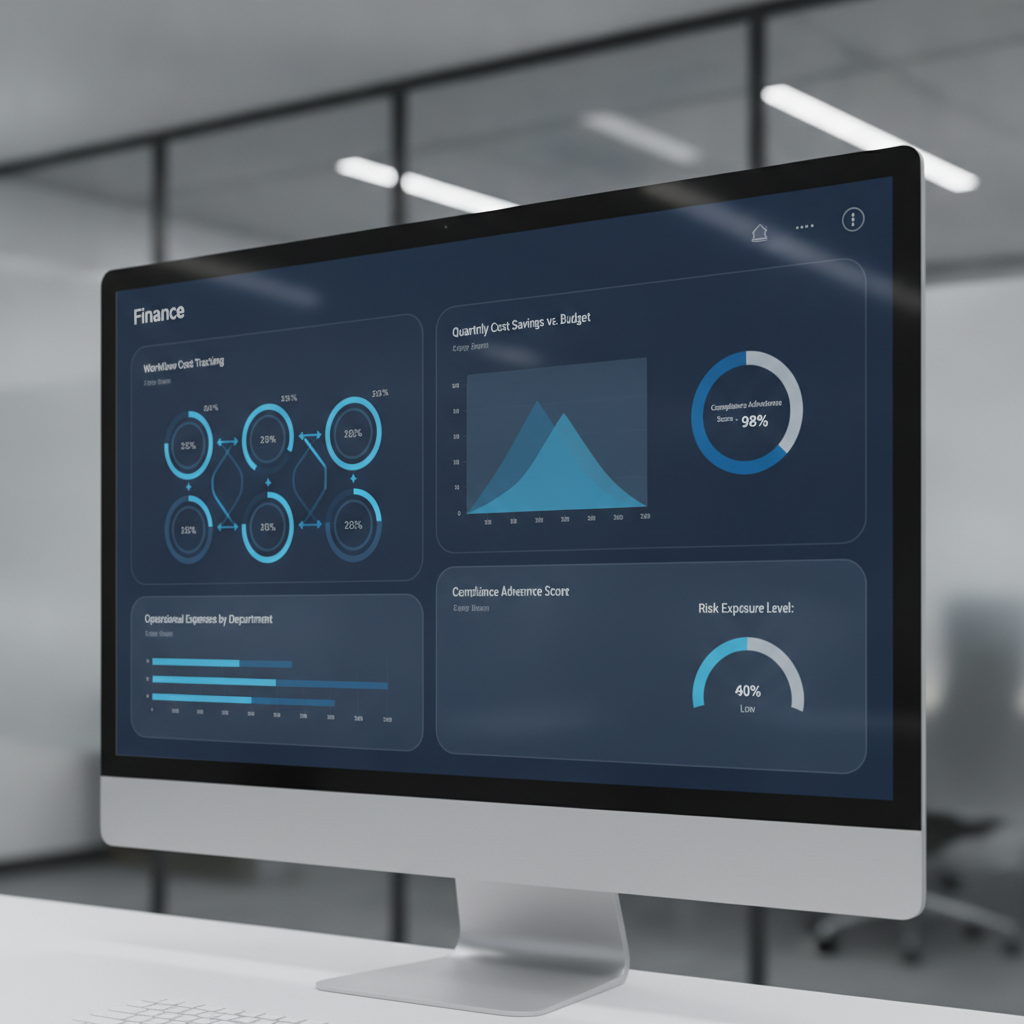
Finance dashboard showing cost controls and governance metrics for Power Automate workflows

Microsoft’s published Power Automate pricing tells one story: Premium plans at $15 per user per month, Process bot licenses at $150 to $215 per bot per month, plus premium connector fees for integrations to enterprise systems like Salesforce, SAP, or ServiceNow. That is the anchor price, but not the total cost most organizations experience at scale.

Research consistently shows that real total cost of ownership runs 3 to 5 times the base licensing cost once automation moves beyond pilot into operational deployment. The gap exists because several cost drivers are not visible at purchase time and are not managed as line items on initial procurement requests.

First is the cost of premium connectors. The base Power Automate license includes only standard connectors. Flows that touch enterprise systems like Salesforce, Oracle, ServiceNow, or SAP require a premium connector license, adding per-user or per-flow costs on top of the base plan. In a large organization with dozens of automation use cases spanning Finance, Operations, and Sales, premium connector usage becomes a pervasive second licensing layer.

Second is the API request limit structure. Each Power Automate license allocation includes a fixed daily quota of API requests. Flows running at high frequency can exhaust this quota, causing throttling and execution failures. Organizations can either optimize flows to use fewer API calls (expensive in consultant time) or purchase additional request capacity (expensive in licensing). This cost is often discovered in production, not in the procurement phase.

Third is the cost structure of unattended robotic process automation. Finance automation commonly involves unattended desktop flows, which require a separate Process bot license ($150 to $215 per bot per month). Organizations frequently begin with a pilot of two or three bots, then discover they need five, ten, or twenty bots to handle all manual processes suitable for RPA. Each additional bot is a monthly recurring cost, and growth correlates directly with how aggressively the organization pursues automation.

Fourth is the cost of monitoring and governance infrastructure. Cloud flows fail. Bots encounter edge cases and incomplete data. At large scale, organizations need investment in monitoring solutions, error logging platforms, and governance tooling, all adding to total cost of ownership beyond the base license itself.

How Workflow Sprawl Becomes a Budget Crisis

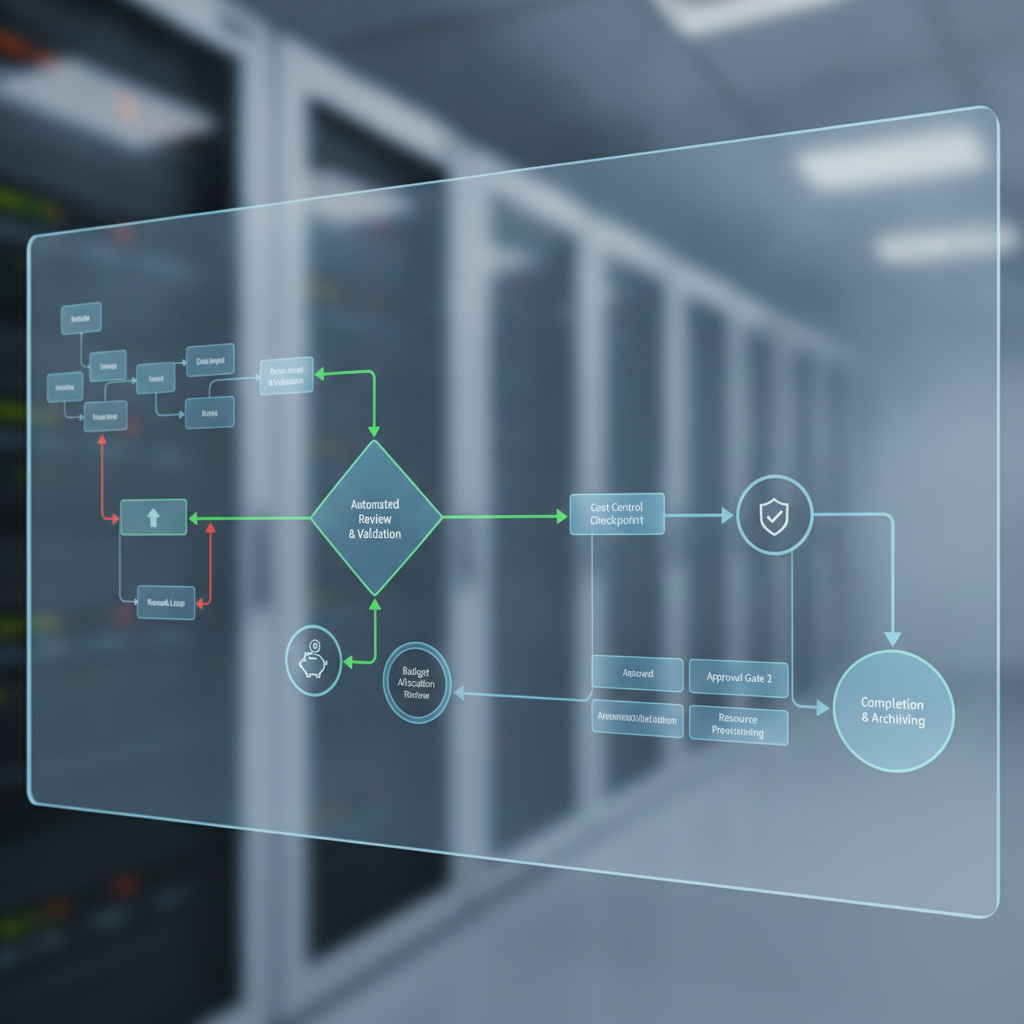
Workflow automation governance and approval gates visualization

The progression from pilot to sprawl follows a predictable pattern, rooted in organizational behavior and governance gaps rather than platform limitations.

Phase one is the success case. A team automates a business process with measurable results. Leadership approves expansion. Teams that see the success submit their own automation requests.

Phase two is the consumption phase. Requests accelerate. Finance IT or a Center of Excellence builds flows and bots in higher volume, focused on delivery velocity and process improvement, not cost per flow or API efficiency. An organization that budgeted for twenty flows but ended up with eighty viewed this as adoption success, not flagged as a problem. The assumption is that cloud platforms are cheap and infinite, an assumption that fails at the scale of hundreds of concurrent flows in a large enterprise.

Phase three is the recognition phase. The monthly software license bill arrives 50 percent higher than expected. Or the Power Automate admin console shows API request quotas being exhausted regularly. Or an audit discovers flows created without any approval process.

Phase four is the governance crisis. By this point, the organization has hundreds of flows and dozens of bot licenses in production. Rationalizing them is difficult because so many business processes depend on them. The choices become unattractive: freeze new automation requests, accept runaway costs, or undertake an expensive flow rationalization effort.

The real cost of sprawl extends beyond license fees. It includes operational overhead, wasted automation effort on redundant processes, API request overages, and governance overhead of auditing that volume of automation.

Governance Framework to Prevent Sprawl

The solution is not to avoid Power Automate, but to impose financial discipline and governance from the start, before sprawl becomes endemic.

First, establish a flow cost tracking model. Assign ownership, purpose, and monthly cost estimate to every flow and bot. Track actual API request consumption per flow and per team. Without cost visibility at that level of granularity, finance leaders cannot see which automation initiatives deliver value and which simply consume capacity.

Second, establish approval and prioritization gates for new automation. Every new flow or bot should be evaluated for business value, estimated cost per transaction, expected API request volume, and whether the outcome duplicates existing automation.

Third, set hard API request budgets by department. Monitor consumption weekly, not monthly. If a team approaches its budget, trigger a review of flow efficiency and consolidation opportunities.

Fourth, enforce premium connector policies. Premium connectors should be approved before flows are built, not discovered during cost review. Understand whether standard alternatives exist and whether business value justifies incremental licensing cost.

Fifth, consolidate flows quarterly or semi-annually. Identify redundant flows, consolidate similar use cases, and retire flows no longer delivering value. Treat the flow library as a managed asset.

Sixth, implement centralized monitoring and governance tooling. The Power Automate Center of Excellence starter kit or third-party platforms provide visibility into flow execution, failure rates, and API request consumption.

Where Finance Leaders Should Start

For CFOs and Finance Leaders evaluating or scaling Power Automate, the path starts with one decision: treat automation as a governed, cost-tracked initiative, not a free-for-all low-code platform.

If your organization is in pilot phase, establish governance discipline now, so it is part of the adoption story from the start rather than a late-stage correction.

If your organization is already in sprawl phase, the priority is visibility. Audit your current environment. Understand what flows are running, what they cost, what they do, and whether they deliver value. Execute a consolidation program to reduce complexity and cost.

Power Automate is genuinely powerful and genuinely cost-effective when deployed in a disciplined way. The platform is not the problem. Governance is. Finance leaders who treat it as a governed, tracked, and financially accountable initiative will see the promised ROI. Those who treat it as a free platform for teams to automate whatever they want will see costs spiral.

The choice, and the accountability, starts with Finance.


Routeget Technologies helps enterprise organizations design and implement governance frameworks for Power Platform and enterprise automation, ensuring automation delivers ROI at scale rather than becoming a hidden cost center.

#PowerAutomateGovernance #WorkflowAutomation #FinanceTransformation #PowerPlatform #CostOptimization #EnterpriseAutomation #Microsoft365Automation

Building Autonomous Agents with Copilot Studio: Moving Beyond Chatbots

# Building Autonomous Agents with Copilot Studio: Moving Beyond Chatbots

Most organizations implementing Copilot Studio treat it as an intelligent chatbot that responds to user queries. That’s a missed opportunity. The platform’s real power lies in building autonomous agents that can make decisions, trigger downstream processes, and handle multi-step workflows without human intervention at each stage. Finance teams processing invoice exceptions, HR departments handling onboarding, and supply chain teams managing vendor communications all stand to benefit.

Copilot Studio autonomous agent system architecture

The gap between a chatbot and an autonomous agent comes down to three capabilities: the ability to invoke external systems without manual triggers, the capacity to make contextual decisions based on structured data, and the skill to maintain state across actions without restarting. Most Copilot Studio implementations lack these, which means their agents remain reactive and conversation-driven rather than autonomous and process-driven.

Building such an agent requires careful attention to custom actions, knowledge base integration, prompt engineering, and error handling. It’s not enough to wire up an API connection. You need to architect the agent so it knows when to act independently, how to handle failures gracefully, and when to escalate decisions to human reviewers.

Autonomous Agents vs. Interactive Chatbots

An interactive chatbot waits for user input at every step. The user submits a question, the chatbot responds, and the conversation ends until the next message arrives. Autonomous agents complete tasks without requiring user input at each decision point.

Consider a claims-processing agent. An interactive version might ask, “Does this claim qualify for expedited review?” and wait. An autonomous agent evaluates the claim against configured rules, makes the decision independently, updates the backend system, and notifies stakeholders automatically. The user’s role shifts from guiding each step to reviewing high-risk exceptions.

This design shift affects multiple aspects. First, the agent must understand when to act without prompts, requiring condition evaluation and decision trees beyond natural language understanding. Second, the agent must have authority to modify downstream data, introducing governance questions about which decisions need audit trails, human review, or policy-based automation.

Third, autonomous agents must recover from failure states gracefully. If an API call fails, an interactive chatbot tells the user it didn’t work. An autonomous agent must retry, escalate, or follow a fallback path based on business logic. Building robust error handling into the agent’s design from day one is essential.

Custom Actions and API Integration

Copilot Studio’s custom actions allow you to connect to external APIs and invoke them as part of the agent’s workflow. This is where many implementations falter. Teams configure basic actions without thinking through how the agent should behave when an API call fails, how long it should wait, or whether it should retry.

For a typical autonomous agent, you’ll define custom actions for the key external systems your agent needs to access. In a finance context, this might mean actions that query an ERP system to check if a purchase order exists, retrieve the purchasing history for a vendor, or post a transaction to the general ledger. In an HR context, you might define actions to look up employee records, check manager approval status, or send notifications through Teams or email.

Each action should include error handling at the definition level. Define which HTTP status codes are retryable (typically 502, 503, 504 and timeout errors), which represent permanent failures (400, 401, 403), and which might represent missing data (404). Configure exponential backoff for retries to avoid overwhelming the downstream API.

The other critical design choice is authentication. Copilot Studio supports connection references, which allow you to authenticate to external APIs securely. For a finance agent, you might use a service account that has specific permissions (read-only access to check PO status, but write access only to specific GL accounts). Never give your agent more permissions than it needs. If an agent is compromised, narrow permissions limit the damage.

Knowledge Base Integration

Most Copilot Studio agents include at least one knowledge base: a collection of documents or FAQs that the agent can reference when answering questions. For autonomous agents, knowledge bases serve a different purpose. Rather than storing answers to user questions, you use them to store decision logic, business rules, and process documentation that the agent uses to make autonomous decisions.

Consider a vendor onboarding agent. Instead of storing a knowledge base full of “How do I become a vendor?” FAQs, you store the actual business rules: vendors in certain geographic regions require additional tax documentation, vendors spending over a certain threshold need credit checks, and vendors in specific industries need compliance certifications. The agent retrieves these rules from the knowledge base, evaluates them against the vendor’s profile, and determines which documents need to be collected before onboarding can proceed.

This approach works because Copilot Studio’s retrieval-augmented generation (RAG) allows the agent to fetch relevant information from the knowledge base and incorporate it into its reasoning. The agent doesn’t just repeat back what’s in the knowledge base; it uses the information to make decisions.

For this to work reliably, your knowledge base content needs to be structured and current. Avoid storing conflicting information. If rule A says “credit checks are required for vendors over $100K” but another document says “credit checks are needed for vendors over $50K,” the agent’s behavior becomes unpredictable. Centralize your business rules in a single source of truth, and refresh the knowledge base whenever rules change.

Prompt Engineering for Autonomous Decision-Making

The system prompt enables autonomous action. A poorly written prompt produces an agent that refuses decisions or decides carelessly. A strong system prompt includes four elements: clear boundaries on what decisions it can make versus escalate, step-by-step decision logic (“Check vendor history using the vendor-lookup action. If they have 50 successful transactions in the past 12 months and average payment time under 30 days, they qualify for expedited payment”), guardrails for when to escalate (“If you cannot retrieve the vendor record after two retries, escalate with a detailed explanation”), and instructions for maintaining context (“Remember the vendor ID throughout. Do not make redundant lookup calls”). Specificity separates reliable agents from unreliable ones.

Error Handling and Escalation Workflows

Every autonomous agent will encounter situations where it can’t proceed. An API call fails. Required data is missing. A decision requires human judgment because it involves an exception to the normal rules. How the agent handles these situations determines whether it’s actually useful.

Design your escalation workflow first. Identify three or four common failure scenarios for your agent. For a claims processor, these might be: missing medical documentation, conflicting diagnoses from different providers, and claims that exceed specific dollar thresholds. For each scenario, define who reviews it, what information they need to see, and how they communicate their decision back to the agent (if it needs to resume).

In Copilot Studio, escalations typically flow through Power Automate. When your agent encounters a situation that requires human review, it creates a ticket or sends a notification through Teams, Power Automate, or a ticketing system. That ticket should include all the context the reviewer needs: the data the agent gathered, the decision it tried to make, and why it couldn’t proceed.

When the human reviewer makes a decision, it needs to flow back to the agent. This might happen through manual input in Teams, through an approval flow in Power Automate, or through a custom action that queries decisions from a database. The agent needs to know what the reviewer decided and continue processing if appropriate.

Test your error handling paths before going live. Don’t assume the happy path works and hope the error handling magically works when things go wrong. Deliberately trigger failures: kill an API connection, send bad data, create scenarios where required fields are missing. Observe how your agent behaves and refine the escalation logic.

Testing Autonomous Agents

Testing an autonomous agent is more complex than testing a chatbot because behavior depends on data state, API responses, and decision logic. Test at three levels: individual actions in isolation using Copilot Studio’s built-in testing, decision paths using test data with known outcomes, and escalation and error handling by simulating API failures and missing data. For each scenario, document expected behavior and verify the agent performs as designed.

Governance and Monitoring

Autonomous agents that make decisions without human review carry risk. Build governance into your design by logging every decision with the context that informed it. Set up monitoring dashboards that track autonomous decisions, escalations, errors, and human overrides. If humans override agent decisions more than 20 percent of the time, the agent’s logic needs refinement. Schedule periodic audits to verify correctness and identify patterns in mistakes, then update the system prompt or decision logic to correct them.

Conclusion

Building a true autonomous agent in Copilot Studio requires more up-front design work than building a chatbot, but the payoff is significant. Autonomous agents reduce manual work, ensure consistent decision-making, and allow organizations to scale processes without proportional increases in headcount. The key is treating autonomy as a design requirement from day one: architect your custom actions, knowledge base, prompts, and error handling specifically to support autonomous decisions, and build governance and monitoring to ensure those decisions stay accurate over time.

—

**About Routeget Technologies:** Routeget specializes in designing and implementing autonomous agents across the Microsoft cloud platform, helping organizations move beyond chatbots to truly autonomous processes. Our team brings hands-on experience building agents for finance operations, supply chain, HR, and customer service use cases, with a focus on robust error handling, governance, and measurable business outcomes.

#CopilotStudioAgents #AutonomousAgents #PowerPlatform #AIDecisionMaking #ProcessAutomation #Microsoft365AI #AgentDesign

#CopilotStudioAgents #AutonomousAgents #PowerPlatform #AIDecisionMaking #ProcessAutomation #Microsoft365AI #AgentDesign

Demand Forecasting in Dynamics 365 Supply Chain: Why AI Predictions Still Need a Finance Controller

Supply chain analytics dashboard showing demand forecasting data

Your supply chain forecasting process relies on a spreadsheet, email chains, and quarterly consensus meetings where people argue about whether next quarter looks “up” or “down.” By the time everyone agrees, demand has already shifted. Dynamics 365 Supply Chain includes native demand forecasting powered by machine learning, and it looks compelling: automatic pattern detection, seasonal adjustment, and predictions backed by months of transaction history. The promise is clear: let the algorithm handle it, and inventory optimizes itself.

But here’s what most supply chain leaders discover after three months of production use: the algorithm is confident and occasionally wrong in expensive ways. A Dynamics 365 demand forecast can show 10% growth next quarter because of a single promotion cycle two years ago that now looks like a trend. Or it can predict stable demand when a major customer just went silent. The numbers are rigorous; the business context is not.

This is not a Dynamics 365 limitation, but a forecasting reality that CFOs and supply chain directors need to understand before they flip the switch on full automation. The technology works. The question is how to use it without letting the model’s confidence substitute for financial discipline.

Supply chain planning dashboard with demand forecasting metrics

What Dynamics 365 Demand Forecasting Actually Predicts

Dynamics 365 Supply Chain uses machine learning to analyze historical demand patterns and generate point forecasts for future periods, typically one to twelve months out. The system takes transaction history (sales orders, purchase orders, inventory movements), identifies seasonality, trend, and cyclical patterns, and applies time-series decomposition to produce a predicted demand volume for each item in each period.

The key phrase is “point forecast”: a single number per period per item, not a range. It’s precise, quantifiable, and immediately actionable as a target for production planning, procurement, and inventory targets. The model uses techniques like exponential smoothing and ARIMA (AutoRegressive Integrated Moving Average) to weight recent history more heavily and adjust for seasonal swings observed over multiple years.

For many product categories, this works well. If you sell a consistent product with stable customer base and predictable seasonality, a machine learning forecast often beats manual judgment. The algorithm isn’t emotional, doesn’t anchor to last year’s number, and picks up subtle patterns that a spreadsheet jockey might miss. This is not theoretical; it’s production reality across hundreds of implementations.

The Finance Controller’s Problem with Pure Automation

The trouble arrives when the model’s assumptions break down. Here are three scenarios that appear in almost every supply chain forecasting implementation:

Scenario 1: A Large Customer Goes Quiet or Leaves. Your top customer, representing 22% of annual demand for a product family, doesn’t place an order for two periods. The demand forecast model has five years of history showing this customer as rock-solid steady, so the algorithm predicts normal consumption in period three, waiting for the order that never comes. A human supply chain planner would escalate the issue to sales or customer success immediately. A finance controller would note the drop in the forecast, not wait for the model to recalibrate across six more months of zero orders.

Scenario 2: One-Time Promotions Create False Trends. Last summer, you ran a promotional campaign that drove a 40% spike in demand for a specific product. The machine learning model, looking at the last 24 months of history, detects this spike and attributes a portion of it to an underlying trend shift rather than recognizing it as a one-time event. The forecast for next summer incorporates this “trend,” predicting sustained 20% elevation even though you have no plans to run the promotion again. A finance controller reviewing the forecast would flag this immediately (“Did we plan a promotion? No.”). The algorithm does not ask strategic questions.

Scenario 3: Timing Mismatch Between Demand Signal and Forecast Recalculation. You learn on Tuesday that a major product line is being discontinued. The demand forecast in Dynamics 365, calculated on last Friday, still predicts normal consumption through quarter-end. The model will not be recalculated until next Friday’s batch run. By the time the new forecast is available, you’ve already committed to purchase commitments and production schedules based on outdated data. A finance controller who is manually involved in forecast validation can adjust the prediction immediately.

In each of these scenarios, the machine learning model is not “wrong” in statistical terms. It’s following its design: predict based on historical patterns. The business context (personnel changes, campaign decisions, strategic shifts) happens faster than the model’s training cycle can absorb. Finance leaders know this. Supply chain leaders know this. But when the system is fully automated, nobody is asking the question.

The Dynamics 365 Approach: Automation With Financial Governance

Dynamics 365 Supply Chain’s forecasting engine does include governance features, but they work best when treated as mandatory checkpoints, not optional. The system allows you to:

Set override rules at the item or item-family level, specifying factors by which the model’s predictions should be adjusted (for example, “multiply this item’s forecast by 1.15 for next quarter because we’re running a promotion”). You can also set absolute override values, replacing the model’s prediction entirely for specific items in specific periods.

Use Demand Forecast Accuracy KPIs to measure how well the model’s past predictions match actual demand, broken down by item family and customer segment. If a forecast consistently misses by 15% for a certain category, that’s a signal to investigate whether the model’s assumptions are still valid or whether market conditions have shifted in ways the historical data doesn’t capture.

Manually adjust forecasts before they feed into production planning by creating a Demand Forecast Adjustments form, where supply chain planners and finance controllers can document specific business reasons for adjusting (or accepting) each model-generated prediction. This creates an audit trail: months later, you can see that Q2 forecasts were intentionally lifted 8% because of an announced customer expansion, distinguishing intentional adjustments from modeling error.

Integrate the demand forecast into a Dynamics 365 Planning Optimization run, which also accounts for supply constraints, lead times, and safety stock levels. The forecast is just one input; planning optimization adjusts based on the full supply picture.

None of these features bypass the algorithm. They layer financial and business governance on top of the automation, recognizing that pure model-driven forecasting works until it doesn’t, and having a second set of eyes looking at the numbers before they lock in procurement and production schedules saves more money than pure automation typically gains.

The Finance-Supply Chain Handoff: How the Best Teams Use Forecasting

Organizations that get strong results from Dynamics 365 demand forecasting typically follow a pattern:

Supply chain operations generates the base forecast using the machine learning model and treats it as a starting point, not a decision. They run the model on a fixed schedule (for example, every Friday afternoon) and document any configuration changes (for example, a customer’s demand type changes from baseline to promotional).

Demand planning, working with sales and marketing, reviews the forecast against known business events: major customer wins or losses, planned promotions, supply disruptions, or strategic inventory adjustments. They create documented adjustments in the system, so the model is informed of one-time events versus trends.

Finance and the controller function reviews the resulting forecast for cash flow, working capital, and procurement commitment implications before it locks in. A 30% demand lift for a product with a 90-day supply lead time means purchasing commitments, warehouse space, and cash flow assumptions need to shift accordingly. The finance controller’s approval step is the gate between “the model predicts” and “we’re committed to this plan.”

Production planning and procurement teams execute on the approved forecast, knowing it has been vetted by both demand planning and finance.

The entire cycle takes three to five days, depending on forecast complexity and business complexity. It’s not fully automated, but it’s not a spreadsheet-and-email process either. The machine learning model handles the analytical heavy lifting; human judgment handles the business context.

Getting Started Without Overhauling Your Current Process

If your organization currently uses manual forecasting or legacy forecasting tools, migrating to Dynamics 365 demand forecasting does not require overhaul on day one.

Start by running the Dynamics 365 forecast in parallel with your current process for one full planning cycle. Load several months of historical demand data into Dynamics 365 Supply Chain, configure the forecasting parameters (for example, seasonality windows, forecast time horizon), and let the model generate predictions. Compare the Dynamics 365 forecast to the forecast you would have created manually. Where do they agree? Where do they diverge, and why?

This parallel run gives you three things: validation that the model is picking up your business’s actual patterns, a baseline for measuring the model’s accuracy going forward, and team confidence that the system understands your supply picture before you make it a dependency.

Once you’re confident in the model’s direction, layer in governance. Designate a demand planning role in Dynamics 365 and grant that person permission to create forecast adjustments. Set up a simple adjustment log: which items are adjusted, by how much, and the business reason. Don’t try to perfect the process; just capture the decision.

Then pilot the forecast-to-planning integration with a subset of your highest-value items or customer segments. Run planning optimization using the Dynamics 365 forecast and compare the resulting purchase orders and production schedules to what you’re currently doing. If the plan improves (lower safety stock, fewer expedited orders, better cash flow alignment), expand the scope. If it diverges significantly from reality, investigate whether the forecast or the planning parameters need adjustment.

This three-step approach keeps risk contained while building organizational confidence that demand forecasting automation is working for you, not against you.

Conclusion

Demand forecasting in Dynamics 365 Supply Chain is a powerful tool for reducing guesswork and improving inventory efficiency. But “powerful” is not the same as “fully autonomous.” The best implementations treat the machine learning model as a rigorous analyst that handles pattern recognition at scale, paired with finance and supply chain leadership who understand the business context that no model can capture.

If your organization is evaluating demand forecasting or has already deployed it, the question is not whether to use the algorithm. It’s how to build a governance process that keeps human judgment and financial discipline in the loop without slowing your planning cycle to a crawl. Dynamics 365 makes that possible, as long as finance leaders and supply chain teams treat the forecast as input to a decision, not a decision itself.


Routeget Technologies brings enterprise Dynamics 365 implementation and optimization expertise to organizations across finance, supply chain, and customer engagement. Our consultants work with supply chain teams and finance leaders to design forecasting governance that balances automation with financial control, reducing inventory costs while improving forecast accuracy and auditability.

#DemandForecasting #DynamicsSupplyChain #InventoryOptimization #SupplyChainPlanning #FinanceAutomation #DynamicsERP #SCMStrategy