Business Central Cash Flow Forecasting: Automating Liquidity Planning with Predictive Analytics

Liquidity crises don’t announce themselves with executive summaries. They arrive as surprise calls from your bank about minimum balances, or as the discovery that payroll runway is tighter than expected while a major customer delays payment. For finance leaders managing mid-market organizations, cash flow visibility is survival insurance. Yet many organizations running Business Central still manage cash forecasts through spreadsheets, updated manually from GL balances and supplemented with guesswork about receivables collection and vendor payment timing.

The gap between current cash position and next month’s reality creates planning risk that traditional monthly close cycles don’t adequately address. Business Central’s native cash flow forecasting capabilities address this by combining historical transaction patterns, outstanding payables and receivables aging, and configurable forecast accounts into a forward-looking view of liquidity. When properly configured and monitored, this capability shifts cash planning from reactive expense management to proactive decision-making, allowing CFOs and Finance Directors to identify shortfalls weeks in advance and make informed decisions about debt facilities, capital allocation, or working capital optimization.

Why Cash Flow Forecasting Matters Beyond the Accounting Function

Cash flow forecasting in Business Central isn’t a finance tool with secondary business utility. It’s a business planning instrument that affects debt capacity, supplier relationship decisions, and strategic flexibility. Consider a growing organization that tightly manages working capital through careful buyer payment terms and customer payment incentives. Without forward visibility into cash position, the finance team must either (1) maintain excessive cash reserves to absorb unexpected volatility, which ties up capital otherwise deployed to growth, or (2) accept ongoing uncertainty and maintain standby credit facilities at higher-than-necessary cost because the organization cannot demonstrate stable cash predictability to its lenders.

Business Central’s cash flow forecast addresses this directly. By automating the aggregation of aged receivables and payables, overlay with account schedules that represent recurring cash activities (payroll, rent, debt service), and then extending forward using configurable assumptions about customer collection patterns, the system produces a documented, repeatable forecast that reflects the organization’s actual cash dynamics rather than generic assumptions.

How Business Central Structures Cash Flow Forecasting

Business Central organizes cash flow analysis around cash flow accounts, which represent categorized sources and uses of cash. The system maintains a hierarchy of these accounts, allowing organizations to forecast at summary levels (Operating Activities, Investing Activities, Financing Activities aligned to cash flow statement presentation) or drill into operational detail (Receivables Collection, Payables Disbursement, Payroll, Tax Payments, Debt Service). Finance teams configure which GL accounts map into which cash flow account, establishing a bridge between the accounting records and the forward-looking cash position.

Once configured, the forecast calculation follows a systematic process. The system queries aged receivables and aged payables for the foreseeable period. For receivables, it applies configured collection percentages (for example, assume 70 percent of current invoices collect within 30 days, 25 percent within 60 days, remainder within 90 days), generating a cash receipt forecast. For payables, it applies payment assumptions by vendor or age band. The system supplements this with manual forecast entries for known non-transaction items like salary expenses, loan payments, dividend distributions, or seasonal adjustments.

The result is a line-by-line, month-by-month forecast of cash inflows and outflows, typically extending 6 to 13 months into the future, depending on the organization’s planning horizon. This forecast can then be compared against actual cash balances, current debt capacity, and minimum balance requirements to expose timing mismatches or shortfalls well before they become operational constraints.

Practical Implementation: Moving Beyond the Setup Screen

The capability exists in Business Central, but its value depends on disciplined configuration and ongoing refinement. Many organizations implement cash flow forecasting, run a few reports, then set it aside because the forecasts consistently miss or require heavy manual adjustment. The gap usually traces to one of a few common implementation missteps.

First, the collection and payment assumptions must reflect your organization’s actual behavior, not generic textbook percentages. If your customer concentration is high, or your largest customers consistently pay on unique terms, the default 30-60-90 collection assumptions will not reflect reality. The first iteration of the forecast should be calibrated by comparing prior-year actuals against the forecast for the same periods, allowing the finance team to refine assumptions based on observed patterns.

Second, the configuration must account for known variations in cash timing. Payroll in most organizations is highly predictable. Seasonal businesses face known patterns of inventory buildup, collection acceleration, and vendor payments concentrated in specific quarters. Utilities, insurance, and tax payments arrive at known intervals. Loan amortization follows documented schedules. These should be explicitly configured in the forecast rather than treated as unknowns or manually adjusted each reporting period. The effort to establish this detail upfront compounds over time through reduced maintenance and more accurate projections.

Third, the forecast must distinguish between operational cash flows and financial and strategic cash flows. Operating forecasts driven by receivables, payables, and recurring GL entries capture the core business cash generation and consumption. But major capital equipment purchases, debt issuances or repayment, dividend distributions, or acquisition activity operate on different planning cycles and should be configurable separately so the forecast remains clean and interpretable.

Linking Forecast Accuracy to Working Capital Decisions

A well-maintained cash flow forecast becomes decision infrastructure. Finance teams use it to answer questions that directly affect operational and financial strategy: Can we accelerate vendor payments to capture early-pay discounts without constraining liquidity? Should we invest in supply chain financing programs that extend payables without impacting supplier relationships? Do we need to establish additional credit facilities for seasonal working capital, or is our cash generation sufficient? What is our realistic payoff timeline for outstanding debt? Can we fund a capital investment from operations, or must we raise external capital?

Organizations that treat the Business Central cash forecast as a static monthly ritual rather than a dynamic planning tool forfeit this benefit. The forecast should be refreshed at minimum monthly, ideally with a rolling 13-month horizon so planning always extends at least one full year forward. Variance analysis comparing prior-month forecasts against actual results informs assumptions refinement and builds confidence in the forecast’s reliability over time.

Moving Forward: From Spreadsheets to Integrated Planning

The transition from spreadsheet cash planning to Business Central’s integrated forecast model requires an initial investment in configuration and assumption refinement, but the payoff arrives quickly. Finance teams regain the hours lost to manual consolidation. The forecast becomes auditable and repeatable. New team members inherit a system of record rather than undocumented spreadsheet logic. Most importantly, the organization gains the cash visibility that underpins confident capital decisions and the liquidity management discipline that lenders and investors value.

For CFOs and Finance Directors overseeing mid-market organizations, Business Central’s cash flow forecasting is a capability that should be treated not as a reporting feature but as a core strategic planning tool. Configured thoughtfully and maintained rigorously, it transforms cash management from spreadsheet guesswork into data-driven planning.

Routeget Technologies specializes in Business Central implementation and financial process optimization for mid-market organizations. Our consulting teams help organizations configure cash flow forecasting, establish financial close automation, and optimize working capital strategies to align with business growth objectives.

#BusinessCentralCashFlow #LiquidityPlanning #WorkingCapitalManagement #BusinessCentralFinance #CFOInsights #CashFlowForecasting #FinancialPlanning #MidMarketERP

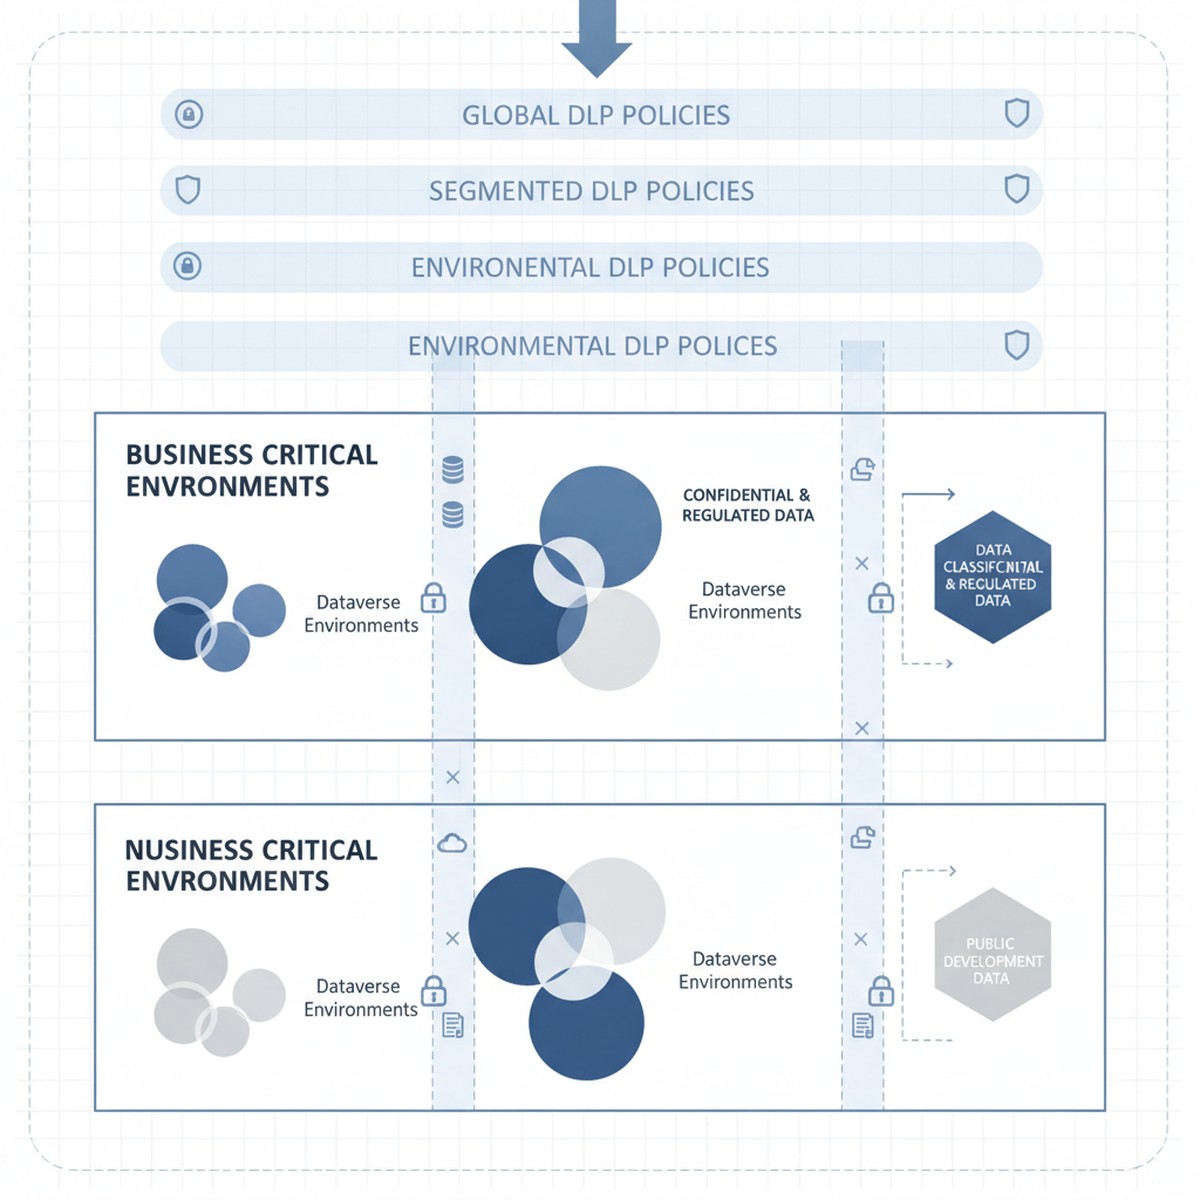
Error Handling in Power Automate Cloud Flows: Patterns for Reducing Failure Rates

Power Automate cloud flows are driving enterprise automation across organizations, yet many deployments stumble when real-world data, permissions, or dependencies fail. Error handling is not an afterthought in mature automation; it is the difference between a flow that occasionally breaks silently and one that responds predictably to problems.

The Real Cost of Unhandled Errors

Unhandled errors in Power Automate cloud flows create cascading problems. A flow that fails without notification means stakeholders never know an action did not complete.


About Routeget Technologies: Routeget specializes in Power Platform and Dynamics 365 implementations, helping enterprises build resilient automation and integration solutions.

Building Custom API Connectors for Dataverse: Designing Extensible Integration Patterns for Enterprise Scenarios

Custom API connectors in Microsoft Dataverse represent a fundamental shift in how organizations architect integrations at scale. Instead of building point-to-point connectors for each new system, teams can now standardize on Dataverse-native extensibility patterns that simultaneously serve Power Automate, Power Apps, and external applications. This architectural approach reduces maintenance overhead and creates a reusable integration backbone, but only if the connector design itself follows proven patterns around security, throttling, and error handling.

Most teams building their first custom connector make a similar mistake: they treat it as a direct passthrough to a backend API, implementing minimal validation and no circuit-breaking logic. Six months later, when a downstream system experiences degradation or an API contract changes, the connector cascades failures across dozens of dependent workflows. The solution isn’t more testing; it’s designing the connector with resilience baked in.

Understanding the Custom API Connector Model

Dataverse custom API connectors are serverless functions deployed via Azure Functions or Logic Apps that Dataverse registers as callable, authenticated endpoints. Unlike plug-ins that execute within Dataverse’s database transaction scope, custom APIs run outside the database and return results asynchronously, making them ideal for long-running integrations, third-party synchronization, and scenarios where you need to invoke external services without blocking Dataverse transactions.

The connector receives incoming requests from Power Automate cloud flows, canvas apps, or direct REST calls. It validates the input payload, applies any necessary transformations, calls external systems, and returns structured results back to the caller. This separation of concerns matters because it allows you to retry, log, and audit independently of Dataverse operations.

Security and Authentication Patterns

Authentication between Dataverse and your custom API should never rely on connection strings or API keys hardcoded in Power Automate flows or stored unencrypted in Dataverse configuration tables. Instead, use Azure Key Vault to store credentials, and authenticate your custom API using either managed identities (if running on Azure infrastructure) or client credentials with OAuth 2.0.

For incoming callers, restrict custom API invocation to authenticated principals. Dataverse allows you to define API access based on security roles, so only users or service principals with specific roles can trigger the connector. This enforcement happens at the Dataverse level before your code even executes. Verify the caller’s context in your connector function and implement role-based authorization on the specific action being requested: a connector that deletes records should require a different permission level than one that reads data.

When your custom API calls external services, use system-to-system authentication (OAuth 2.0 or client credentials) rather than user-delegated authentication, since the operation is happening on behalf of a data system, not an individual user. Implement automatic token refresh so that token expiration doesn’t silently cause failures hours or days later.

Building for Idempotency and Retry Resilience

External API calls fail. Networks drop. Timeouts occur. The question is not whether your connector will encounter failures, but whether it can recover gracefully. Idempotency is the mechanism that makes retry-safe: if the same request arrives twice, the second invocation produces the same result as the first, not a duplicate operation.

Design your custom API to accept a unique idempotency key from the caller (typically a GUID generated by Power Automate or the calling app). Store this key alongside the operation result in a call log table or external database. When a request arrives, check whether you’ve already processed this idempotency key. If you have, return the cached result. If not, proceed with the operation, and log the key and result before returning.

Implement exponential backoff on retries: if your first call to an external API fails, wait a short interval before retrying, then increase that interval on each subsequent retry. Don’t retry instantly; give the remote service time to recover. Set a maximum retry count so that transient failures don’t cause infinite loops consuming your connector’s quota.

Throttling and Quota Management

Dataverse limits the frequency at which custom APIs can be invoked, and external services often impose their own rate limits. A connector that doesn’t account for these constraints becomes a bottleneck that prevents entire workflows from running. Implement a simple quota tracking mechanism: record each API invocation timestamp and count how many have occurred in the current window (typically per minute or per hour, depending on your service’s SLA). If you’re approaching the limit, return a throttled response and let the caller back off, rather than making the call and receiving a 429 (Too Many Requests) error.

For external service throttling, catch the 429 response, extract the Retry-After header if provided, and schedule a delayed retry. If you’re calling a bulk operation API that accepts large batches, check the API documentation for per-request limits and batch your calls accordingly. A connector that submits a thousand records at once will be throttled; one that chunks the submission into batches of 100 will succeed and complete faster overall.

Error Handling and Observability

Custom API failures should be observable. Log every significant operation: request arrival, authentication success, external API calls, response parsing, and final result. Include context like the caller’s user ID, the operation type, and any relevant IDs (account numbers, transaction IDs). Store logs in Azure Application Insights or similar observability platform so you can query and alert on failure patterns.

Distinguish between retryable errors (network timeouts, 5xx responses from external services, transient database locks) and permanent failures (invalid input, authentication rejection, resource not found). For retryable errors, return a structured response that indicates the operation is incomplete and can be retried. For permanent failures, return an error message that allows the caller to understand what went wrong and take corrective action.

Implement a dead-letter mechanism: if a request fails all retries, log it to a separate queue or table for manual review. Don’t silently drop failed requests; make them visible so you can identify patterns and fix root causes.

Versioning and Backward Compatibility

Dataverse custom APIs evolve. You’ll add new input parameters, change output schemas, or refactor internal logic. A connector that breaks all dependent workflows when you release a new version creates friction. Design your API contract with versioning in mind: accept a version parameter or header, and handle multiple schema versions simultaneously for a transition period.

When changing an input parameter, add the new parameter as optional and default to the old behavior if it’s not provided. When changing output structure, add new fields alongside existing ones; don’t remove or rename fields in existing client code that depends on them. Document these contracts clearly so consumers know which versions are supported and which are deprecated.

Deployment and Testing

Deploy custom connectors via infrastructure-as-code (ARM templates, Terraform, or Azure Bicep) so that connector definitions, function code, and Key Vault policies are version-controlled and reproducible across environments. Test the full integration locally before deploying: mock external API responses, test your retry and timeout logic, and verify that error cases produce sensible output.

Integration tests should include scenarios like external API timeouts, malformed responses, and authentication failures, not just the happy path. Automated testing reduces surprise failures in production and gives you confidence that refactoring doesn’t break the contract.

Why This Matters in Practice

Teams that invest in robust connector architecture report 40-60% fewer integration-related incidents in production. When a downstream system experiences an outage, properly designed connectors degrade gracefully rather than cascading failure across dependent workflows. Idempotency and idempotent retry logic mean that transient network issues self-heal without manual intervention. Observability means you spot problems minutes after they occur, not hours later when someone reports a missing data sync.

Custom API connectors are foundational to a resilient integration strategy. The upfront investment in architecture patterns pays for itself multiple times over through reduced troubleshooting, faster onboarding of new integrations, and lower operational burden.

#CustomAPIConnectors #DataverseIntegration #IntegrationArchitecture #APIDesignPatterns #ExtensibilityProDev #AzureFunctions

Building Resilient Business Central Integrations: API Best Practices, Retry Logic, and Handling Data Inconsistencies During Cloud Migration

Migrating Business Central to the cloud exposes a fundamental truth about integration architecture: the patterns that work for on-premises systems begin to fail the moment you introduce unreliable networks, asynchronous processing, and distributed endpoints. APIs that behaved predictably behind a corporate firewall now encounter timeouts, throttling, transient failures, and the occasional complete outage. Your integration layer, which ran successfully in test environments and pilot rollouts, now shows its weaknesses under production load.

The challenge is not technical complexity alone. It is the gap between what developers know works locally and what actually survives in the cloud. Most Business Central integrations fail not because the API calls are incorrectly structured, but because integrations assume things will always work on the first try. In production, they rarely do.

Understanding the Real Failure Modes

When you move Business Central to the cloud, three failure patterns emerge almost immediately. First, transient failures: temporary network hiccups, momentary API unavailability, or throttling responses that a local system would never encounter. A three-second timeout that is completely fine for testing becomes unacceptable when the network is congested and Dataverse queues are deep. Second, partial failures: an integration processes 1,000 records, succeeds on 987, and encounters an error on record 988. You have data on both sides of a failure boundary, and no clear way to determine what actually synced and what did not. Third, cascading failures: one failing integration causes downstream systems to stop processing, which creates backpressure into Business Central, which causes performance to degrade further, which causes timeouts in yet another system.

These failures are not bugs in your code. They are properties of the cloud environment itself.

Implementing Retry Logic That Actually Works

The first line of defense is intelligent retry logic. Not the naive retry loops that double-size the problem by attempting the same request repeatedly without variation. Retry logic that understands which errors are worth retrying and which mean “give up, something is fundamentally wrong.”

Business Central API responses fall into three categories. Transient errors (HTTP 429, 503, 504, or occasional 500s with a retry-after header) should be retried with exponential backoff. Permanent errors (400, 401, 403, 404 for most resources, or explicit API validation failures) should fail immediately because retrying will not fix a bad request structure or missing resource. Ambiguous errors (some 500s, timeouts, connection resets) require judgment: retry a limited number of times, but not endlessly.

The standard pattern uses exponential backoff with jitter. After the first failure, wait 100 milliseconds before retry one. After the second failure, wait 200 milliseconds before retry two. After the third, wait 400 milliseconds. Add random jitter to prevent the thundering herd problem where all clients retry simultaneously and overwhelm the service. Most integrations should retry between three and five times for transient errors; beyond that, you are waiting longer than it would take to resolve the underlying issue through other means.

Implement retry logic at the API call level, not at the entire integration flow level. A single Business Central record update may require multiple API calls (fetch current version, validate changes, update). Retrying the entire flow risks re-processing successful steps. Retrying individual API calls gives you fine-grained control and better visibility into which step is failing.

Handling Partial Failures and Data Consistency

Transient retries help with temporary glitches, but they do not solve partial failure. If an integration processes 1,000 records from Business Central and sends them to a third-party system, and that process fails after 750 records are written, you now face a data consistency problem. The source and destination are out of sync, and your integration logic cannot restart cleanly because it does not know which records were actually written.

The solution is idempotent API design. Every request to Business Central should be structured so that if you send the exact same request twice, the second request has no effect (or produces the same result as the first request). Use unique external IDs or timestamps as natural idempotency keys. When pushing data from Business Central to a third-party system, tag each request with a correlation ID. If the request fails, retry with the same correlation ID. The third-party system should recognize the correlation ID and return “already processed” instead of creating a duplicate record.

For large batch integrations, implement a reconciliation step. After pushing a batch of records to an external system, fetch back a summary of what was actually written. Compare the summary to your input. If counts match and all IDs are present, mark the batch complete. If there are gaps, identify which specific records failed and retry only those. This approach trades latency for reliability.

Store intermediate state in Business Central itself. Add fields to track integration status: “pending,” “sent to system X,” “acknowledged by system X,” or “failed.” When an integration runs, it reads this status, processes only relevant records, and updates status as each step completes. If the integration crashes halfway through, restarting it picks up where it left off, processes the remaining records, and skips those that already succeeded. This pattern prevents re-processing and provides clear visibility into which records are stuck.

Throttling and Rate Limits

Business Central’s API has rate limits. The exact limits depend on your licensing tier and the specific endpoint, but the principle is universal: push too much traffic at once and the API will refuse new requests until load decreases. Integrations that do not respect rate limits can trigger automatic throttling that affects all users of your instance, not just the offending integration.

Implement a queue-based pattern. Instead of launching hundreds of parallel API calls, use a queue (even a simple in-memory queue if your integration is running in-process) to limit concurrency. Process ten records at a time, wait for all ten to complete (success or permanent failure), then move to the next ten. This approach reduces the peak load on Business Central and makes it easier to handle individual failures without cascading effects.

Monitor actual response times and throttling headers. When you receive a 429 (Too Many Requests) response or a retry-after header, respect it precisely. Do not ignore the guidance and retry immediately; you will only make the throttling worse. Instead, pause for the duration specified in the retry-after header (or use a conservative default such as five seconds), then resume.

Monitoring and Alerting

Integrations fail silently until you add visibility. Implement logging at the API call level. Log the request (sanitized of sensitive data), the response status, the response body (or at least the error message), and the timestamp. When debugging later, these logs will save hours of investigation.

Set up alerting for specific failure patterns. Alert when an integration processes zero records in a given run (sign that the data source is unavailable or the query is broken). Alert when the retry count exceeds a threshold (sign of persistent API issues or misconfigurations). Alert when partial failure rates exceed a tolerance (sign of data quality issues or upstream system problems). Alert when the integration cycle time increases significantly (sign of throttling or degraded performance).

Dashboards should show not just “integration succeeded” but data-level metrics: how many records were attempted, how many succeeded on the first try, how many succeeded after retries, how many failed permanently, and how many remain unprocessed. This granularity helps you distinguish between “the integration ran but made no progress” (upstream data issue) and “the integration ran but encountered failures” (API reliability issue or data validation failure).

Practical Migration Scenario

When migrating Business Central from on-premises to cloud, integrations are the first casualty. Third-party systems that connected to your on-premises instance now connect to the cloud version, often for the first time seeing realistic traffic patterns and reliability expectations. APIs that seemed solid in a test migration (where load and duration are both limited) suddenly show weaknesses.

Start migration by implementing basic retry logic and idempotency even if your on-premises integrations never needed it. Cloud deployments are not forgiving of naive assumptions. Monitor closely during the first week post-migration; this is when cascading failures are most likely to surface. Tune concurrency, retry thresholds, and monitoring based on what you observe.

For large migrations involving millions of records, implement staged batch processing. Process a subset of records (1,000 to 10,000 depending on record size), verify consistency, then move to the next batch. This reduces the blast radius of failure and makes partial recovery far simpler than trying to replay an entire production dataset.

Closing Perspective

Resilient integrations are not built by assuming best-case scenarios. They are built by understanding failure modes, implementing defenses against each one, and monitoring to catch problems before they cascade. Business Central’s cloud platform demands this discipline. Integrations built with this rigor will survive cloud migration, handle production load, and require far less firefighting than those built on the assumption that “it will just work.”

Hashtags: #BusinessCentralIntegration #CloudMigrationStrategy #APIRetryPatterns #DataConsistency #IntegrationArchitecture #ResiliencePatterns

Qualifying Leads Without Hiring: How AI-Powered Lead Scoring Transforms Pipeline Quality in Dynamics 365 Sales

Your sales director just walked into your office with a problem you’ve heard before. The pipeline looks healthy on paper: 200 open opportunities, a four-month sales cycle, quota tracking on pace. But when you drill into the numbers, half those opportunities are stalled waiting for competitor decisions. A quarter of them have had no contact in forty-five days. The team is spending fifteen hours a week researching prospective accounts before they even know if those companies are actually looking to buy. And the forecast is bleeding conservative because nobody trusts which deals will actually close.

The instinct is always the same: hire more sales development reps. But adding headcount for lead qualification work is expensive, slow to ramp, and ultimately extends rather than solves the core problem. What if your pipeline could automatically surface the leads most likely to convert, disqualify the ones that don’t fit, and qualify the ones with genuine buying intent, without adding a single person to the team?

This is what AI-powered lead qualification is now delivering in Dynamics 365 Sales, and it is shifting how intelligent sales organizations think about pipeline productivity.

How AI Lead Qualification Works

Dynamics 365 Sales 2026 introduces a set of capabilities that work together to automate lead qualification at scale. The system now runs a qualification routine that judges each new lead against two dimensions: ideal customer profile match and buying intent signals. Leads that fit your customer profile and show intent move automatically into qualified status. Leads without clear buying signals get disqualified before they consume a rep’s attention. The system learns from your historical conversion patterns, so the more data it sees, the more precise the qualification becomes.

The mechanics matter less than the outcome. What matters is that your sales team is no longer burning time on leads that were never going to convert. Instead, they spend time on the subset of prospects that actually fit your target customer and are genuinely evaluating a purchase.

Pipeline Clarity and Forecast Accuracy

For a mid-market software company with a global account base, moving from manual qualification to AI-powered disqualification often cuts the work-in-progress pipeline by thirty to forty percent. That doesn’t mean fewer real opportunities. It means fewer phantom deals cluttering the forecast and confusing priority.

Once leads are qualified, Dynamics 365 Sales can now generate research summaries automatically. The system pulls together news, company data, LinkedIn profile information, and any prior interaction history into a concise summary that a sales rep can read in three minutes instead of spending thirty minutes digging. That context changes how reps approach their first outreach. They sound informed rather than generic. Response rates typically improve by ten to fifteen percent when sellers lead with demonstrated knowledge of the prospect’s industry or current business situation.

The system can also now recommend which leads a rep should prioritize based on close probability. If a rep has fifty leads to work this week, Dynamics 365 will flag the ten most likely to convert based on intent signals, company fit, and engagement patterns. This sounds simple, but it forces a behavioral change: most sales teams still work on whatever came in most recently, not what is most likely to close. AI-powered prioritization makes opportunity cost visible, which pushes teams toward their highest-probability work.

Implementing Automated Qualification

The implementation is straightforward, but discipline matters. First, define your ideal customer profile explicitly. This is not guesswork. It should reflect actual company characteristics that historically correlate with closed deals: company size, industry, geographic region, technology infrastructure, and any firmographic signal that distinguishes your best customers from your churn cases. Dynamics 365 will use this profile to make the match. If you skip this step or guess, the system will perform no better than random.

Second, connect your lead data sources so Dynamics 365 can see buying intent signals. Lead sources might include your website form submissions, LinkedIn lead gen campaigns, marketing automation platform passes, inbound customer service inquiries, or third-party lead providers. The more sources the system can monitor, the more confident the intent signal becomes. A lead with a tracked website visit plus a LinkedIn connection plus a campaign engagement signal is more likely to be a real prospect than a single data point alone.

Third, start with a pilot. Run the qualification rules on your existing pipeline without changing status automatically. Review what would have been disqualified. Interview your team about false positives and false negatives. Adjust your profile or threshold. Then enable automatic disqualification on new leads only, and watch the results over a full sales cycle before adjusting qualification velocity.

Fourth, train your team on the new reality. Sales reps often bristle when they lose a lead they were mentally invested in. Make the disqualification rule transparent. Show them the profile. Explain which company attributes made the cut. Invite them to flag false negatives so you can refine. This is not the system removing their judgment. It is the system removing the low-probability work so they can focus on the high-probability work.

The Business Case for Automation

The financial impact is computable. If you currently employ one sales development rep per fifteen sales reps, and you can now reduce that ratio to one per twenty-five, you’ve freed up salary and associated costs. You’ve also reduced ramp time for new hires because junior reps can start on qualified leads rather than learning qualification first. You’ve cut the time from lead capture to first contact from three days to one. And you’ve improved forecast accuracy because your pipeline is no longer padded with deals that were always going to lose.

Most importantly, you have freed your team to do what only humans can do: build relationships, understand nuance, craft strategy. The machine handles scale and consistency. The people handle judgment and relationships.

Dynamics 365 Sales now makes this trade-off automatic. The companies that move on it first this year will build a competitive advantage that shows up in pipeline efficiency, forecast accuracy, and ultimately in quota performance.


About Routeget Technologies: Routeget helps enterprise organizations implement Dynamics 365 and Power Platform solutions that drive operational efficiency and accelerate digital transformation. Our team specializes in designing lead management workflows, configuring qualification models, and optimizing sales processes to maximize pipeline productivity and forecast accuracy. Whether you’re building your first Dynamics 365 Sales implementation or optimizing an existing one, we understand how to translate technology capabilities into measurable business outcomes.

#DynamicsSales #AILeadQualification #SalesPipeline #SalesAutomation #Dynamics365CRM #LeadManagement #SalesProductivity #PipelineManagement

Real-Time Financial Visibility: Building Executive Dashboards in Power BI for Multi-Entity Dynamics 365 Finance Consolidation

Most CFOs running multi-entity operations spend the first week after month-end chasing spreadsheets. Finance teams manually extract data from each business unit’s general ledger, reconcile intercompany transactions in Excel, convert currencies using outdated rates, and compile everything into a consolidated view. By the time the picture is complete, it’s already incomplete. Last-minute adjustments land in separate tabs. Questions come in about variances discovered too late to act on. The close takes longer than it should, and decision-makers lack the real-time visibility needed to respond to financial changes as they happen.

For large enterprises running multiple Dynamics 365 Finance instances across geographies and business units, this manual consolidation trap becomes unsustainable. Finance operations teams find themselves rebuilding the same consolidation model month after month, managing currency conversions manually, tracking intercompany eliminations in spreadsheets, and reconciling numbers that should flow automatically from the ERP. What should be a data plumbing problem becomes an operational bottleneck. Most organizations tolerate this because building a real-time consolidated reporting solution seemed to require custom development, significant infrastructure investment, or expensive third-party consolidation platforms.

Power BI paired with Dynamics 365 Finance and Dataverse changes this equation. Organizations can now build a consolidated financial reporting model that pulls live data from multiple Finance instances, handles currency conversion and intercompany elimination automatically, and surfaces real-time dashboards to executives without manual intervention. The consolidation happens once, in the data model, and updates continuously as transaction data refreshes. CFOs and finance leaders see current information minutes after period-end transactions post, not weeks after manual reconciliation.

The Multi-Entity Consolidation Challenge

Running multiple Dynamics 365 Finance instances across subsidiaries, regional operations, or business lines creates a legitimate technical problem. Each Finance instance owns its own general ledger, asset register, and transaction history. To produce a consolidated financial statement, all that data must flow into a single analytical model, but the consolidation steps are not trivial. Currency conversion must happen consistently, using the same exchange rates across all entities. Intercompany transactions between business units must be eliminated so they don’t inflate consolidated revenue or expenses. Entities must be organized into hierarchies reflecting how the business is actually structured, so executives can see group totals and also drill down to any subsidiary or region. Manual processes fail because they don’t scale; they introduce reconciliation errors; they create delays; and they make it difficult to revise forecasts or restate numbers when corrections come in.

Organizations that have built consolidated reporting the traditional way know the pattern. Finance operations builds a master consolidation workbook that imports data from each Finance instance via export files or API calls. Reconciliation logic lives in Excel formulas. Currency conversion rates are stored in a separate tab and updated monthly or quarterly by hand. Intercompany eliminations are calculated using trial balance line items and maintained as a separate adjustment table. Any change to the consolidation logic requires manual rework across multiple sheets, and any new metric requires rebuilding formulas for every historical period. The model becomes brittle, difficult to audit, and resistant to change.

Consolidated Reporting Architecture with Power BI and Dynamics 365 Finance

A modern approach uses Dataverse as the central hub and Power BI as the presentation layer. Dynamics 365 Finance instances stream transaction data into Dataverse, either through native connectors or through automated data pipelines. Dataverse holds the authoritative consolidated data model, which Power BI consumes to generate real-time dashboards and reports. The consolidation logic lives once, in Dataverse and Power BI’s data model, rather than scattered across Finance instances or spreadsheets.

The architecture starts with a date dimension and a shared calendar for all entities. This ensures that every entity reports using the same fiscal periods and exchange rates, even if local Finance instances use different calendar settings. Next comes an entity hierarchy dimension that models the organizational structure. At the leaf level are individual legal entities from each Finance instance. These roll up to regional groups, business units, or customer segments depending on how the organization is structured. The hierarchy enables drill-down reporting without building separate reports for each level.

A consolidated general ledger fact table holds balances and movements from all Finance instances, tagged with entity keys that link to the hierarchy dimension. Currency amounts are converted to a single group currency using daily exchange rates stored in a separate dimension table. Balances for each account appear at the transaction level, allowing rapid aggregation to any consolidation level without re-querying Finance instances. When a new entity joins the group, adding it to the hierarchy and including its GL data in the fact table updates all downstream reports automatically.

Building the Consolidation Model

The most critical step is properly dimensioning accounts and entities. Create a comprehensive chart of accounts dimension that includes all accounts from all Finance instances, mapped to a standard company account numbering scheme. This allows reports to compare like-for-like accounts across entities even when local Finance instances use different account codes. Assign each account a consolidation type: whether it’s a standard operational account, an intercompany account, or a special consolidation adjustment account. Intercompany elimination rules can then be applied based on account type rather than requiring manual identification of which transactions to eliminate each period.

Currency handling must be systematic. Store exchange rates in a dimension table keyed by currency pair, reporting date, and rate type. Use daily rates for spot conversions, average rates for P&L accounts covering the full period, and closing rates for balance sheet consolidation. This distinction is crucial for accurate consolidation. Query the rate table at report time to convert balances, so if rates are restated or corrected, all historical reports update without reprocessing data.

Intercompany elimination logic belongs in the data model, not in spreadsheets. In Dataverse or Power BI’s data transformation layer, create elimination rules that automatically match intercompany sales from one entity against intercompany purchases from another, then produce offsetting adjustment records. A company making a sale to a sister company creates both a revenue transaction and a receivable. The sister company records a purchase and a payable. The consolidation model matches these pairs and eliminates them. If new intercompany transaction types emerge, add them to the elimination rules; existing reports pick them up automatically on the next refresh.

Dashboard Design and Executive Metrics

The consolidated data model now supports multiple reporting views tailored to different audiences. Executive dashboards show the group P&L with actual versus budget variance, year-over-year comparison, and contribution by entity or business unit. A cash position dashboard tracks cash balances, operating cash flow, and forecast position across the group. A consolidation status dashboard shows which entities have reported, which are still open, and which have unreconciled differences.

For operational finance teams, detailed drill-down reports allow filtering by entity, time period, and account. Consolidation reconciliation reports highlight intercompany imbalances or currency mismatches. Financial statements (balance sheet, P&L, cash flow statement) can be generated on demand at any consolidation level, with trailing 12-month trends and forward forecasts.

The key metrics depend on the business, but standard consolidation dashboards include revenue and gross margin by entity and region, operating expense trends, cash position and days sales outstanding, and working capital by entity. Variance reports should compare actuals to budget and to prior year, showing not just variance amount but variance percentage and absolute impact on group net income.

Implementation and Ongoing Management

Success depends on data quality and governance. Ensure that period opening and closing processes in all Finance instances trigger data loads to Dataverse on a predictable schedule, so Power BI dashboards refresh automatically and executives always see current information. Set ownership for the consolidation model, including who approves new accounts, who maintains the entity hierarchy, and who validates that intercompany eliminations are complete. Document the consolidation rules and keep them alongside the data model so future teams can understand the logic.

Organizations that automate this process find that the consolidated close accelerates from weeks to days. Finance teams shift from manual reconciliation to exception handling and analysis. Forecasts can be updated more frequently because consolidation no longer requires manual effort. Executives have real-time visibility, enabling faster decision-making and earlier response to performance changes.

The path to consolidated financial visibility is no longer an enterprise software project or a spreadsheet wrestling match. Power BI and Dynamics 365 Finance provide the foundation. Dataverse provides the model. The effort is measured in weeks, not months, and the result is a system that gets better and faster with each month’s close, while freeing finance teams to focus on analysis rather than data wrangling.


Routeget Technologies helps enterprise organizations design and implement consolidated financial reporting solutions using Dynamics 365 Finance and Power BI, accelerating financial close cycles and delivering real-time executive visibility across multi-entity operations.

#DynamicsFinanceConsolidation #PowerBIAnalytics #CFODashboard #FinancialVisibility #ERP #MultiEntityReporting #FinanceTransformation #DataConsolidation

Optimizing Power BI Premium Capacity Management: Resource Allocation, Query Performance, and Cost Governance

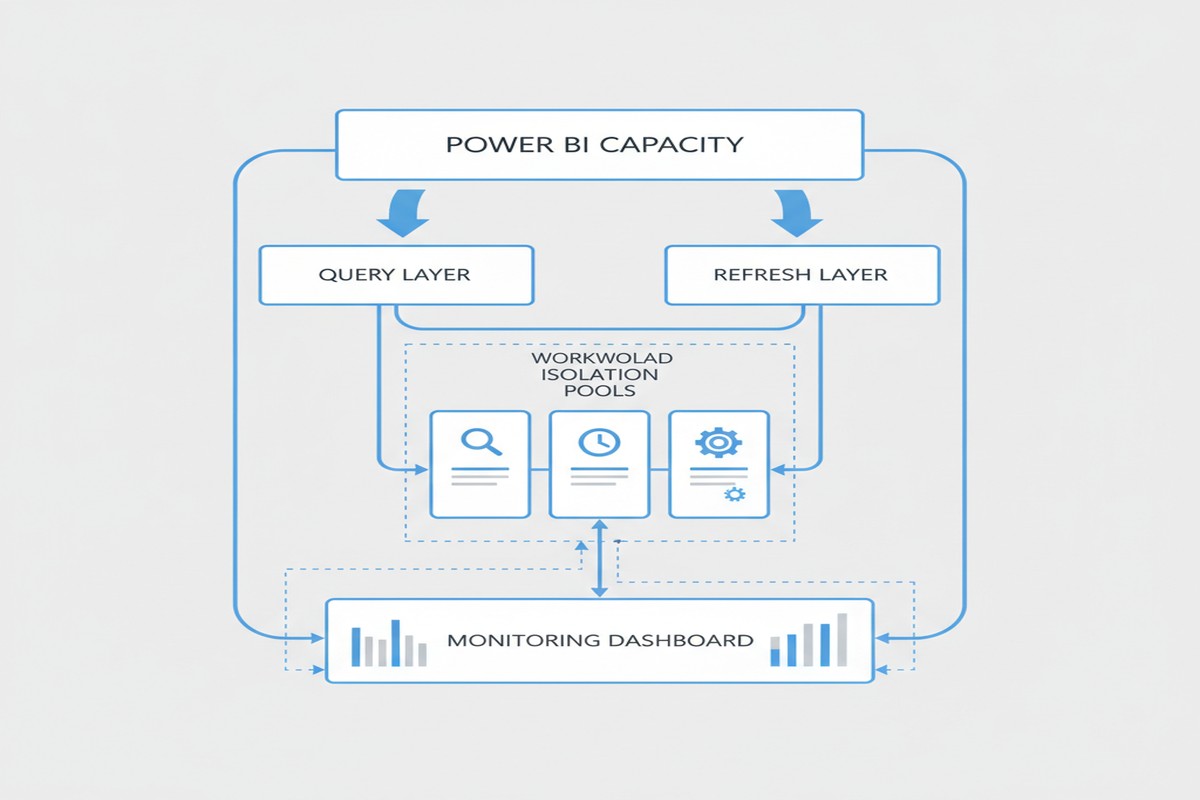
Power BI Premium capacity management dashboard

Most organizations deploying Power BI Premium start with a single capacity and assume the cloud handles the complexity. Within months, they encounter the same problem: reports that were responsive at launch now run slowly, refresh jobs fail intermittently, and the monthly capacity bill climbs without corresponding value. The issue is rarely that Premium itself is insufficient; it is that few teams understand how Premium actually allocates compute, how to monitor that allocation in real time, and how to design workloads that fit the capacity constraints.

This is a technical guide for BI architects, developers, and capacity administrators who need to build production Power BI environments that deliver consistent performance and predictable costs. We will work through capacity planning, workload isolation, query optimization, and the operational patterns that prevent Premium environments from becoming expensive, unreliable systems.

Understanding Power BI Premium Capacity Architecture

Power BI Premium provides a dedicated cloud resource that isolates your organization’s workloads from the multi-tenant shared capacity used by Pro license users. That isolation is the primary value, but it also introduces responsibility: you now own the capacity planning, performance tuning, and cost management that shared capacity users delegate to Microsoft.

A Premium capacity is measured in compute units called virtual cores, or v-cores, priced in tiers from 1 core upward. Each v-core provides a fixed compute budget allocated across query execution, data refresh, and paginated reporting. The budget refreshes hourly. When workloads exceed that budget, Premium applies throttling: queries slow, refreshes delay or fail, and users experience degradation until the current hour’s budget resets.

This is not a failure mode; it is intentional. The throttling is meant to protect the capacity from runaway queries and ensure consistent service levels across all workloads sharing the same capacity. The problem occurs when capacity is undersized relative to the workload, or when workloads are poorly designed and consume disproportionate resources relative to their value.

Capacity Sizing and Workload Assessment

Build an honest inventory of what will run on the capacity. Most organizations plan around a single “average” workload size, then are shocked when peak usage overwhelms that estimate. A realistic approach profiles three scenarios: peak refresh, peak query, and a mixture of both.

Refresh costs depend on semantic model size, refresh frequency, and incremental refresh strategy. A 10 GB model refreshed hourly demands very different compute than a 1 GB model refreshed daily. Measure actual memory consumption and query duration during a test refresh, then multiply by expected concurrency during peak hours.

Query costs are driven by semantic model size, query complexity, and concurrent users. A simple filtered report consumes far less capacity than complex matrix visuals with millions of cross-filtered cells. DirectQuery and real-time data are more expensive than import mode. The capacity is effectively governed by the least-optimized workload; a single slow dashboard can trigger throttling affecting all operations.

Instrument capacity usage with Power BI’s Metrics app or Admin API, measure actual consumption over a production month, and size to the 95th percentile of observed usage, not the average. Most organizations reduce capacity cost by 20 to 40 percent by simply understanding what they actually use.

Workload Isolation and Semantic Model Design

Premium capacity provides a feature called “workload isolation” that allows you to assign different workloads to separate compute pools with independent resource budgets. The most common pattern is to separate refresh workloads from query workloads, or to isolate a single expensive application from the rest of the organization’s reports.

At a technical level, workload isolation is effective because refresh and query operations compete for the same compute and memory on a shared capacity. During peak refresh hours, query performance degrades because the refresh jobs are consuming available vcore budgets. By isolating refresh into a dedicated workload with its own budget, you guarantee that queries will never starve, and vice versa.

Power BI capacity architecture and workload isolation

The decision to isolate workloads depends on whether the cost of isolation (you lose some capacity efficiency by dedicating separate resource pools) is outweighed by the benefit (guaranteed performance for critical queries or refreshes). For most organizations, a single isolated refresh workload is sufficient. Rarely do you need more than two or three workload isolations.

Semantic model design influences capacity efficiency dramatically. A single large model shared across many reports is more efficient than many small, redundant models duplicating the same dimensions and facts. However, large models are harder to maintain, permission, and optimize. Most organizations converge on a “hub-and-spoke” design: a small number of enterprise semantic models (3 to 6) owned by a central BI team, serving as the foundation for business-unit-specific reports and dashboards.

Query Optimization and Real-Time Analysis

Two mechanisms significantly impact capacity consumption: query folding in Power Query and relationship optimization in the semantic model.

Query folding pushes filter and aggregation operations down to the data source rather than pulling all data into Power BI for in-memory filtering. A properly folded query reduces data movement and memory consumption by orders of magnitude. The tradeoff is complexity: folded queries must be executable by the source system, ruling out some Python/R transformations.

For large data volumes or high refresh frequencies, investing in query folding often yields the highest return, reducing refresh time from hours to minutes and freeing up capacity for other workloads.

Relationship optimization includes careful cardinality settings, appropriate many-to-many relationships, and explicit measure branching. A model with thousands of ambiguous relationships forces Power BI to perform expensive relationship resolution on every query. Clean data models with clear relationships and explicit measures are far more efficient.

For real-time scenarios, DirectQuery and Push Datasets lower capacity consumption. DirectQuery queries the source directly but adds latency; the source must respond in hundreds of milliseconds. Push Datasets allow external systems to push data at API speeds, avoiding refresh windows entirely. Both require careful architecture to avoid swamping the data source.

Operational Monitoring and Cost Governance

Premium capacity consumption is measured via the Power BI Admin portal’s Metrics app and the Power BI API, which exposes activity logs and CPU/memory consumption by operation. The Admin API enables custom monitoring dashboards and automated alerting when thresholds are breached.

A mature Premium environment includes automated monitoring for capacity utilization trends, workloads consuming abnormal resources, failed refresh operations, and per-workload cost attribution enabling chargeback.

Governance practices include: quarterly capacity review boards, documented naming standards for models and reports, capacity impact assessment before onboarding new workloads, and performance SLAs backed by monitoring.

Organizations that skip this governance layer often find their Premium environment becomes a black box: costs rise unpredictably and performance degrades without clear cause. Operational tooling and governance practices pay for themselves many times over.

Common Pitfalls and Practical Next Steps

The most common mistakes are: sizing capacity based on theoretical maximum load rather than measured reality, allowing unoptimized queries and large unfolded data imports to run without constraint, mixing enterprise semantic models with personal workloads on the same capacity, and ignoring refresh scheduling and allowing refreshes to overlap.

The path forward is straightforward: measure actual consumption with the Metrics app or Admin API over a production month, document the peak periods and peak workloads, assess which workloads could be optimized with query folding or model redesign, and then right-size the capacity and implement workload isolation for any critically important refresh or query workload. Follow up monthly with utilization reviews and alert on workloads that consume anomalously high resources.

For teams implementing Premium for the first time, a pragmatic starting point is often a single 2 or 4 vcore capacity, one workload isolation for refreshes, and a simple monitoring dashboard tracking hourly utilization. From there, optimization and growth are data-driven: measure, identify bottlenecks, optimize, and only increase capacity when the measured peak approaches the capacity ceiling. Organizations that follow this pattern consistently report 30 to 50 percent lower costs than those that simply throw capacity at performance problems without understanding the underlying workload characteristics.


Routeget Technologies has guided dozens of organizations through Premium capacity design and optimization, from initial sizing through multi-capacity deployments with sophisticated governance. If your Premium environment is facing performance challenges or cost surprises, the root cause is almost always visibility and deliberate design, not capacity limitations.


#PowerBIPremium #CapacityManagement #DataLakeArchitecture #QueryOptimization #PowerBIGovernance #EnterpriseBI #DataEngineering

Implementing Predictive Lead Scoring in Dynamics 365 Sales: Technical Architecture and Model Training

Sales organizations face a persistent challenge: most leads that enter the pipeline lack sufficient qualification signals, forcing sales teams to invest time and resources pursuing prospects with poor conversion odds. Rule-based lead scoring—manual point assignments for job title, company size, or email opens—falls apart at scale, especially when customer engagement patterns across multiple touchpoints remain isolated in separate systems. The result is wasted effort and extended sales cycles.

Dynamics 365 Sales offers native integration with AI Builder, which enables development teams to build predictive lead scoring models trained on historical customer engagement data within the platform. Unlike black-box SaaS solutions that require data export and integration overhead, this approach keeps customer data within your Dynamics 365 boundary, maintains compliance with data governance policies, and surfaces predictions directly in the sales interface where they influence deal qualification and prioritization decisions. Building and deploying a production predictive model requires understanding how to structure training data, configure model parameters, evaluate model performance, and integrate scoring results back into the sales workflow.

Structuring Data for Predictive Model Training

Predictive lead scoring models rely on historical examples of leads that converted versus those that did not. AI Builder requires a minimum of 100 historical examples in your training dataset, though 500 to 1,000 examples typically produce more stable, generalizable models. You must first decide which entity will serve as your training target. Most implementations use the Lead entity itself (marking leads as qualified or disqualified) or the Opportunity entity (marking won versus lost deals). The decision hinges on your business process: if you qualify and convert leads to opportunities separately, train on the Opportunity entity to capture conversion likelihood; if you operate a lead-only model, train on the Lead entity with a binary outcome field (for example, “Lead Status” with values “Qualified” or “Disqualified”).

Once you select your training target, identify the feature columns (predictive variables) that your model will use. These typically include demographic attributes (company industry, company size, lead source), behavioral signals (number of emails opened from marketing campaigns, days since last engagement, number of form submissions), and engagement frequency metrics (contact attempts, phone call outcomes). The model works best when features represent actual customer interactions or attributes that vary meaningfully between converted and unconverted leads. Avoid including target-correlated features (for example, do not include “Deal Closed” as a feature when trying to predict deal closure, since this creates circular reasoning).

Preparing and Configuring the Prediction Model

Within Dynamics 365 Sales, navigate to AI Builder and select “Binary Prediction” (a classification model that predicts one of two outcomes, such as “will convert” or “will not convert”). Upload your training dataset by pointing AI Builder to the entity containing your historical lead or opportunity records. The system automatically detects columns, infers data types, and suggests features. You must then map the target column (the outcome you want to predict) and select which additional columns should be used as features. AI Builder’s interface allows you to include or exclude specific columns; exclude highly correlated columns, columns with sparse data (more than 50 percent missing values), and columns that lack predictive power (for example, internal notes fields that contain unstructured text).

Configure model parameters by specifying the threshold at which the model will classify a lead as “high likelihood to convert.” By default, AI Builder uses 0.5 (50 percent) as the decision boundary, meaning the model must predict a probability of at least 0.5 for the lead to be marked as high-scoring. In practice, you may want to lower this threshold to catch more potential deals (increasing recall at the cost of some false positives) or raise it to be more conservative (increasing precision at the cost of missing some opportunities). Your choice depends on your sales process: if your team has capacity to follow up on all leads, a lower threshold catches more opportunities; if your team is constrained, a higher threshold focuses effort on the most promising leads.

Evaluating Model Quality and Performance

Before deploying a model to production, evaluate its performance using standard classification metrics. AI Builder provides precision, recall, F1 score, and AUC (area under the receiver operating characteristic curve) after training. Precision measures the proportion of predicted high-scoring leads that actually convert; recall measures the proportion of actual converts that the model correctly identified as high-scoring. Aim for a balanced combination: a model with high precision but low recall catches few opportunities, while a model with high recall but low precision floods your team with low-probability leads. The F1 score (harmonic mean of precision and recall) offers a single metric summarizing this balance. An AUC above 0.7 generally indicates useful discrimination; above 0.8 indicates strong model quality.

Importantly, evaluate your model on held-out test data (records not used during training), not on the training set itself. AI Builder automatically splits your dataset for this purpose. If your model performs well on training data but poorly on test data, your model may be overfitting to noise in the training set; in this case, simplify the model by removing non-predictive features or retraining with more diverse historical examples.

Integrating Scoring Results into Sales Workflows

Once your model passes quality checks and you publish it to production, integrate the scoring results into your sales process. AI Builder allows you to invoke the model on demand via a Power Automate cloud flow or as a plug-in on the Lead or Opportunity form. The most common pattern is a Power Automate cloud flow triggered when a lead is created, which calls the prediction model, captures the predicted probability and classification, and updates a custom “Predicted Score” column on the lead record. This score then becomes available in lead views, pipeline analytics, and mobile applications.

From a user experience perspective, surface the predicted score prominently on the sales dashboard and lead detail form so sales reps see the qualification confidence at a glance. Many organizations color-code leads based on predicted score (green for high probability, yellow for medium, red for low) to guide qualification decisions. Some teams implement a business rule that automatically assigns high-scoring leads to senior reps and routes low-scoring leads to junior reps for initial outreach, thereby optimizing resource allocation based on deal likelihood.

Monitoring Model Drift and Retraining

Predictive models do not remain accurate indefinitely. As your sales process evolves, customer behavior changes, or market conditions shift, the patterns your model learned during training may no longer reflect current conditions (a phenomenon called model drift). Set a quarterly or semi-annual schedule to assess model performance on recent data. If accuracy metrics decline by more than 5 to 10 percent compared to the original test results, retrain the model on a fresh dataset that includes recent leads and opportunities. AI Builder enables retraining as a straightforward operation: select the published model, update the training dataset to include new records, and republish.

Document your model’s feature importance (which inputs the model weights most heavily) so your organization understands what drives scoring decisions. AI Builder provides a feature importance report showing which columns contribute most to the model’s predictions. If your model places high importance on a feature that represents potential data quality issues (for example, “Days Since Last Email” if email tracking is inconsistent), address the data quality problem to improve future model iterations.

Common Pitfalls and Practical Guidance

A frequent mistake is training a model on imbalanced data, where one outcome (for example, “converted”) is much rarer than the other. If 80 percent of your historical leads did not convert, the model may learn to simply predict “no conversion” for all leads, achieving high accuracy but zero business value. To address this, explicitly configure class weights in your training setup (telling the model that conversions should be weighted more heavily) or oversample the minority class during data preparation.

Another pitfall is treating the model as a black box. Sales leaders sometimes interpret predicted scores as absolute probabilities rather than relative rankings. Communicate clearly that a predicted score of 0.8 does not mean “this lead has an 80 percent chance to close”; it means the model ranks this lead among the highest-probability prospects relative to others in your pipeline. The model’s value lies in comparative ranking and resource allocation, not in absolute probability estimation.

Finally, involve your sales leadership and operations team in model design and interpretation. If your organization has complex sales processes (for example, different qualification rules for enterprise deals versus mid-market deals), consider building separate models for each segment rather than a single global model. Similarly, if significant changes occur (a major product launch, a shift in target customer, an acquisition), retrain your model on data that reflects these new conditions.

Conclusion

Predictive lead scoring powered by AI Builder and native Dynamics 365 integration transforms how sales teams allocate effort and prioritize opportunities. By systematically capturing historical conversion patterns and translating them into forward-looking probability estimates, your organization gains visibility into which prospects justify investment and which may be better pursued later. The technical implementation is straightforward for most organizations: structure historical lead and opportunity data, configure an AI Builder classification model, evaluate performance on test data, and integrate results through Power Automate and the sales interface. Retraining quarterly and involving sales leadership in model governance ensures your scoring system remains effective as market conditions and customer behavior evolve. Routeget Technologies has deployed predictive lead scoring across dozens of Dynamics 365 Sales implementations, helping organizations increase pipeline accuracy and accelerate sales velocity through data-driven qualification.

#PredictiveLeadScoring #AIBuilderDynamics365 #SalesIntelligence #DynamicsSalesAI #CustomerInsights #PredictiveAnalytics #SalesEnablement #DynamicsImplementation #EnterpriseAI #SalesDataStrategy

Implementing Predictive Lead Scoring in Dynamics 365 Sales: Technical Architecture and Model Training

Sales organizations face a persistent challenge: most leads that enter the pipeline lack sufficient qualification signals, forcing sales teams to invest time and resources pursuing prospects with poor conversion odds. Rule-based lead scoring—manual point assignments for job title, company size, or email opens—falls apart at scale, especially when customer engagement patterns across multiple touchpoints remain isolated in separate systems. The result is wasted effort and extended sales cycles.

Dynamics 365 Sales offers native integration with AI Builder, which enables development teams to build predictive lead scoring models trained on historical customer engagement data within the platform. Unlike black-box SaaS solutions that require data export and integration overhead, this approach keeps customer data within your Dynamics 365 boundary, maintains compliance with data governance policies, and surfaces predictions directly in the sales interface where they influence deal qualification and prioritization decisions. Building and deploying a production predictive model requires understanding how to structure training data, configure model parameters, evaluate model performance, and integrate scoring results back into the sales workflow.

**Structuring Data for Predictive Model Training**

Predictive lead scoring models rely on historical examples of leads that converted versus those that did not. AI Builder requires a minimum of 100 historical examples in your training dataset, though 500 to 1,000 examples typically produce more stable, generalizable models. You must first decide which entity will serve as your training target. Most implementations use the Lead entity itself (marking leads as qualified or disqualified) or the Opportunity entity (marking won versus lost deals). The decision hinges on your business process: if you qualify and convert leads to opportunities separately, train on the Opportunity entity to capture conversion likelihood; if you operate a lead-only model, train on the Lead entity with a binary outcome field (for example, “Lead Status” with values “Qualified” or “Disqualified”).

Once you select your training target, identify the feature columns (predictive variables) that your model will use. These typically include demographic attributes (company industry, company size, lead source), behavioral signals (number of emails opened from marketing campaigns, days since last engagement, number of form submissions), and engagement frequency metrics (contact attempts, phone call outcomes). The model works best when features represent actual customer interactions or attributes that vary meaningfully between converted and unconverted leads. Avoid including target-correlated features (for example, do not include “Deal Closed” as a feature when trying to predict deal closure, since this creates circular reasoning).

**Preparing and Configuring the Prediction Model**

Within Dynamics 365 Sales, navigate to AI Builder and select “Binary Prediction” (a classification model that predicts one of two outcomes, such as “will convert” or “will not convert”). Upload your training dataset by pointing AI Builder to the entity containing your historical lead or opportunity records. The system automatically detects columns, infers data types, and suggests features. You must then map the target column (the outcome you want to predict) and select which additional columns should be used as features. AI Builder’s interface allows you to include or exclude specific columns; exclude highly correlated columns, columns with sparse data (more than 50 percent missing values), and columns that lack predictive power (for example, internal notes fields that contain unstructured text).

Configure model parameters by specifying the threshold at which the model will classify a lead as “high likelihood to convert.” By default, AI Builder uses 0.5 (50 percent) as the decision boundary, meaning the model must predict a probability of at least 0.5 for the lead to be marked as high-scoring. In practice, you may want to lower this threshold to catch more potential deals (increasing recall at the cost of some false positives) or raise it to be more conservative (increasing precision at the cost of missing some opportunities). Your choice depends on your sales process: if your team has capacity to follow up on all leads, a lower threshold catches more opportunities; if your team is constrained, a higher threshold focuses effort on the most promising leads.

**Evaluating Model Quality and Performance**

Before deploying a model to production, evaluate its performance using standard classification metrics. AI Builder provides precision, recall, F1 score, and AUC (area under the receiver operating characteristic curve) after training. Precision measures the proportion of predicted high-scoring leads that actually convert; recall measures the proportion of actual converts that the model correctly identified as high-scoring. Aim for a balanced combination: a model with high precision but low recall catches few opportunities, while a model with high recall but low precision floods your team with low-probability leads. The F1 score (harmonic mean of precision and recall) offers a single metric summarizing this balance. An AUC above 0.7 generally indicates useful discrimination; above 0.8 indicates strong model quality.

Importantly, evaluate your model on held-out test data (records not used during training), not on the training set itself. AI Builder automatically splits your dataset for this purpose. If your model performs well on training data but poorly on test data, your model may be overfitting to noise in the training set; in this case, simplify the model by removing non-predictive features or retraining with more diverse historical examples.

**Integrating Scoring Results into Sales Workflows**

Once your model passes quality checks and you publish it to production, integrate the scoring results into your sales process. AI Builder allows you to invoke the model on demand via a Power Automate cloud flow or as a plug-in on the Lead or Opportunity form. The most common pattern is a Power Automate cloud flow triggered when a lead is created, which calls the prediction model, captures the predicted probability and classification, and updates a custom “Predicted Score” column on the lead record. This score then becomes available in lead views, pipeline analytics, and mobile applications.

From a user experience perspective, surface the predicted score prominently on the sales dashboard and lead detail form so sales reps see the qualification confidence at a glance. Many organizations color-code leads based on predicted score (green for high probability, yellow for medium, red for low) to guide qualification decisions. Some teams implement a business rule that automatically assigns high-scoring leads to senior reps and routes low-scoring leads to junior reps for initial outreach, thereby optimizing resource allocation based on deal likelihood.

**Monitoring Model Drift and Retraining**

Predictive models do not remain accurate indefinitely. As your sales process evolves, customer behavior changes, or market conditions shift, the patterns your model learned during training may no longer reflect current conditions (a phenomenon called model drift). Set a quarterly or semi-annual schedule to assess model performance on recent data. If accuracy metrics decline by more than 5 to 10 percent compared to the original test results, retrain the model on a fresh dataset that includes recent leads and opportunities. AI Builder enables retraining as a straightforward operation: select the published model, update the training dataset to include new records, and republish.

Document your model’s feature importance (which inputs the model weights most heavily) so your organization understands what drives scoring decisions. AI Builder provides a feature importance report showing which columns contribute most to the model’s predictions. If your model places high importance on a feature that represents potential data quality issues (for example, “Days Since Last Email” if email tracking is inconsistent), address the data quality problem to improve future model iterations.

**Common Pitfalls and Practical Guidance**

A frequent mistake is training a model on imbalanced data, where one outcome (for example, “converted”) is much rarer than the other. If 80 percent of your historical leads did not convert, the model may learn to simply predict “no conversion” for all leads, achieving high accuracy but zero business value. To address this, explicitly configure class weights in your training setup (telling the model that conversions should be weighted more heavily) or oversample the minority class during data preparation.

Another pitfall is treating the model as a black box. Sales leaders sometimes interpret predicted scores as absolute probabilities rather than relative rankings. Communicate clearly that a predicted score of 0.8 does not mean “this lead has an 80 percent chance to close”; it means the model ranks this lead among the highest-probability prospects relative to others in your pipeline. The model’s value lies in comparative ranking and resource allocation, not in absolute probability estimation.

Finally, involve your sales leadership and operations team in model design and interpretation. If your organization has complex sales processes (for example, different qualification rules for enterprise deals versus mid-market deals), consider building separate models for each segment rather than a single global model. Similarly, if significant changes occur (a major product launch, a shift in target customer, an acquisition), retrain your model on data that reflects these new conditions.

**Conclusion**

Predictive lead scoring powered by AI Builder and native Dynamics 365 integration transforms how sales teams allocate effort and prioritize opportunities. By systematically capturing historical conversion patterns and translating them into forward-looking probability estimates, your organization gains visibility into which prospects justify investment and which may be better pursued later. The technical implementation is straightforward for most organizations: structure historical lead and opportunity data, configure an AI Builder classification model, evaluate performance on test data, and integrate results through Power Automate and the sales interface. Retraining quarterly and involving sales leadership in model governance ensures your scoring system remains effective as market conditions and customer behavior evolve. Routeget Technologies has deployed predictive lead scoring across dozens of Dynamics 365 Sales implementations, helping organizations increase pipeline accuracy and accelerate sales velocity through data-driven qualification.

#PredictiveLeadScoring #AIBuilderDynamics365 #SalesIntelligence #DynamicsSalesAI #CustomerInsights #PredictiveAnalytics #SalesEnablement #DynamicsImplementation #EnterpriseAI #SalesDataStrategy

Data Loss Prevention Policy Implementation in the Microsoft Cloud: Balancing Security and Business Agility

Enterprise data governance dashboard showing Data Loss Prevention policies and security classifications

Data Loss Prevention Policy Implementation in the Microsoft Cloud: Balancing Security and Business Agility

Most IT leaders inherit DLP implementations that operate as expensive friction generators—slow approval workflows, frustrated business units, widespread policy exceptions—rather than effective data protection. The challenge isn’t building DLP capability; it’s building DLP that actually works in practice without crippling business operations.

Dynamics 365, Power Platform, and the broader Microsoft cloud stack move data at volume and velocity that traditional perimeter security cannot monitor. Spreadsheets with customer data flow through Power Automate workflows. Finance teams share GL account details via Teams. Sales consultants upload competitor files to Power Apps. Without intentional DLP governance, sensitive information leaks become statistical inevitability. Yet overly rigid DLP policies drive shadow IT and workarounds that are far less controlled.

Microsoft cloud security architecture showing Dataverse environments with DLP policy layers and data classification zones

The tension is real: organizations need DLP policies that reduce breach risk and meet compliance requirements without triggering business user revolt. That balance comes from a three-layer approach starting with clear data classification, moving to segmented policy enforcement by workload, and ending with monitoring and exception workflows that catch real breaches without generating approval fatigue.

Understanding Microsoft Dataverse and Power Platform Data Classification

DLP in Microsoft Power Platform starts with a deceptively simple question: what data sensitivity level is stored in this Dataverse environment, and what external services should or should not have access to it?

Every Dataverse environment has an assigned DLP classification set by administrators. Out of the box, the options are “Business” (default), “Non-Business,” and “Unclassified,” each restricting which connectors can be used. An environment marked “Business” cannot call consumer-grade cloud services or public APIs by default. This classification system is the foundation of Power Platform DLP, and many organizations accept it unchanged. That is a mistake.

The actual tension surfaces immediately: a “Business” environment using default DLP classification prevents organizations from using essential connectors. A finance team might need to integrate Power Apps with Stripe for payment processing. A supply chain team needs logistics APIs to track shipments. A sales team needs to send customer records to third-party analytics services. These connectors fall outside default Business classification rules, but blocking them outright prevents legitimate business operations. Conversely, loosening policies to allow these services introduces real data exposure risk—customer payment details flowing to external processors without oversight.

Solving this tension requires abandoning the one-size-fits-all “Business” classification and instead segmenting Dataverse environments by actual data sensitivity and connector requirements. This segmentation becomes the policy framework that supports DLP without strangling innovation.

Segmenting Dataverse Environments by Sensitivity and Connector Requirement

Organizations that manage DLP effectively typically operate multiple Dataverse environments, each with a distinct DLP classification matched to the data sensitivity and connector requirements it actually holds.

Consider a typical enterprise structure: one environment holds Dynamics 365 Finance and Operations data (accounting records, GL accounts, intercompany transactions, supplier information). This is genuinely sensitive data subject to audit requirements and regulatory controls. This environment should be classified as “Business” under a restrictive DLP policy that prevents connectors to external consumer services, cloud file storage, or public APIs. Finance teams access this data through specifically designed Power Apps and Power Automate workflows within DLP constraints.

A second environment holds Power Apps and Power Automate flows that integrate Power Platform with external partner systems—logistics APIs, payment processors, analytics services, and public cloud connectors. This environment accepts connectors to these external services because data sensitivity and use case require it. However, no direct connection to the sensitive Finance and Operations environment is allowed. This environment operates under less restrictive DLP classification because data flowing through it is either lower sensitivity (customer feedback, survey responses, transaction history) or appropriately scoped to external partners.

A third environment is explicitly designated for proof-of-concept work and rapid prototyping. DLP is minimal here because solutions graduate to production environments with full governance only after validation and security review.

This segmentation approach solves the core tension: business users get connector freedom they need, but that freedom is appropriately scoped to environments holding data at the sensitivity level those connectors can safely access. A payment processor connector in the production environment holding Finance data would be irresponsible. The same connector in an e-commerce environment is reasonable.

Implementing Segmented DLP Without Over-provisioning

Segmentation only works when combined with clear governance over which data moves between environments and under what conditions. An organization running multiple Dataverse environments without data movement controls creates the worst outcome: complex DLP policies that block internal workflows and fail to prevent the very data exposure they were meant to restrict.

Governance begins with explicit data classification at the Dataverse table level. Every table in Finance and Operations environments should be tagged as “Highly Sensitive” (GL accounts, supplier data, payroll), “Internal” (historical transactions, internal metadata), or “Public” (product catalogs, customer-facing data). That classification becomes enforceable through data loss prevention rules: a table tagged “Highly Sensitive” cannot be queried by Power Automate flows in non-Business environments. This discipline prevents accidental sensitive data exposure through incorrectly scoped flows.

Second, organizations need exception workflows that actually work. Some business processes require sensitive data to flow to external systems. A customer requesting data export needs records to move outside the enterprise. A third-party audit requires financial table access. Building manual exception workflows—where business stakeholders request exceptions and security reviews them—turns DLP into a shared responsibility. Exception tracking also provides visibility into actual risk: organizations seeing hundreds of requests for sensitive data access learn something valuable about their risk profile.

Monitoring, Alerts, and Real-Time Response

DLP policy design matters, but enforcement and monitoring matter more. An organization with well-designed DLP policies but no monitoring ends up with policies that are either unenforced or inconsistently applied.

Microsoft Dataverse and Power Platform generate audit logs of DLP violations, but by default those logs are difficult to access in real time. Organizations that manage DLP effectively set up automated monitoring through Azure Monitor or Microsoft Sentinel, translating Dataverse audit logs into actionable alerts. A spike in violations from a specific user, a flow attempting repeated queries of sensitive tables, or patterns suggesting data exfiltration should generate alerts that security teams investigate within hours.

Real-time response capability is the difference between DLP as theoretical control and actual protection. When monitoring detects suspicious patterns, the ability to immediately disable Power Automate flows, revoke access to specific environments, or restrict Dataverse tables can interrupt a breach in progress. Without response capability, DLP monitoring is largely forensic—useful for understanding what happened after detection, not for preventing breaches.

Moving Forward: From DLP Compliance Theater to Actual Data Protection

DLP policy implementation is not a one-time project. Organizations that maintain effective data protection continuously adjust policies based on new business processes, security incidents that expose gaps, and platform evolution.

The organizations that manage this effectively treat DLP policy design as a shared responsibility across security, compliance, and business leadership. Policies are transparent—business stakeholders understand constraints and when exceptions can be requested. Exceptions are tracked regularly, signaling whether policies are appropriately calibrated. Monitoring is continuous and actionable, giving security teams real-time visibility into whether DLP policies actually protect data or just generate friction.

When these elements align, DLP stops being a security checkbox and becomes a capability that genuinely reduces sensitive data exposure risk without strangling business operations that depend on data movement and integration.

At Routeget Technologies, we have implemented data loss prevention governance across Dynamics 365 and Power Platform deployments in organizations ranging from mid-market to enterprise. Our approach begins with your current data sensitivity landscape and connector requirements, then builds segmented DLP policies and monitoring infrastructure that protect what matters most while enabling the business agility your teams need.

#DLPGovernance #DataLossPrevention #CloudSecurity #DynamicsCloudArchitecture #PowerPlatformGovernance #DataProtection #ComplianceAutomation #Dynamics365Security #MicrosoftDataverse #EnterpriseCloudGovernance