Copilot Studio Custom Plugins and Data Connectors: Building Autonomous Business Agents with Real-Time Contextual Data

Your finance team has spent three weeks training a customer service agent in Copilot Studio. The agent understands policies, escalation rules, and even recognizes when a refund needs approval. But when a customer asks “what’s my account balance,” the agent returns nothing. It can talk about balance policies but has no access to customer data. The agent is conversationally complete but operationally useless.

This is the gap between conversational AI and autonomous business agents. Copilot Studio’s out-of-the-box connectors handle common scenarios: sending emails, posting to Teams, querying your knowledge base. For production agents that need to access real-time business data, resolve customer records in your ERP, or trigger workflows across your business systems, those built-in connectors become constraints. Custom plugins and data connectors transform Copilot Studio from a chatbot framework into a true autonomous agent platform, but building them requires understanding how agent context flows, how your agent manages token budgets, and where to capture data errors before they undermine agent decisions.

The Context Problem: Why Standard Connectors Fail at Scale

Most first-generation Copilot Studio implementations treat the agent as stateless. A customer asks a question, the agent formats a response, and the interaction ends. This works for FAQ-style use cases. But autonomous agents operate differently: they maintain context across multiple turns, make decisions based on customer data, and sometimes initiate actions without explicit user prompts.

Standard connectors (email, Teams, SharePoint) assume a request-response pattern. An agent sends a message, the connector executes, and returns a simple success/failure result. Real business data is rarely that clean. A customer might have multiple open orders, pending payments, or conflicting account statuses. Your agent needs to surface relevant context, reason about it, and sometimes ask clarifying questions before taking action.

This is where custom plugins become essential. Instead of the agent making separate connector calls for customer name, then order status, then payment history, a custom plugin can accept the customer ID and return a structured data object containing relevant account context. That single call reduces latency, keeps the agent’s reasoning clear, and prevents token bloat from multiple sequential API calls.

Designing Custom Plugins for Agent Reasoning

A custom plugin is an HTTP endpoint that your agent can call just like a built-in connector. The key difference is control: you define what data the agent receives, what context it needs to reason about, and how errors are handled.

Start by identifying the discrete business questions your agent needs to answer. Not “get all customer data,” but specific queries: Is this customer eligible for a refund? What is their current account balance? Are there open support tickets that might conflict with this request? Each question becomes a separate plugin endpoint, not because complexity is bad, but because focused endpoints make agent behavior predictable and testable.

The plugin endpoint should return structured JSON with fields relevant to the agent’s reasoning. If your agent is deciding whether to approve a refund, the response should include refund policy eligibility (yes/no), the customer’s refund history, any pending disputes, and the maximum allowable amount. Don’t include fields the agent doesn’t need to reason about. Noise in the response increases token consumption and can confuse the agent’s decision-making.

Error handling inside your plugin matters more in an agent context than in traditional API design. If a query times out or returns unexpected data, the agent should receive a structured error response that explains what went wrong and suggests recovery options. For example, if your ERP system is temporarily unavailable, don’t return a 500 error that breaks the agent flow. Return a structured JSON response indicating the system is unavailable and suggesting the agent offer to escalate or retry in a moment. The agent can then reason about recovery.

Integration Patterns: Real-Time Data Without Token Bloat

Once you have custom plugins defined, the architectural pattern determines whether your agent scales or bogs down. The worst pattern is sequential data fetching: the agent calls a plugin to fetch the customer record, then parses the response to extract the customer ID, then calls another plugin to fetch order status, then calls a third plugin to fetch payment information. Each call requires network latency, adds to the agent’s conversation history, and consumes tokens.

Instead, design plugin endpoints that return compound data structures. A single “Get Customer Context” endpoint returns customer basics, their recent orders, their payment status, and their support ticket count in one call. The agent makes one request, receives contextual depth, and proceeds with reasoning. This pattern is faster, cleaner, and uses far fewer tokens.

Pagination and large result sets present a different challenge. If your agent is querying a list of orders, you don’t want to return the last five years of transaction history. Use query parameters to scope the data: return only orders from the last 30 days, or only orders with a status of “pending” or “shipped.” Let your plugin do the filtering, not the agent.

Authentication between Copilot Studio and your custom plugins should use standard methods. API keys work but require secure storage. OAuth2 with service principals is stronger for production scenarios; the agent’s host application authenticates on behalf of the agent, and your plugin validates that token. This prevents agents from accidentally exposing customer data to unauthorized callers.

Managing Agent State and Conversation Context

Custom plugins change how you think about agent state. In stateless chatbot scenarios, the agent has no memory between conversations. But autonomous agents often need to carry information across multiple turns within a single conversation: the customer’s account status, the decision the agent made earlier, the action it’s waiting for approval to execute.

Copilot Studio stores conversation history in its context, and that history is sent to your agent (and to your custom plugins) with each call. This is powerful, but it has cost: longer conversations mean larger context payloads, which consume tokens faster and can hit context window limits on the underlying model. You need to design your plugins to be efficient with the conversation state.

One pattern is to have your plugin accept the conversation ID or session ID as a parameter. Your plugin stores intermediate agent reasoning (what decision it reached, what additional data it needs) in a database keyed by that session. On the next turn, when the agent calls the plugin again, it can retrieve what it learned earlier without re-transmitting that entire history through the conversation context. This pattern keeps conversation history lean while letting your agent maintain reasoning across multiple turns.

Common Implementation Mistakes

The most frequent mistake is over-fetching data. An agent asking “should I approve this refund” doesn’t need the customer’s entire account history for the past five years. It needs refund policy eligibility, recent return patterns, and any pending disputes. Plugins that return too much data waste tokens and sometimes confuse the agent’s reasoning by introducing irrelevant information.

The second mistake is poor error handling. If a custom plugin is down or returns a 500 error, and your agent doesn’t have instructions for handling that failure, the entire agent flow breaks. Every plugin call should have defined error responses and recovery instructions. Your agent should be able to handle temporary unavailability gracefully.

The third mistake is designing plugins without testing agent behavior. A plugin might work perfectly when called directly via an HTTP client, but behave unexpectedly when an agent calls it. Test your plugins with actual agent conversations, not just REST clients. The agent’s phrasing, context window, and token constraints create scenarios your unit tests won’t catch.

Building Toward Production Readiness

Autonomous agents succeed when they combine narrow, focused capabilities with reliable data access. Start by building one custom plugin that answers a specific business question well. Test it in a real agent conversation. Monitor the plugin’s response times, error rates, and whether the agent’s decisions improved compared to built-in connectors.

From there, add plugins incrementally. Each one should serve a specific function and integrate with your agent’s existing conversational flow. Design them for both speed and clarity, so your agent can reason about the data quickly without getting lost in irrelevant context.

The difference between a chatbot and an autonomous agent is data access and decision-making. Custom plugins provide the data; your agent design determines whether it reasons about that data effectively. Getting the plugin architecture right early saves months of iteration later.

Routeget Technologies has implemented custom Copilot Studio agents for finance teams, customer service operations, and supply chain coordination, each with specialized plugins connecting to ERP, CRM, and custom business systems. We work through the architectural decisions and integration patterns that let your agents scale to real production workloads.


#CopilotStudioPlugins #AIAgentArchitecture #DataConnectors #CustomIntegrations #AutonomousAgents #PowerPlatform #EnterpriseAI #AgentDesignPatterns


Power Automate Error Handling: Building Resilient Cloud Flows That Don’t Fail Silently

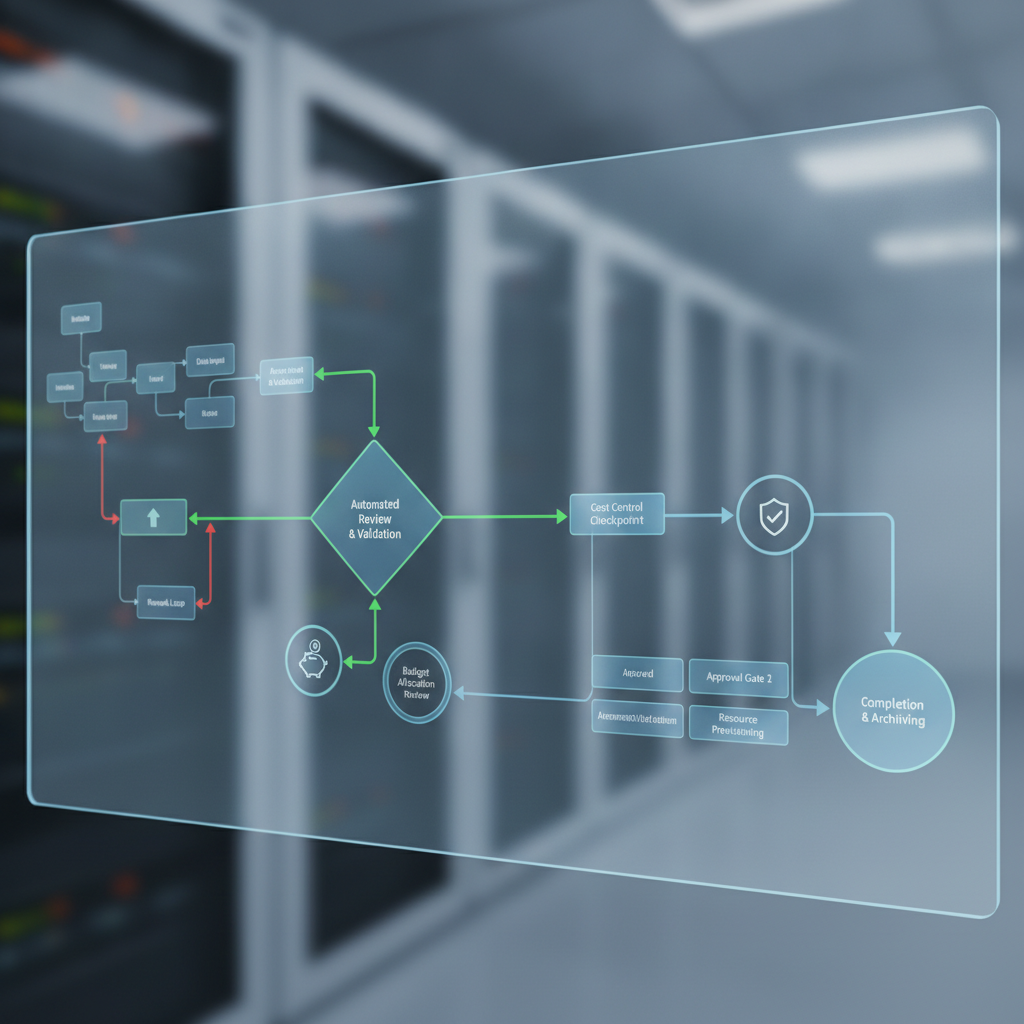
Power Automate Error Handling Architecture Diagram

You launch a critical approval workflow into production, and for two months it runs without obvious issue. Then Finance calls: a vendor invoice sits stuck in limbo, and the escalation that should have fired never arrived. You check the flow history. The run shows “Succeeded,” but the approval task was never created, and no notification reached anyone. Silent failure, the kind that eats hours of investigation and delays payment cycles.

This scenario repeats across organizations deploying Power Automate at scale. The default error handling behavior in cloud flows is permissive and forgiving, designed to let flows complete even when individual actions fail. This is convenient during development but disastrous in production, where a missing HTTP response, a timing issue on an approval task creation, or an unexpected data format in a downstream system turns silent into undetected. The flow completes successfully by the application’s measure, but business logic never executes. Error handling in Power Automate is not a nice-to-have feature for robustness; it is the architectural foundation that separates production-ready automation from toy scripts.

Understanding Default Behavior and Why It Fails

By default, Power Automate treats a failed action like a skip. If an “Create an approval” action times out or receives an unexpected response, the flow continues to the next step. Conditional actions branch on the previous action’s status, but most flows don’t include that branching. An approval might never materialize, yet the flow proceeds as if it succeeded, sending payment confirmations or triggering downstream systems based on assumptions about work that never completed. Notification actions often sit at the end of a flow, so if an error occurs mid-stream and the flow halts before reaching the notification step, no one knows failure occurred. The inbox has no warning. The flow history shows green. Days pass before someone manually discovers the orphaned record.

This happens because Power Automate distinguishes between a failed action and a failed flow. A single failed action can leave the flow in a half-completed state that still reports success. Production systems need explicit acknowledgment of failure, not a default assumption of continuation. Scope actions, try-catch patterns, and notification strategies are the techniques that transform Power Automate from a convenient desktop automation tool into a reliable production system.

Scope Actions and Error Handling Tiers

The core building block for error handling in Power Automate is the Scope action, which wraps a logical group of steps and exposes four possible outcomes: Succeeded, Failed, Skipped, and TimedOut. A Scope action acts like a transaction container. If any step inside fails, the Scope itself fails, and you can then use the Configure run after property to branch on that failure state. Configuring a Scope so that downstream actions only run if the Scope succeeded is the first layer of error handling.

For critical workflows, organize Scopes into layers. A “happy path” Scope contains the main logic (create approval, send notification, update records). A “validation” Scope runs first and checks input data before attempting the main workflow. An “error handling” Scope runs only if the happy path fails, containing steps to log the error, notify a human, and roll back any partial state. This layering makes the flow’s intent explicit: if the happy path fails for any reason, the error layer kicks in. If the error layer itself fails (for example, the notification system is temporarily down), that failure is also visible and can trigger escalation.

Implementing Try-Catch Patterns

A try-catch pattern in Power Automate maps to a Scope (try) followed by a Configure run after rule (catch). After a critical Scope completes, even if it failed, configure the next action to run only if the Scope failed. Inside this catch block, add steps to capture what went wrong (log the error message and flow context), notify the appropriate person or system, and decide whether to retry or abandon. For approval workflows, a catch block might check if the approval was actually created (by querying Dataverse) before sending a notification. If the approval does not exist, log the specific error and notify a supervisor that manual intervention is needed.

The catch block should not attempt to continue the main business logic. Trying to recover by re-running the failed step or guessing at a default value introduces risk. Instead, catch blocks should focus on observation (logging), communication (notification), and escalation (routing to a person or alert system). This keeps the error path simple and auditable. When a catch block executes, someone should know about it, and the flow should stop rather than creating inconsistent downstream state.

Technical Team Reviewing Power Automate Error Handling Strategy

Handling Timeouts and Asynchronous Gaps

Timeouts are a class of failure distinct from logic errors. An action that calls an external API might exceed Power Automate’s timeout thresholds (2 minutes for cloud flows, 10 minutes for desktop flows) through no fault of the flow’s logic. A synchronous HTTP action to a slow third-party API will reliably timeout in production if that API experiences latency. Asynchronous patterns are the solution: instead of waiting synchronously, send an asynchronous request and poll for the result, with explicit limits on retries and elapsed time. A Scope action wrapping an HTTP POST followed by a repeat-until loop that polls for completion gives you control over timeout behavior.

Approval actions introduce similar asynchronous complexity. When you create an approval task, the action returns immediately, but the approval itself is time-consuming. If you try to check the approval’s response in the next step and the approver has not yet responded, your flow will either wait forever or timeout. Structure approval flows so that the approval creation is one Scope, any actions that depend on the approval response are in a separate step or flow triggered asynchronously (via a Power Automate Connector trigger or notification), and the main flow completes after the approval is created. This prevents the flow from blocking indefinitely and makes it clear which parts of the workflow are synchronous and which are asynchronous.

Notification and Escalation Strategies

An error that no one knows about is still an error. Every production flow needs explicit error notification. For non-critical flows, a daily digest of failed runs might suffice, sent to a service account inbox where admins can triage them. For critical workflows, errors should trigger immediate notification to an on-call engineer or supervisor through a dedicated notification system (Teams, Slack, email, or an alert system). Configure the notification to include the flow name, the step that failed, the error message, the affected record ID (invoice number, order ID), and a direct link to that flow run in the Power Automate admin portal so the engineer can investigate immediately.

For approval workflows, escalation is the second notification layer. If an approval sits unapproved for 24 hours, send a reminder to the approver. If it sits for 48 hours, escalate to the approver’s manager or a shared mailbox. Implement this using scheduled cloud flows that query the approval status in Dataverse and send conditional notifications based on elapsed time. This prevents approvals from silently stalling because someone’s mailbox was full or the approval notification was missed.

Testing Error Paths in Production

Error handling code that is never exercised is dead code. Most flow testing focuses on the happy path because that is where the visible business logic lives. But the error path is where reliability lives. Before pushing a critical flow to production, explicitly test failure scenarios: trigger an HTTP action to a nonexistent endpoint and confirm the error is caught and logged; simulate a timeout by adding a delay action and running it during off-hours; delete a required record midway through the flow to force a lookup failure; confirm that notifications fire and escalations trigger correctly. Production flows should have a pre-launch checklist that includes error path testing, not just happy path verification.

Common Architecture Mistakes

Avoid storing error handling logic in separate flows triggered by error notifications. Flows that handle errors should be part of the same versioned flow or called as child flows with explicit control flow. Separate error-handling flows that run asynchronously can miss new versions and become stale. Avoid generic retry logic that re-runs a failed action without understanding why it failed. Some errors are transient (network timeouts) and justify a retry; others are permanent (schema mismatch, missing data) and will retry indefinitely without fixing the root cause. Inspect the error message before deciding to retry. Finally, avoid logging errors to an unmonitored inbox. Logs that accumulate without review are useless. Use a proper telemetry system or a regularly tended shared mailbox so errors are actually seen and investigated.

Building Production Confidence

Error handling is not overhead added to a flow once it reaches production; it is the architecture that transforms automation from convenience to reliability. Flows that handle errors explicitly, notify on failures, and separate happy-path logic from error-path logic run predictably and build confidence with stakeholders who depend on them. The investment in error handling upfront, through scope actions, try-catch patterns, and notification strategies, is what separates a flow that your team trusts from a flow that your team monitors anxiously.


At Routeget Technologies, we architect Power Automate solutions that scale with production demands, building error handling and resilience into automation from the start rather than bolting it on after failures occur. If you’re deploying automation at enterprise scale and need guidance on error architecture or flow governance, our Power Platform specialists can help design systems your team can maintain and trust.

#PowerAutomate #ErrorHandling #CloudFlows #PowerPlatformDevelopment #ResilientAutomation #ApprovalWorkflows #PowerAutomateArchitecture

Real-Time Dashboard Design in Power BI: When Live Connections Hurt Performance and What to Use Instead

Many organizations treat “real-time reporting” as a checkbox requirement rather than a technical decision. A director asks for a dashboard showing “live data” without specifying what live actually means, and teams immediately configure Direct Query connections to Dynamics 365 databases. Six months into production, those dashboards crawl under concurrent user load, and the director’s dashboard times out during CFO presentations.

The problem isn’t live data itself. It’s that live data in Power BI comes in distinct flavors, each with different performance trade-offs, and choosing the wrong flavor destroys performance at scale. This article shows which real-time architecture fits which scenario, and when you’re better off abandoning the real-time requirement altogether.

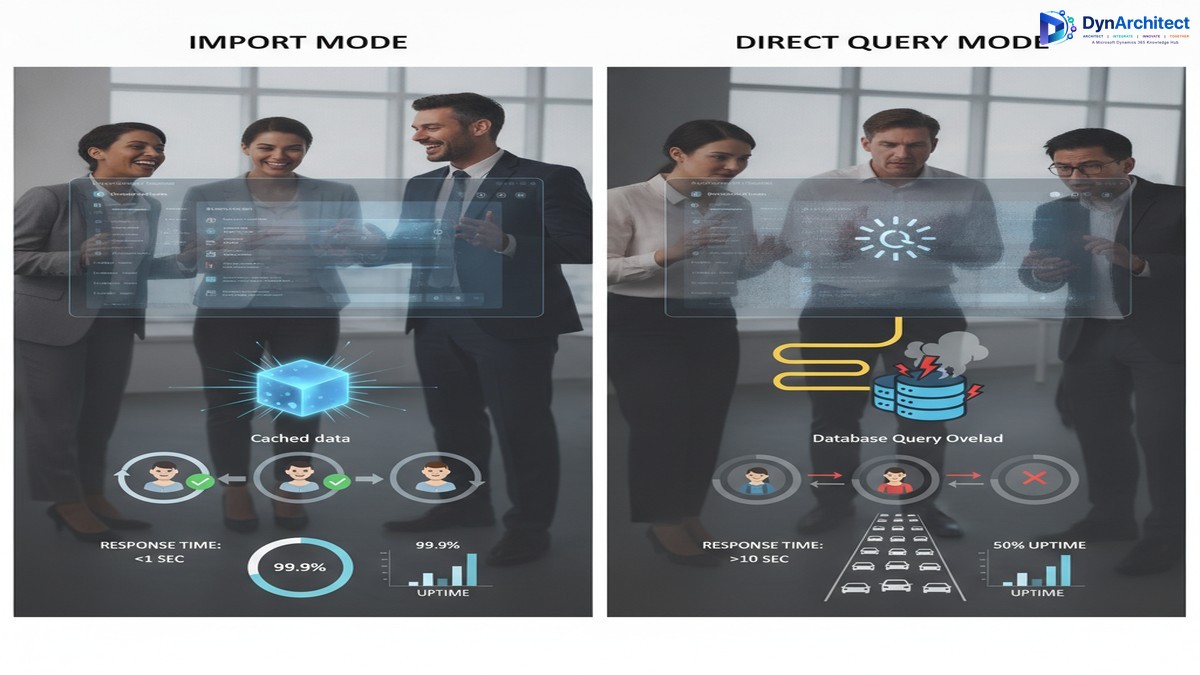
Power BI Import Mode vs Direct Query performance comparison dashboard

Understanding the Real-Time Spectrum

First, clarify what “real-time” means in your context. Most organizations conflate three different concepts: data freshness (how old is the data?), query latency (how fast does a dashboard query execute?), and update frequency (how often is new data available?). These are not the same.

A dashboard showing data refreshed every 15 minutes queries a cached aggregate table with instant response times. Alternatively, a dashboard querying a live Dynamics 365 database via Direct Query has zero latency from the database, but if 20 people open the dashboard simultaneously, queries become serialized and latency skyrockets. The “real-time” label obscures the actual performance characteristics.

Start by asking: How old can data be before a decision changes? A sales dashboard 10 minutes stale versus current-to-the-second rarely affects sales decisions. A finance dashboard showing expense reports can be 4 hours stale. A customer service dashboard showing ticket volume can be 30 minutes stale. Only a handful of use cases actually require sub-minute freshness.

Once you’ve anchored the actual freshness requirement, choosing an architecture becomes simpler.

Direct Query and Its Hidden Costs

Direct Query sends every user interaction as a live database query. No caching, no aggregation, just immediate translation of dashboard filters into T-SQL. On paper, this sounds ideal: always current, no data warehouse, minimal complexity.

In practice, Direct Query introduces three performance traps.

First, concurrent users crush database performance. When ten analysts open a Power BI dashboard simultaneously, Direct Query generates ten database queries in parallel. Add 15 more analysts, and suddenly transaction processing slows because the database is saturated with analytical queries. Power BI’s server-side caching helps only for identical queries. If each analyst filters by a different region, caching provides no benefit. You end up purchasing database resources purely for analytical load.

Second, complex calculations become prohibitively expensive. Direct Query works best for simple filtering and aggregation. The moment you need running totals, customer rankings, or month-over-month comparisons, you’re pushing calculations to the database or computing them in Power BI’s layer, both adding latency or complexity.

Most Dynamics 365 finance dashboards need these calculations. A cash flow dashboard ranking open invoices by days overdue, or a revenue dashboard showing year-to-date totals by region and product, requires a data warehouse layer or pre-computed calculations. With Direct Query, you can’t pre-compute anything because data always changes.

Third, network latency compounds with every filter. Each dashboard interaction triggers a new database query and network round-trip. In a data warehouse scenario, filtering might take microseconds (querying an in-memory cache). With Direct Query, it’s network latency plus database query time, often 2-5 seconds per interaction. A dashboard requiring five clicks to drill into detail takes 25+ seconds if each click pauses for network response. Users notice immediately.

Power BI analyst working with dashboards in modern office environment

Import Mode with Scheduled Refresh: The Workhorse

Import mode loads data into Power BI’s in-memory model, which you refresh on a schedule. For most enterprise dashboards, this is correct.

A finance dashboard might refresh every 4 hours. A sales dashboard every 30 minutes. A customer service dashboard every 15 minutes. Those intervals sound stale, but usually align with actual business decision cycles. A finance controller doesn’t make working capital decisions every 15 minutes; 4-hour refresh is sufficient. A sales manager checks pipeline daily, not per minute; hourly refresh is adequate.

Import mode’s advantage is simplicity at scale. Load data once, then serve the cached model to hundreds of concurrent users with zero database load. Your Dynamics 365 database doesn’t know dashboards exist. Add 50 new dashboard users tomorrow without anyone noticing performance change.

The model also compresses dramatically. A Dynamics 365 Finance general ledger with 50 million line items might compress to 500 megabytes in Power BI. A Direct Query approach queries the full 50 million rows every time a user opens a dashboard; an Import model loads once and serves fast queries.

Within Import mode, you gain access to calculated columns, measures, and DAX for sophisticated analytics. Calculate running totals, percentile rankings, trend lines, and complex financial metrics without touching the source database.

The trade-off is data freshness. If refresh happens every 4 hours and a user opens a dashboard at 3:59 AM, they see data from midnight. For operational dashboards needing sub-hourly updates, this becomes a problem. For strategic dashboards, it’s almost never an issue.

Hybrid and Push Approaches for Selective Real-Time

When some dashboard components need near-live data and others can be stale, hybrid approaches split the difference. A sales pipeline dashboard might import historical pipeline data (which changes slowly) but stream real-time opportunity counts from an API endpoint. These work only when you cleanly separate stale and live components.

Push Datasets allow you to stream data into Power BI in real-time, bypassing the database. A Dynamics 365 Finance workflow or custom service pushes event data (new orders, posted invoices, received payments) directly to Power BI as it happens. This is genuinely real-time and scales well because pushing is asynchronous.

Push Datasets make sense for operational dashboards tracking events: a manufacturing floor dashboard showing production events, an order-processing dashboard tracking fulfillment, or customer service dashboards displaying incoming tickets. They don’t work for analytical dashboards computing aggregates across historical data.

Choosing the Right Architecture

Start with business need, not technology.

For dashboards where data can be 4+ hours stale (finance reporting, executive dashboards, strategic analytics), use Import mode with nightly or 4-hour refresh. Build sophisticated DAX calculations. Serve unlimited concurrent users. This is your default.

For dashboards where data must be no more than 30-60 minutes stale (sales dashboards, customer service metrics, supply chain), use Import mode with more frequent refresh. Most dashboards fall here.

For operational dashboards tracking events (manufacturing, fulfillment, incident response), use Push Datasets if you can instrument the source system, or Dataflow with 5-10 minute refresh if you can’t.

For the rare sub-minute freshness requirement, use Direct Query, but explicitly cost the decision: calculate additional database licenses and query load needed. When directors hear “real-time reporting costs an additional 500k in database infrastructure,” cost-benefit calculations usually change.

Common Mistakes

Don’t design for yesterday’s requirements. Dashboards created for three analysts often serve 50 within a year. Design with Import mode and you’re prepared for scale.

Don’t confuse data freshness with query performance. A 4-hour-old dataset queried instantly feels faster than live data queried in 5 seconds.

Don’t use Direct Query because documentation says it’s for “live data.” Use it only after consciously calculating database costs.

The path forward is simple: pick the slowest freshness requirement you can justify, then design using Import mode. Scale up refresh frequency only if performance and business case demand it. Most organizations that follow this pattern end up with fast, stable dashboards and minimal infrastructure cost.

About Routeget Technologies: Routeget specializes in enterprise analytics and reporting architecture for Microsoft Dynamics 365 and Power BI implementations. Our consulting team helps organizations design dashboard strategies that balance business requirements with infrastructure costs, ensuring analytics scale with your organization without creating database performance bottlenecks.

#PowerBIDashboard #PowerBIPerformance #DataVisualization #RealTimeDashboards #PowerBIDirectQuery #PowerBIArchitecture #DataAnalytics

Automated Workflow Sprawl in Power Automate: How Finance Leaders Can Prevent the Cost Explosion Most Orgs Don’t See Coming

Finance leaders across enterprise organizations are discovering an uncomfortable truth about Microsoft Power Automate adoption: the platform that promises to eliminate manual work through low-code automation often becomes a hidden cost center once it reaches production scale. The culprit is not a licensing pricing error, but a governance gap. Organizations typically purchase Power Automate licenses based on anticipated user volume or a modest number of bots, only to find themselves facing exponential cost growth within 12 to 18 months. The reason is straightforward: they underestimated the volume of workflows that would be built, and they failed to establish guardrails to manage that sprawl before it spiraled into a compliance and budget problem.

The early signs appear incremental. A department discovers Power Automate and begins automating quote-to-invoice workflows. Finance enablement builds flows for journal entry generation. HR creates robotic process automation bots to automate onboarding. Each initiative seems reasonable in isolation, delivering clear ROI. But without a centralized finance governance model that tracks cost per flow, enforces retry limits, and manages premium connector usage, cloud flow sprawl becomes the default outcome. By the time the Finance organization sees the full bill, they are managing hundreds of flows across dozens of teams, with no clear visibility into which flows are actually delivering value and which are simply consuming API request capacity.

This article is written for finance leaders, IT directors, and CFOs who are either experiencing unexpected Power Automate cost overruns or want to prevent them as they scale.

The Real Cost of Power Automate is Not on the Price Sheet

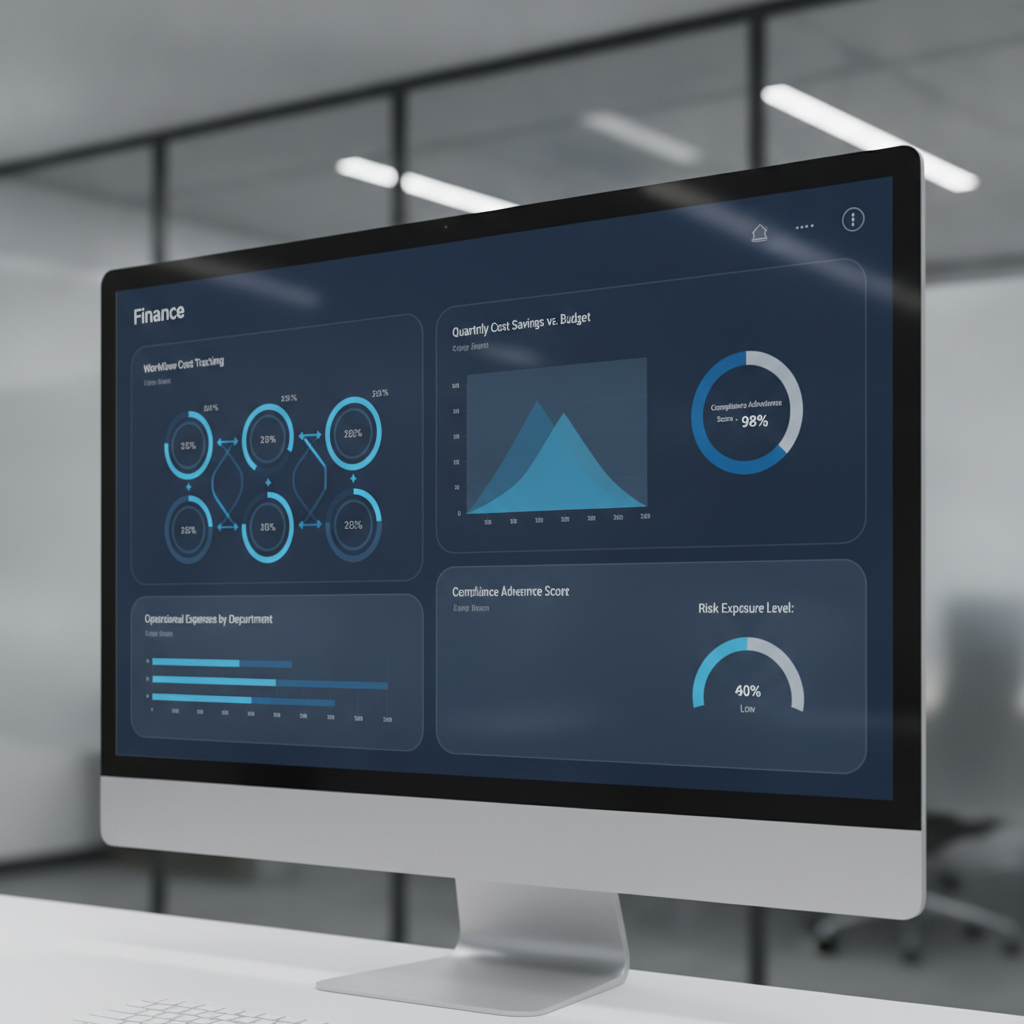
Finance dashboard showing cost controls and governance metrics for Power Automate workflows

Microsoft’s published Power Automate pricing tells one story: Premium plans at $15 per user per month, Process bot licenses at $150 to $215 per bot per month, plus premium connector fees for integrations to enterprise systems like Salesforce, SAP, or ServiceNow. That is the anchor price, but not the total cost most organizations experience at scale.

Research consistently shows that real total cost of ownership runs 3 to 5 times the base licensing cost once automation moves beyond pilot into operational deployment. The gap exists because several cost drivers are not visible at purchase time and are not managed as line items on initial procurement requests.

First is the cost of premium connectors. The base Power Automate license includes only standard connectors. Flows that touch enterprise systems like Salesforce, Oracle, ServiceNow, or SAP require a premium connector license, adding per-user or per-flow costs on top of the base plan. In a large organization with dozens of automation use cases spanning Finance, Operations, and Sales, premium connector usage becomes a pervasive second licensing layer.

Second is the API request limit structure. Each Power Automate license allocation includes a fixed daily quota of API requests. Flows running at high frequency can exhaust this quota, causing throttling and execution failures. Organizations can either optimize flows to use fewer API calls (expensive in consultant time) or purchase additional request capacity (expensive in licensing). This cost is often discovered in production, not in the procurement phase.

Third is the cost structure of unattended robotic process automation. Finance automation commonly involves unattended desktop flows, which require a separate Process bot license ($150 to $215 per bot per month). Organizations frequently begin with a pilot of two or three bots, then discover they need five, ten, or twenty bots to handle all manual processes suitable for RPA. Each additional bot is a monthly recurring cost, and growth correlates directly with how aggressively the organization pursues automation.

Fourth is the cost of monitoring and governance infrastructure. Cloud flows fail. Bots encounter edge cases and incomplete data. At large scale, organizations need investment in monitoring solutions, error logging platforms, and governance tooling, all adding to total cost of ownership beyond the base license itself.

How Workflow Sprawl Becomes a Budget Crisis

Workflow automation governance and approval gates visualization

The progression from pilot to sprawl follows a predictable pattern, rooted in organizational behavior and governance gaps rather than platform limitations.

Phase one is the success case. A team automates a business process with measurable results. Leadership approves expansion. Teams that see the success submit their own automation requests.

Phase two is the consumption phase. Requests accelerate. Finance IT or a Center of Excellence builds flows and bots in higher volume, focused on delivery velocity and process improvement, not cost per flow or API efficiency. An organization that budgeted for twenty flows but ended up with eighty viewed this as adoption success, not flagged as a problem. The assumption is that cloud platforms are cheap and infinite, an assumption that fails at the scale of hundreds of concurrent flows in a large enterprise.

Phase three is the recognition phase. The monthly software license bill arrives 50 percent higher than expected. Or the Power Automate admin console shows API request quotas being exhausted regularly. Or an audit discovers flows created without any approval process.

Phase four is the governance crisis. By this point, the organization has hundreds of flows and dozens of bot licenses in production. Rationalizing them is difficult because so many business processes depend on them. The choices become unattractive: freeze new automation requests, accept runaway costs, or undertake an expensive flow rationalization effort.

The real cost of sprawl extends beyond license fees. It includes operational overhead, wasted automation effort on redundant processes, API request overages, and governance overhead of auditing that volume of automation.

Governance Framework to Prevent Sprawl

The solution is not to avoid Power Automate, but to impose financial discipline and governance from the start, before sprawl becomes endemic.

First, establish a flow cost tracking model. Assign ownership, purpose, and monthly cost estimate to every flow and bot. Track actual API request consumption per flow and per team. Without cost visibility at that level of granularity, finance leaders cannot see which automation initiatives deliver value and which simply consume capacity.

Second, establish approval and prioritization gates for new automation. Every new flow or bot should be evaluated for business value, estimated cost per transaction, expected API request volume, and whether the outcome duplicates existing automation.

Third, set hard API request budgets by department. Monitor consumption weekly, not monthly. If a team approaches its budget, trigger a review of flow efficiency and consolidation opportunities.

Fourth, enforce premium connector policies. Premium connectors should be approved before flows are built, not discovered during cost review. Understand whether standard alternatives exist and whether business value justifies incremental licensing cost.

Fifth, consolidate flows quarterly or semi-annually. Identify redundant flows, consolidate similar use cases, and retire flows no longer delivering value. Treat the flow library as a managed asset.

Sixth, implement centralized monitoring and governance tooling. The Power Automate Center of Excellence starter kit or third-party platforms provide visibility into flow execution, failure rates, and API request consumption.

Where Finance Leaders Should Start

For CFOs and Finance Leaders evaluating or scaling Power Automate, the path starts with one decision: treat automation as a governed, cost-tracked initiative, not a free-for-all low-code platform.

If your organization is in pilot phase, establish governance discipline now, so it is part of the adoption story from the start rather than a late-stage correction.

If your organization is already in sprawl phase, the priority is visibility. Audit your current environment. Understand what flows are running, what they cost, what they do, and whether they deliver value. Execute a consolidation program to reduce complexity and cost.

Power Automate is genuinely powerful and genuinely cost-effective when deployed in a disciplined way. The platform is not the problem. Governance is. Finance leaders who treat it as a governed, tracked, and financially accountable initiative will see the promised ROI. Those who treat it as a free platform for teams to automate whatever they want will see costs spiral.

The choice, and the accountability, starts with Finance.


Routeget Technologies helps enterprise organizations design and implement governance frameworks for Power Platform and enterprise automation, ensuring automation delivers ROI at scale rather than becoming a hidden cost center.

#PowerAutomateGovernance #WorkflowAutomation #FinanceTransformation #PowerPlatform #CostOptimization #EnterpriseAutomation #Microsoft365Automation

Dataverse Data Residency and Compliance: The Multi-Region Strategy Most CIOs Miss

Enterprise multi-region Dataverse architecture across geographic zones

Your organization operates in three countries. Your finance team demands European data stays in Europe. Your CFO asks how much you’re paying for redundancy across regions. Your compliance officer flags that your current architecture doesn’t align with the new data sovereignty requirements coming in Q4. And meanwhile, everyone assumes Dataverse handles this automatically because it’s Microsoft cloud.

It doesn’t. And most CIOs don’t realize the gap until they’re months into a Power Platform rollout.

Microsoft Dataverse pricing, architecture, and residency behavior are frequently misunderstood, partly because the documentation focuses on technical capacity and partly because the commercial implications only become visible at scale. Understanding Dataverse data residency is not a technical detail for your architects to worry about. It’s a strategic decision that affects compliance posture, operational cost, licensing efficiency, and your ability to support global operations within existing governance frameworks. Getting it wrong creates cascading problems: expensive data migration projects, compliance violations, or multi-region deployment architectures that cost far more than a thoughtful early strategy would have.

Enterprise multi-region Dataverse architecture across geographic zones

What Dataverse Data Residency Actually Means

Dataverse databases reside in a specific geographic region determined at provisioning time. This region assignment is permanent and cannot be changed after a database is created. Once you provision a Dataverse environment in West Europe, your customer records, inventory ledgers, and sales transactions remain in that region’s data centers indefinitely. Moving data between regions requires export-and-reimport workflows, which means downtime, validation effort, and business disruption.

The region you select during environment provisioning is not the same as the region where your application servers run or where your users are located. A Power App built on a West Europe Dataverse instance can be accessed and used from any geography, and the performance impact of geographic distance is usually negligible for most business applications. But the data itself stays where you provisioned it.

This distinction matters because many organizations assume they can simply create a Dataverse environment and let Microsoft handle residency automatically. They cannot. Residency is a conscious architectural choice made at provisioning time. If you have subsidiary operations in Canada, Australia, and Japan, you need separate Dataverse environments for each, each provisioned in its corresponding region, unless you have an explicit business case for centralizing data in a single region and accepting the compliance and latency trade-offs.

The Multi-Region Strategy: Options and Trade-Offs

Most enterprises adopt one of three approaches to Dataverse deployments across multiple geographies.

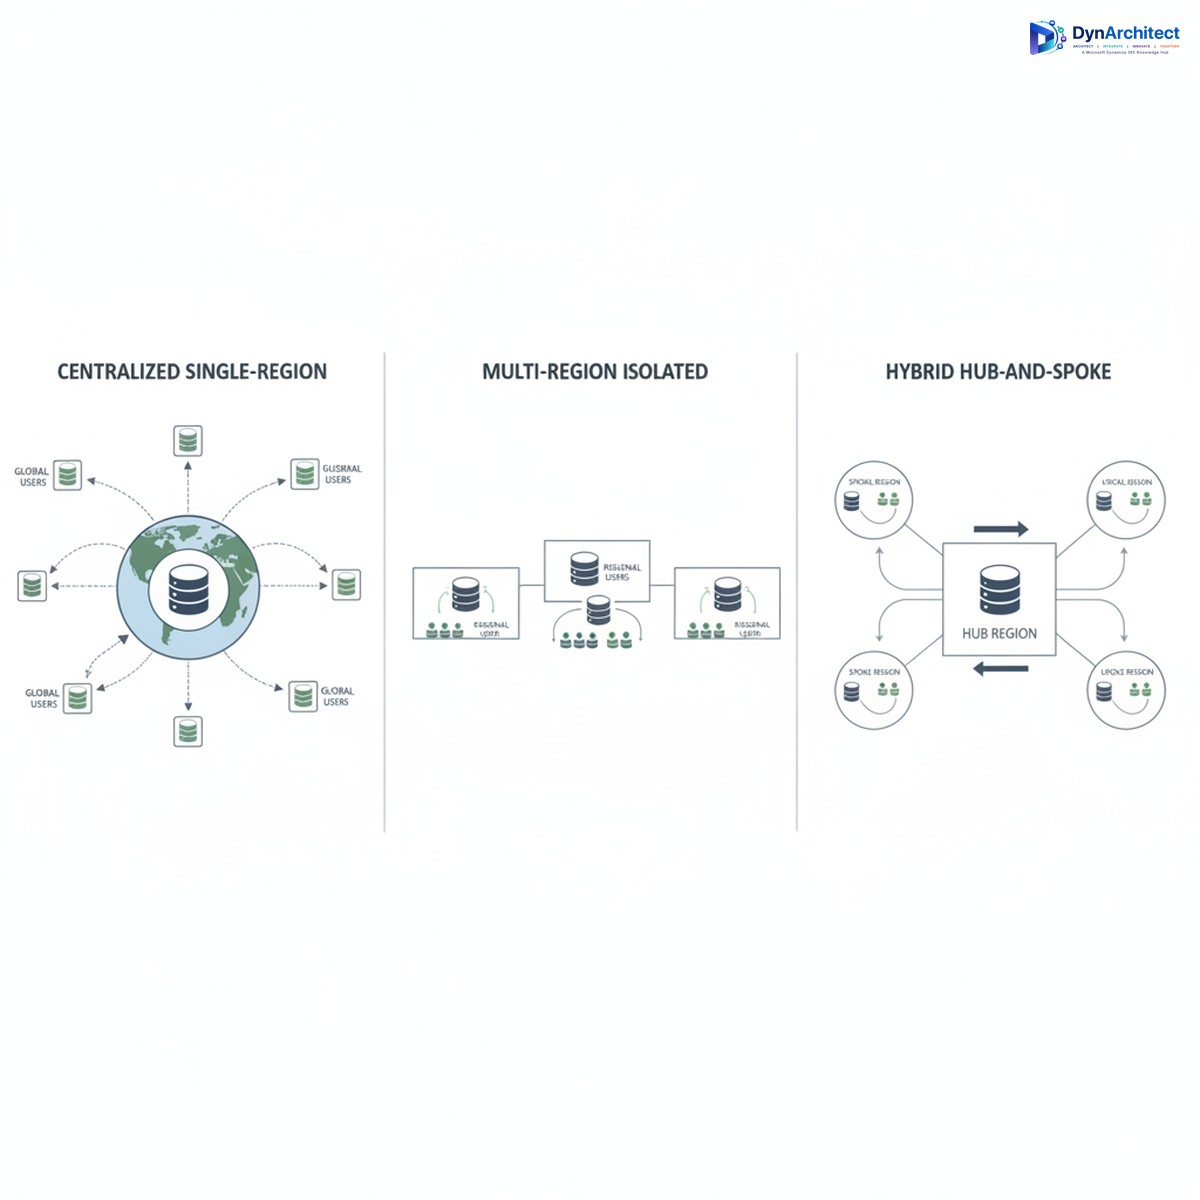
Centralized Single-Region Strategy means all subsidiaries and operations worldwide connect to a single Dataverse environment, usually provisioned in your headquarters region or your primary cloud region. This is the simplest from an architectural standpoint: one environment, one set of security policies, one licensing footprint. All operations use the same datasets, which eliminates data synchronization challenges and keeps organizational data unified. The trade-off is data residency compliance. If you operate in the European Union, storing EU customer data in a US-provisioned Dataverse does not comply with GDPR data residency expectations. Similarly, operations in Australia, Canada, or other regulated jurisdictions may violate local data governance requirements. You also incur network latency for users accessing Dataverse from distant regions, though this is typically 50-200ms and is not a business-critical problem for most transactional applications.

Multi-Region Isolated Environments means provisioning separate Dataverse environments in each major geography, with each environment containing only the data relevant to that region. A subsidiary in Germany operates its own Dataverse instance in West Europe. The Australian operations run their own instance in Australia Southeast. This approach satisfies data residency requirements and places data geographically close to users. The cost and complexity trade-off is significant. You now maintain multiple Dataverse environments, each with its own licensing, security configurations, and data models. Data integration between regions becomes a managed-sync problem: changes to a customer record in the European environment must be synchronized or reconciled with the global master record in the headquarters system, creating operational overhead and potential data quality risks if synchronization logic is not carefully designed.

Hybrid Hub-and-Spoke Strategy means maintaining a primary Dataverse for strategic or shared data (customers, products, organizational hierarchies) in one central region, with subsidiary Dataverse instances handling transactional and regional data separately. Each subsidiary has its own Dataverse for local customer records and operational data, while a central hub maintains the master customer list and product catalogs. This is architecturally sophisticated and requires disciplined data governance, but it balances compliance requirements with operational simplicity. Regional teams operate within their own data residency boundaries, while strategic dashboards and reporting pull from the hub using Power BI or other integration layers.

Comparison of three Dataverse deployment strategies: centralized, isolated, and hub-and-spoke

Licensing and Cost Implications

Many CIOs approach Dataverse licensing by counting total users and calculating a single per-user cost. This misses the actual cost structure. Dataverse licensing includes both user licenses (which grant access rights) and database storage licensing (which charges for actual data volume and database capacity). If you deploy isolated environments per region, you pay licensing for each separate environment. Ten gigabytes of data in a West Europe Dataverse plus ten gigabytes in an Australia Southeast Dataverse means licensing costs for twenty gigabytes of Dataverse storage, not ten.

This becomes material at scale. An organization with one hundred thousand customer records currently stored in a single Dataverse may not realize that splitting this data across three regional environments triples the Dataverse storage licensing footprint if done naively. If that organization also stores copies of data in on-premises systems or other cloud platforms for compliance reasons, the total cost of multi-region strategy can surprise finance teams who expected cloud consolidation to reduce overall data infrastructure spending.

Cost optimization strategies include careful database maintenance (removing obsolete records, archiving historical data), tiered storage architecture (hot data in Dataverse for operational use, cold data in Azure Blob Storage for compliance retention), and thoughtful environment consolidation where data residency requirements genuinely allow it.

Common Implementation Mistakes

Organizations frequently begin Power Platform rollouts with a single Dataverse environment in their primary region, assuming they can add residency strategy later. Months into deployment, when subsidiary operations are using Power Apps tied to that central environment, adding a separate regional environment requires data extraction and rearchitecting application logic to route data to the correct environment. This is expensive and disruptive.

A second common mistake is underestimating data residency requirements. Executives believe “it’s in Azure, so it’s compliant” without investigating whether the specific Azure region and data residency configuration actually satisfy regulatory obligations. GDPR, CCPA, data sovereignty laws, and industry-specific regulations (financial services, healthcare) all have different residency expectations, and “cloud” is not a compliance checkbox.

A third mistake is failing to track data ownership and sovereignty boundaries within a single environment. If you keep all data in a central US region, you still need clear governance about which records belong to which region and why they’re retained in a non-resident location. This is an audit finding waiting to happen if it’s not explicitly documented and justified.

Getting Started with a Residency-First Architecture

Before provisioning your first Dataverse environment, map your organization’s regulatory footprint and data residency requirements by region. Consult legal and compliance teams to understand which data categories are subject to residency mandates and which are not. Typically, customer records and certain operational data carry residency requirements, while master data like product catalogs and organizational hierarchies may not.

Sketch an environment strategy that assigns regions to Dataverse provisioning regions. For most multinational enterprises, this means at least one environment per major regulated geography. Document the business rationale for any exceptions (data categories that deviate from residency boundaries) so you have a defensible compliance position.

Engage your Microsoft partner and licensing team early to calculate the full licensing footprint of multi-environment strategy, including user licenses, database storage, and any advanced feature licensing. Compare this to your centralized baseline so leadership understands the trade-off.

Design your integration layer upfront. If you adopt hub-and-spoke, clarify which systems own each data domain and how synchronization will work. If you use isolated environments, specify how regional teams will access strategic data. This architecture conversation now, before systems are live, prevents expensive rearchitecting later.

Routeget Technologies has guided dozens of organizations through this planning process, helping them balance residency compliance with cost and operational efficiency. What often emerged was that thoughtful architecture early prevented millions in remediation costs later.

Data residency and Dataverse multi-region strategy is fundamentally a business decision, not a technology implementation. The CIO who makes this choice deliberately, in consultation with compliance, finance, and operations leadership, sets up a Power Platform footprint that scales confidently across geographies. The CIO who defers the decision and hopes it works out on its own tends to discover the problem after systems are live and users expect them to keep working.


#DataverseMultiRegion #CloudArchitecture #DataResidency #ComplianceStrategy #CIOGuidance #MicrosoftCloud #DataGovernance

Power BI RLS at Scale: When Dynamic Row-Level Security Becomes a Bottleneck

Row-level security in Power BI seems straightforward during a pilot. You create a role-based filter on a User table, join it to your fact data, and suddenly users see only their assigned data. It works flawlessly with 10 users and a few hundred thousand rows. Then you move to production with 2,000 users and suddenly your dashboards refresh in 4 hours instead of 30 minutes, and the data warehouse query that used to run in 3 seconds now times out.

The culprit is almost always RLS implementation design, not hardware constraints or data volume. Most teams build RLS the way tutorials show: dynamic username matching against a lookup table. This pattern works until you hit scale. Once you do, the filter becomes computationally expensive, query engines struggle with the cardinality of the role definition, and your entire semantic model refresh becomes a bottleneck.

This isn’t a limitation of Power BI itself. It’s an architectural decision hiding inside seemingly innocent DAX formulas and role definitions. Get the architecture right early, and RLS scales smoothly. Get it wrong, and scaling becomes a major undertaking midway through your rollout.

How RLS Performance Actually Degrades

Most Power BI RLS implementations work by joining a Users table (containing user ID, email, username, and assigned business unit, region, or account) to your fact tables through a filtering relationship. In the role definition, you write something like:

[User_Email] = USERNAME()

This tells Power BI to filter the fact table to rows where the User_Email column matches the currently logged-in user’s email. Straightforward. But what happens underneath is what matters.

When a user opens a dashboard, Power BI doesn’t execute the RLS filter once and cache the result. Instead, the filter is embedded into every query the dashboard runs. If your dashboard has five visualizations, each visualization generates a separate query, and each query includes the RLS filter evaluated against your role definition. If your role evaluates USERNAME() against 50,000 user records to find a match, that’s 50,000 comparisons per query, times five queries, times however many concurrent users are refreshing reports at the same time.

This scales linearly downward with user count. Ten users means fifty thousand comparisons times five queries times ten simultaneous users. Two thousand users means fifty thousand comparisons times five queries times two thousand simultaneous users. The mathematics break quickly.

Additionally, most organizations layer RLS filters. You might have one RLS role for regional filtering, another for account-level filtering, and another for team assignment. Each layer adds another lookup and another set of comparisons. Three layers of RLS against large lookup tables is not uncommon, and it’s where the model refresh starts to visibly slow.

The Hidden Cost of Dynamic Username Matching

The USERNAME() function is convenient, but it’s also the root of many performance problems. USERNAME() returns the current user’s email or ID from Azure Active Directory (or whatever authentication system you’re using). That’s fine at a conceptual level. But in practice, USERNAME() is evaluated on every single row context change inside your queries.

Consider a common scenario: you have a Salesforce sync where you pull the current User table nightly. 30,000 user records. Each user has an assigned Region and an assigned Account list. Someone opens a Power BI dashboard with four visualizations. Power BI needs to execute four queries. Each query runs with RLS applied:

[UserEmail] = USERNAME()

Power BI’s query engine translates this into a filter condition in the underlying SQL or MDX query sent to your data source (whether that’s Azure SQL, Synapse, or a direct lake connection). The data engine evaluates this for every partition, for every table relationship, for every row that might match. With thirty thousand users and large fact tables, this isn’t trivial.

Then someone else logs in, and the same process repeats with a different USERNAME() value. In production, you might have hundreds of concurrent users, and each is generating this lookup and comparison overhead.

Design Patterns That Scale

The solution isn’t to eliminate RLS. It’s to change how you implement it so the filtering happens efficiently.

Pattern 1: Pre-computed Role Assignment in the Fact Table

Instead of dynamic lookup at query time, assign roles when data is loaded. Before your fact table lands in Power BI, compute which users have access to which rows and store that assignment as a column in the table itself. For example, add a column called AllowedUsers containing the user IDs or emails who can see that row. Then, in your RLS role:

[AllowedUsers] IN VALUES(...)

This is faster because you’re filtering on a pre-computed, indexed column rather than doing a lookup join at query time. The downside is that changes to user access require a full data refresh, not a runtime reevaluation.

Pattern 2: RLS at the Aggregation Layer, Not the Fact Layer

Many teams apply RLS to their most detailed fact tables. This is the most expensive place to filter. Instead, build your RLS semantics against aggregated or summarized tables. For example, if your fact table has order line-item level detail with thousands of rows per user, create a summary table at the order level, apply RLS there, and relate the detailed facts read-only. Users can’t drill below what they’re allowed to see.

Pattern 3: Role-Based Access Through a Mapping Table, Not a Lookup

Build a dedicated Role Mapping table that pre-computes which users belong to which roles. Populate it at load time, not query time. Then apply RLS against this mapping table using a relationship-based filter rather than a DAX formula:

Relationships: RoleMapping[UserID] -> FactTable[UserID]<br />RLS: [Role] = "SalesRep"

This delegates the filtering to relationship traversal, which database engines optimize heavily.

Pattern 4: Object-Level Security for Entire Semantic Model Sections

If individual row filtering becomes too expensive even with optimizations, consider object-level security. Hide entire tables, measures, or columns from certain roles. A regional sales manager might not see cost of goods or procurement details at all, not because the rows are filtered, but because those tables are invisible to them. This is blunter than row-level filtering, but it’s far more performant for large organizations.

Implementation Checklist

Before deploying RLS to production, verify:

1. Measure baseline query performance without RLS

Run your dashboards against a copy of the model with RLS disabled. How long does a refresh take? If it takes more than 30 minutes, RLS is not your bottleneck—your data model or query patterns are. Fix those first. If baseline is acceptable, proceed.

2. Identify your largest lookup table

User tables, regions, accounts, teams—whichever table you’ll use for role filtering. Count its rows. If it’s over 50,000, consider Pattern 1 or Pattern 3. If it’s under 10,000, standard dynamic username matching might be acceptable, but test at production scale first.

3. Test RLS with production user counts, not pilot counts

Set up a test model with realistic user counts. If you’ll have 2,000 users in production, create test roles for 500 of them and measure refresh time and query response. Don’t assume linear scaling. Cardinality issues often behave worse than linear.

4. Plan for re-architecture if needed

If you’re currently using dynamic USERNAME() matching against large tables, plan a migration to one of the patterns above. Don’t do this on the fly in production. Test the new architecture on a copy of the model first, measure performance improvement, then cut over.

5. Monitor refresh time trend

As your user base grows, your refresh times should not grow proportionally. If they do, your RLS implementation is hitting a wall. Catch this early, before users start complaining about stale data.

Conclusion

Power BI RLS is essential for organizations sharing a single semantic model across teams with different access rights. But RLS performance degradation is one of the most common production failures in Power BI deployments, and it’s entirely preventable with the right design pattern from the start. The difference between a dynamic username lookup against a 50,000-user table and a pre-computed role assignment is the difference between a 30-minute refresh and a 4-hour refresh once you scale.

Choose your RLS pattern based on your expected user count and role complexity before you build. Test at production scale before you roll out. And if you inherit a struggling RLS implementation, re-architecture isn’t a failure—it’s a necessary step toward a sustainable system.

#PowerBIRLS #RowLevelSecurity #PowerBIPerformance #EnterpriseAnalytics #DataSecurity #DAXOptimization #Dataverse #PerformanceOptimization

Building Enterprise AI Plugins for Copilot Studio: When Prompt Engineering Stops Working

Your Copilot Studio instance has been live for three months. The generic responses work fine for routine customer questions. Finance users can ask about invoice status, support teams can access knowledge articles, and operations can trigger basic workflows. Then a regional finance controller asks the system to calculate cross-border tax liability on a specific transaction type, and the Copilot returns something confidently wrong. You prompt-engineer for two weeks, add retrieval augmented generation, feed it more context documents. The Copilot still hallucinates because the business logic you need is not in any training data and cannot be reliably expressed as plain-language instructions. This is the moment you need custom AI plugins.

Copilot Studio has become the dominant interface for enterprise AI in Microsoft’s ecosystem. It handles conversation orchestration, knowledge integration, and basic AI coordination reasonably well. But enterprises running this platform often discover a hard boundary: Copilot’s core language models and retrieval pipelines, however well-prompted, cannot reliably execute business logic that requires domain-specific reasoning, real-time calculation, or proprietary algorithms. At that point, the architecture choice is clear. You build a custom plugin that encapsulates your logic, expose it to Copilot through the API, and let Copilot handle the conversation while your code handles the reasoning.

The boundary between prompting and programming

The first question teams ask is practical: when should we stop refining prompts and start building a plugin? The answer depends on measurability and consistency. If the Copilot’s output accuracy has reached a plateau after refinement, and accuracy is below your business threshold, a plugin is justified. If the required logic involves calculations, date arithmetic, multi-step conditionals, or reference data lookups (like product pricing, tax rates, or inventory counts), those belong in code, not prompts. If the same request returns different answers depending on minor variations in phrasing, or if the Copilot sometimes invents plausible-sounding answers rather than admitting it cannot answer, those are signals that the language model is not the right tool for that part of the workflow.

Consider a typical scenario: a Dynamics 365 Finance user asks Copilot about available cash in a specific cost center, accounting for committed purchase orders and pending payroll. The Copilot needs to query Dynamics, aggregate real-time data, apply business rules about what counts as committed, and return a specific number. Prompting the Copilot to do this might work in a demo. In production, with thousands of daily queries across different cost centers, exchange rates, fiscal calendars, and policy variations, a language model will eventually return incorrect numbers, usually with complete confidence. A plugin solves this by running the exact query and calculation logic every time, leaving the Copilot to handle the conversation and formatting.

Plugin architecture in Copilot Studio

Copilot Studio plugins connect to external APIs. That external API can be anything you build: a cloud function, a containerized service, a Logic App with Power Automate, or a .NET Azure Function. The Copilot describes what it wants to do (based on the conversation context), the plugin action is triggered, your code executes, and the result is returned to the Copilot for further conversation.

The simplest architecture is a single Azure Function or cloud function (AWS Lambda, Google Cloud Functions) that accepts a JSON request from Copilot and returns a JSON response. The function can call Dynamics 365 APIs, query a database, call third-party services, or execute business logic. From Copilot’s perspective, it simply sends a request and gets back structured data.

For enterprise scenarios, though, you need to think about authentication, rate limiting, audit logging, and error handling. Copilot can send requests at high volume during peak usage. Your plugin needs to handle this without degrading Copilot’s response time or running up costs. You should implement proper logging of what Copilot requested, what your code returned, and any failures, so you can debug issues later. You should also plan for security: the plugin is exposing business logic and potentially sensitive data (cost center balances, tax calculations, procurement data). Access should be restricted to authenticated users, requests should be validated, and responses should be filtered by role so users only see what they are authorized to see.

Real-world plugin implementation patterns

A common pattern is the data enrichment plugin. Copilot receives a user’s question about a purchase order. The Copilot extracts the order ID or vendor name from the conversation, calls your plugin, and the plugin queries Dynamics 365 Supply Chain Management to return order status, delivery dates, budget allocation, and any policy exceptions. The Copilot then uses this structured data to answer the user’s question accurately. Without the plugin, the Copilot might guess or confuse details from different orders.

Another pattern is calculation and validation. Finance teams often need to validate transaction proposals before they are committed. A user might ask Copilot whether a specific expense is compliant with policy, and Copilot needs to check the expense amount against the cost center budget, the employee’s spending tier, the transaction category, and any special approvals in place. This logic is too complex and too sensitive for a language model to handle. A plugin runs the exact validation rules and returns yes or no with an explanation of which rule applies.

A third pattern is workflow initiation. Copilot can receive a user’s request to approve a contract, create a purchase requisition, or escalate an issue. Instead of trying to directly modify systems, Copilot calls a plugin that creates a structured request in your workflow engine (Power Automate, Logic Apps, or a custom orchestration service), which then handles the actual business process with proper audit trails, notifications, and approval chains.

Failure modes and production lessons

The most common failure in production is latency. A Copilot session timeout is usually 30 seconds. If your plugin takes 15 seconds to execute (because it is doing multi-step Dynamics queries or waiting for external services), Copilot will time out before your plugin even returns. You need to either cache data, run asynchronous jobs, or redesign the plugin to return partial results and update the Copilot UI after the full result arrives. Teams that skip this step often end up with Copilot sessions that fail silently or time out repeatedly in production.

A second failure mode is incomplete error handling. A plugin fails (database is down, Dynamics is temporarily unavailable, an API call returns an unexpected error). The plugin should catch this, log it, and return a clear error response to Copilot, not crash or hang. Copilot should then explain to the user that it could not retrieve the data and suggest alternatives (like checking the system status page or contacting support). Without this, users see broken Copilot sessions with no explanation.

Authorization is a third area. Your plugin receives a request from Copilot that includes the user’s identity. Your plugin must verify that this user is actually authorized to see the data they are asking about. If your plugin does not check authorization, users can escalate privileges by asking Copilot for data they would not normally have access to. This is a security and compliance issue, especially in regulated industries like finance and healthcare.

Choosing between custom development and pre-built AI services

Microsoft’s AI Builder sits between pure prompting and custom plugins. AI Builder lets you build models that can do optical character recognition, sentiment analysis, or predictive scoring, and expose these as Copilot actions. For some use cases (document classification, customer sentiment analysis, basic prediction), AI Builder is sufficient and faster to build than a custom plugin. But for complex business logic, multi-step reasoning, or calculations with regulatory requirements, a custom plugin is necessary because you control exactly what the code does and can audit every decision.

Deployment and monitoring

Once a plugin is built, it should be versioned and deployed through your standard application lifecycle management pipeline. Changes to plugin logic should go through testing and approval before hitting production. You should have monitoring in place: track response times, error rates, and plugin usage patterns. Set up alerts if response times exceed thresholds or error rates spike. Log every request and response (at an appropriate detail level, respecting privacy) so you can audit what Copilot asked, what your plugin returned, and whether the result was accurate.

This monitoring becomes particularly important when Copilot’s behavior changes. If Copilot suddenly starts calling your plugin more frequently or with different inputs, your plugin needs to handle it gracefully. If a new version of Copilot changes how it describes requests, your plugin should either adapt or return a clear error rather than silently misinterpreting the request.

Conclusion

Copilot Studio is effective at conversation and orchestration, but it is not a replacement for business logic. Custom AI plugins let you draw a clear line: Copilot handles the conversation and user interaction, while your code handles the reasoning, calculation, and access control. This division of labor produces systems that are both more accurate and more maintainable than trying to encode all business logic as prompts. The engineering effort to build a plugin is real, but for any enterprise scenario involving calculations, multi-step reasoning, or regulated data access, the plugin approach is the right architecture choice.

#CopilotStudioAI #AIPlugins #EnterpriseAI #PowerPlatform #CustomAIPlugins #Dynamics365AI #CloudArchitecture #PluginArchitecture

Power Apps Canvas App Performance: Why Complex Apps Freeze When Users Scale

Power Apps canvas app performance optimization dashboard

“

Your production Power Apps canvas app works fine in your test environment. It handles three users, fifty data sources, and a complex UI with nested galleries and inline filters without breaking a sweat. Then, on day one of rollout, fifteen users log in simultaneously, and the app becomes unusable. Forms take twelve seconds to load. Button clicks hang for five seconds. The gallery that renders customer records falls back to client-side filtering because the data query timed out.

\n\n

This is not a platform limitation. Power Apps canvas apps can handle production workloads at meaningful scale. What you are seeing is the collision between how Power Apps executes client-side logic and how most teams design their applications without accounting for that execution model.

\n\n

The Root Cause: Client-Side Rendering and Serialization

\n\n

Canvas apps run fundamentally differently from web applications or model-driven apps. Every formula, every query, every filter logic executes on the user’s client device, not on a server. That architecture means your app’s performance depends directly on the client’s machine and network.

\n\n

When you add a data source to a canvas app, Power Apps does not just connect to Dataverse. It establishes a live connection that allows every formula in your app to query that source on demand. If you have a gallery that displays customers, a dropdown that filters by region, a text input that searches by company name, and a form that shows order history, those are potentially four independent data queries running every time the app loads or a user interacts with a control.

\n\n

The performance breakdown happens during what the platform calls \”serialization\”. Before Power Apps can display a record or filter a dataset, it must convert the data from Dataverse’s native structure into a format the client-side runtime can work with. For datasets with thousands of rows, that conversion takes time. More critically, every formula that touches a data source triggers its own serialization cycle. If your app has ten formulas that all reference the same Dataverse table, Power Apps must serialize that data ten times unless you use specific optimization patterns.

\n\n

\"Technical

\n\n

Where Filtering Fails: Server-Side vs. Client-Side Logic

\n\n

Here is where most performance problems originate: teams build apps that look correct, pass testing, and then collapse under real-world usage patterns because filtering happens on the client side instead of the server.

\n\n

Suppose you build a canvas app that displays a gallery of orders. Your gallery formula looks like: Filter(Orders, Status = DropDownStatus.Value). This appears efficient. You are filtering by a user selection. In reality, Power Apps first retrieves every order record from Dataverse, serializes the entire dataset on the client, then applies the filter in the browser. If your Orders table has 50,000 records, the app must pull all 50,000 records, serialize them, then filter to the 200 that match the selection. At that scale, this takes seconds, and if multiple users do this simultaneously, their network connections and client machines are all fighting for bandwidth and processing power.

\n\n

The solution is straightforward but requires changing how you structure your data queries. Instead of filtering after retrieval, you build the filter into the query itself using Power Apps’ connector syntax. A Dataverse connector formula that incorporates a filter directly into the retrieval statement looks like: Search(Orders, DropDownStatus.Value, \”Status\”). Power Apps sends this as a query to Dataverse, not to the client. Dataverse performs the filter before returning data. The app receives only the matching records, serializes only what it needs, and displays results in milliseconds even at scale.

\n\n

The difference is not marginal. The gap between client-side filtering and server-side filtering on a table with 10,000 records is the difference between a three-second load and a sub-second load. At 50,000 records, it is the difference between a hung interface and a responsive one.

\n\n

Data Sources and Query Optimization

\n\n

Canvas apps allow you to connect to multiple data sources simultaneously. Dataverse, SharePoint, SQL Server, Excel, external APIs through connectors. The flexibility is valuable; the performance cost of misusing it is severe.

\n\n

Each data source connection adds to the app’s startup cost. When the app loads, Power Apps must establish connections to every source you have used, even if the user does not navigate to a screen that uses that source. If your app has connections to six data sources and only uses four on the initial screen, those two unused connections still add latency to the first load.

\n\n

Worse, if your OnStart formula attempts to preload data from multiple sources, the load time becomes the sum of every query. If each query takes one second, your app takes five seconds to become usable. Add a ten-second timeout for a slow network connection, and your users wait that duration before seeing anything.

\n\n

The optimization approach is specificity. Load data only when needed, not on startup. Use button press events to trigger data retrieval rather than formulas that run when the app initializes. If you need data available immediately, implement a background load that fetches data after the initial interface renders, so the UI becomes interactive faster.

\n\n

Another common mistake is using the same data source connection for multiple independent queries. Suppose you have a single Dataverse connection and three different galleries on the same screen, each with a different filter. Power Apps may queue those queries or attempt to execute them in parallel, depending on the platform load. Under load, they serialize, and each waits for the previous to complete.

\n\n

Split this into three distinct queries using View filters or connector-level filtering, so each query is independent and the platform can optimize execution. The number of queries matters less than their independence and specificity.

\n\n

Nested Controls and Rendering Complexity

\n\n

Canvas app performance also degrades with UI complexity. Galleries within galleries, nested containers, forms with dozens of fields, and conditional visibility logic across multiple controls consume client-side resources quickly.

\n\n

Consider a gallery that displays a list of customers. Inside that gallery, each row contains a nested gallery of orders for that customer. When the outer gallery renders 20 rows, and each row triggers a nested gallery query, the app is running 20+ queries simultaneously. If each query takes 500 milliseconds, the nested galleries take ten seconds to fully render. Users see a partial interface, then fields populate gradually as nested queries complete.

\n\n

The performance cost of nested galleries is compounded by the fact that each nested gallery runs queries independently. Unlike server-side joins, which a SQL database performs as a single operation, nested galleries in Power Apps are a series of sequential and parallel queries on the client.

\n\n

The mitigation strategy depends on your scenario. If you truly need nested data, consider using a model-driven app instead, which executes queries server-side and handles nested relationships more efficiently. If a canvas app is required, limit nesting to one level, implement pagination so only visible rows query their nested data, and use delegation-aware formulas that tell Power Apps to push the nested query logic to the data source instead of executing it on the client.

\n\n

Testing at Scale

\n\n

Testing a canvas app with three users and 1,000 test records tells you nothing about its performance with 30 users and 100,000 production records. Teams often discover performance problems on launch day because they did not test at realistic scale.

\n\n

Before rolling out a production app, stress-test it with the expected peak concurrent user load and the actual data volume. If you expect 25 concurrent users and your Dataverse table has 50,000 records, your test environment must reflect that. This means populating test tables with production-scale data and asking multiple testers to log in and use the app simultaneously.

\n\n

Pay attention to what happens during those peak loads. Which operations slow down. Which queries time out. Whether the app becomes unresponsive or degrades gracefully. These observations guide your optimization priorities.

\n\n

Practical Optimization Checklist

\n\n

Apply these patterns to avoid the most common performance pitfalls. First, push filtering and sorting to the data source, not to the client. Use connector-level query parameters instead of post-retrieval formulas whenever possible. Second, minimize startup data retrieval. Load only what is necessary on app start, and defer everything else. Third, avoid nested galleries. If nested data is unavoidable, implement pagination and lazy loading. Fourth, limit the number of data source connections and preload only the data you actually use. Fifth, test at production scale, not at test scale.

\n\n

Most canvas app performance problems are not platform bugs. They are design choices that work at small scale and break at large scale. Understanding the difference between client-side and server-side execution, and designing your app around that reality, is what separates apps that work and apps that scale.

\n\n


\n\n

About Routeget Technologies

\n\n

Routeget Technologies helps enterprises architect and implement scalable Power Platform solutions. If your Power Apps performance problems are holding back a rollout or affecting user adoption, our team can help you redesign and optimize your apps for production workloads. Reach out for a consultation.

\n\n

#PowerAppsPerformance #CanvasAppOptimization #PowerPlatformDevelopment #ClientSideRendering #DataverseOptimization #PowerAppsGalleries #EnterpriseApplications #Dynamics365Integration

\n”

Dynamics 365 Finance Month-End Close: Why Manual Review Processes Eat Three Weeks of Your Finance Team’s Time

Dynamics 365 Finance month-end close dashboard with reconciliation and approval workflows

Your CFO expects the month-end close to take five business days. Your finance team knows it will take at least three weeks, if nothing breaks. Neither estimate is wrong, but the gap between them exposes a concrete operational problem that Dynamics 365 Finance can address—if you design the close process deliberately rather than simply importing Excel workflows into a new system.

The root cause isn’t Dynamics 365 Finance’s fault. It’s that most organizations have never mapped the actual work their finance team performs during month-end close, and they transfer that unmapped work directly into D365 Finance, where the same manual reviews and exception-handling steps consume the same time, just now in a new interface. This article walks through the hidden work that extends close cycles and the specific D365 Finance capabilities that can compress it without sacrificing control.

The Hidden Work in Month-End Close

Finance teams perform three categories of work during month-end close: transactional, reconciliation, and review and approval. The first category moves quickly in Dynamics 365 Finance because transactional posting, reversal, and period closing are automated. The second category, reconciliation, is where most organizations find that D365 Finance has given them new tools but not a fundamentally different process. The third category, review and approval, is where the real bottleneck sits.

Reconciliation requires matching subledger balances to the general ledger and resolving differences. In Excel, this meant exporting general ledger data to a spreadsheet, exporting subledger data to another spreadsheet, and then manually or with crude formulas, finding and categorizing exceptions. In Dynamics 365 Finance, you have automated reconciliation matching, but it still requires manual exception review if a transaction doesn’t auto-match due to timing, rounding, or data misalignment. Many organizations don’t implement the reconciliation matching engine at all, and instead build custom reconciliation reports that they then export and manually review in Excel. That defeats the purpose. Organizations that do implement reconciliation matching still need a process to review and approve the remaining exceptions. If your exception resolution process is ad-hoc (email threads, informal approvals, updates made directly to the database by whoever has time), month-end close becomes a game of whack-a-mole where resolving one exception creates new work elsewhere.

The review and approval stage is where time collapses. At this stage, the close is technically complete from a system perspective—all journal entries have posted, all subledgers have been reconciled, and all accounts have been reviewed—but finance leadership has not yet signed off. This is where your CFO’s five-day close hits the wall. The approval process usually means compiling reports, distributing them via email, waiting for responses, and manually tracking who has signed off and who is still reviewing. If a reviewer finds an error, the journal entry gets reversed, the approver list gets longer, and the cycle starts again. If multiple reviewers work simultaneously without a structured change-control process, they may unknowingly create conflicting updates.

Dynamics 365 Finance month-end close dashboard with reconciliation and approval workflows

Why Dynamics 365 Finance’s Tools Don’t Automatically Solve This

Dynamics 365 Finance has features that address each of these stages. It has reconciliation matching for subledger-to-GL matching. It has a journal approval workflow that routes entries to approvers. It has role-based security so that only authorized users can post to specific accounts or cost centers. But implementing these features doesn’t automatically translate to a faster close if the underlying process is not designed first.

The most common implementation pattern is this: the team implements D365 Finance features directly as they exist, with minimal process redesign. The reconciliation matching engine gets enabled but with no workflow for resolving exceptions. The journal approval workflow gets configured but with a long approval chain that mirrors the existing email-based approval process—five to ten approvers in sequence, each seeing the full entry list and taking days to respond. The role-based security gets configured but not used strategically to separate data entry from approval, so reviewers still spend time wading through draft entries they didn’t create.

The result is that Dynamics 365 Finance executes the existing process more efficiently at the transactional level but doesn’t reduce the actual elapsed time, because the transactional work was never the bottleneck. The bottleneck is the manual review and approval stage.

Structural Changes That Compress the Close Without Cutting Corners

Three structural changes to your close process, combined with deliberate use of D365 Finance features, can reduce elapsed close time from three weeks to ten to twelve business days while improving control and auditability.

The first change is to separate data entry from approval. Assign data entry (journal posting, subledger reconciliation, exception resolution) to one team and approval to another team that has not touched the data being approved. This isn’t a new idea, but Dynamics 365 Finance makes it operationally feasible. Your reconciliation team can mark exceptions as resolved in the reconciliation matching workspace, but the approval team (the controller, the finance director, or a designated approval group) can see which exceptions were resolved and review them before the general ledger is locked. By structuring permissions so that data entry users cannot post approved entries directly, and approval users see only high-level summaries plus exceptions, you cut the time approvers spend searching for relevant data. A 30-minute approval review of 500 transactions becomes a 10-minute review of 12 exceptions.

The second change is to compress the approval chain. Instead of sequential approval (entry review by the subledger owner, then the cost center manager, then the controller, then the finance director), design approval stages in parallel when possible and in short sequence when approval must be serial. Most organizations can reduce approval stages from five to three without sacrificing control. The subledger owner approves their subledger reconciliation in the reconciliation workspace. The controller approves all entries and reconciliation exceptions at once, using a dashboard that shows high-risk accounts and exceptions flagged by the reconciliation matching engine. The CFO reviews a summary and sign-off letter rather than individual entries. This parallel-where-possible, serial-only-where-necessary structure typically reduces approval cycle time from eight to ten days to two to four days.

The third change is to automate exception escalation. If an exception is not resolved within a specific time window (for example, three days after period end), Dynamics 365 Finance can send an automated alert to the responsible approver. This prevents exceptions from sitting in a queue and blocking closure. The escalation alert also creates an audit trail—it records when the exception was identified, when the alert was sent, and when it was finally resolved. This audit trail is exactly what your auditors want to see, and it removes the need for a manual exception log that has historically been built in Excel and updated sporadically.

The Realistic Implementation Timeline

These changes require careful process design before the configuration work begins. A typical implementation that adds close-process automation to an existing D365 Finance deployment takes three to four months. The first month is spent mapping current close processes, identifying where exceptions occur most often, and defining the data risk thresholds that trigger approval. The second month is spent building the reconciliation matching rules, configuring the approval workflow, and setting up the exception escalation alerts. The third month is spent running parallel close cycles (the old manual process running alongside the new D365 Finance process) so your finance team can validate that nothing is being missed. The month-end close itself becomes faster immediately, but the real efficiency gain comes in the fourth and fifth close cycles, after your team is comfortable with the new workflow.

The cost of this implementation is not primarily in configuration—it’s in the time your finance team spends away from month-end close activities while the process is being redesigned and validated. Expect to allocate one senior accountant and one finance operations person for two to three months. Expect also that your close process will feel slower for the first month or two after go-live, because your team is learning new workflows and validating that every exception has been captured and resolved. This is normal, and it is not a sign that the implementation has failed.

Making the Business Case to Leadership

The case for process redesign around month-end close is straightforward for a CFO: it frees up your most experienced team members from manual review work so they can focus on analysis, forecasting, and planning. It compresses the time it takes to close the books, which gives leadership three extra weeks per quarter to make decisions based on actual financial results rather than waiting for the close to complete. It creates an audit trail for month-end close activities, which strengthens your internal control environment and simplifies external audits. It reduces the error rate in close processes because exception resolution is now tracked and validated rather than handled ad-hoc.

The cost is three to four months of implementation effort plus the finance team’s time during the redesign phase. The benefit is a close process that runs three to four days faster and a finance team that spends ten to twelve fewer days per month on manual reconciliation and approval work. Over the course of a year, that’s enough time for your finance team to take on strategic work that they couldn’t fit before.

Month-end close doesn’t have to be a three-week sprint every month. It can be a structured, partially automated process that your finance team completes in two to three weeks while also having time to analyze variances and support the business. The tooling exists in Dynamics 365 Finance. The missing piece is usually a deliberate process design that aligns the close workflow with your organization’s risk tolerance and approval structure.


About Routeget Technologies: Routeget Technologies helps mid-market and enterprise organizations streamline financial operations with Dynamics 365 Finance. If your finance team’s close process is consistently running longer than expected, contact us for a process assessment that identifies where Dynamics 365 Finance can reduce manual work without cutting corners on control.

#DynamicsFinance #MonthEndClose #FinanceTransformation #FinanceOperations #CFOStrategy #DynamicsImplementation