Intercompany Elimination Automation in Dynamics 365 Finance: The Journal Entry Trap Most Finance Leaders Miss

Finance operations team reviewing intercompany transactions

Opening Hook

You’re three weeks away from quarter-end close. Finance has forty intercompany transactions in the queue: payables between subsidiaries, recharges for shared services, allocation of corporate expenses. Your team has been manually creating elimination entries in Dynamics 365 Finance for two years now, checking each one against the subledger balances to make sure matching transactions offset properly. It works, but it’s a manual gauntlet—and every quarter, at least one entry gets posted twice, or one side doesn’t match the other, forcing a restatement. The real question isn’t whether you can automate it. It’s why you haven’t, and what you’re risking by waiting.

Intercompany elimination automation is one of those finance capabilities that sits between the realm of “obvious good idea” and “surprisingly complicated to implement.” Most organizations running Dynamics 365 Finance intend to automate it. Many skip it because the setup looks straightforward until you actually try to accommodate the real-world variations in how subsidiaries actually transact with each other. The result is that finance teams at medium and large enterprises spend days each close period on what should be a single-click process, and they accept monthly restatements as a cost of doing business.

The problem isn’t the tool. It’s the gap between what the elimination process *should* do and what most companies configure it to do.

Why Elimination Automation Fails in Practice

Intercompany elimination transaction flow diagram

Dynamics 365 Finance includes native intercompany elimination capabilities. You can set up elimination rules, run a batch process, and create the offsetting journal entries automatically. In theory, this solves the manual-entry problem. In practice, most finance teams who build this end up abandoning it or working around it because the actual requirements are messier than the standard feature handles.

The standard elimination process works like this: define a rule (for example, “eliminate all transactions between subsidiary A and subsidiary B”), run the process, and Finance creates an elimination entry that offsets the amounts on both sides. Clean. Logical. Doesn’t work for half your transactions.

Consider what actually happens at close time. You have intercompany payables where subsidiary A owes subsidiary B for consulting services. You have expense allocations where the parent company charged subsidiaries for IT overhead. You have intercompany sales that aren’t yet invoiced, sitting as accrued revenue. You have currency revaluation differences on intercompany balances. You have partial payments that leave hanging balances. You have transactions posted in different legal entities with different chart-of-accounts structures, so the elimination account on one side doesn’t perfectly mirror the elimination account on the other.

Standard elimination rules assume bilateral, matching transactions in symmetrical account hierarchies. Your actual data looks nothing like that. So when you run the elimination batch, you get partial results, exceptions, and holes you have to patch manually. The bottleneck doesn’t disappear; it just shifts from “enter elimination entries” to “fix elimination exceptions.”

Finance leaders often respond to this by either (a) maintaining manual entries anyway because they understand exactly what’s being eliminated, or (b) accepting that some intercompany balances don’t get eliminated and building manual reconciliation into the close checklist. Both options are expensive. Both hide the problem behind process discipline rather than solving it.

The Core Configuration Trap

The most common failure point is account-matching logic. Dynamics 365 Finance’s elimination feature requires you to specify which accounts on one side of the transaction pair with which accounts on the other side. This sounds straightforward: payables account 200100 on the subsidiary pairs with revenue account 400200 on the parent. For a multi-subsidiary enterprise, you end up with dozens of pairing rules, each of which assumes the same chart-of-accounts structure exists in every legal entity.

But most organizations don’t have symmetrical chart-of-accounts structures across subsidiaries. One subsidiary might use a three-digit cost center code as part of its account number; another uses a six-digit project code. One subsidiary’s chart reflects its regulatory requirements; another reflects its parent’s reporting structure. When you try to force a uniform pairing rule across this, the automation fails on the exceptions—and the exceptions are where your intercompany risk actually lives.

The second configuration trap is elimination method selection. Dynamics 365 Finance offers three elimination methods: by elimination account, by elimination rules, and by source dimensions. Many teams choose by elimination account because it sounds simpler: just specify the account number that identifies an elimination entry, and the system will eliminate matching balances. This works if every intercompany transaction is coded to the same elimination account. It fails the moment transactions are coded to different accounts based on business unit or transaction type, which is what most accounting policies actually require.

A third trap, often overlooked during implementation, is timing. The elimination process doesn’t recognize transaction reversals. If subsidiary A reverses an intercompany invoice in one period and reissues it in the next, the elimination logic might net them in one period (correctly) but not eliminate the new entry in the next (incorrectly). If you have accrual entries that roll forward, the system doesn’t know whether an accrual has been settled or not. You end up eliminating transactions that shouldn’t be eliminated, or leaving open balances that should have been cleared.

What Actually Works: The Approach That Finance Leaders Should Use

The finance teams with the most reliable elimination processes don’t rely on the standard feature to do all the work. Instead, they use Dynamics 365 Finance’s elimination tools as a framework, but they layer on additional validation and semi-automation. Here’s the pattern:

First, establish elimination rules that cover your high-volume, repetitive transactions. These are usually the 70 or 80 percent of intercompany activity that follows a consistent pattern: standard intercompany invoicing, allocated expenses, routine recharges. For these, the elimination batch process should work cleanly. Document what these rules eliminate, down to the account level and dimension combinations.

Second, build a separate process for exception handling. Run the elimination batch, but don’t post the results immediately. Export the elimination entries to Excel or a Power BI model, and validate them against your subledger balances before posting. Check that every elimination entry has a matching transaction on both sides of the elimination. Check that no entries are created for reversal transactions or accruals that should roll forward. This step takes time, but it’s a single review pass instead of forty manual entries, so it’s still a win. It also creates an audit trail for your external auditors.

Third, identify which intercompany transactions or balance types require manual elimination because they’re too irregular for the standard process. These might be settlement-in-progress balances, partial intercompany payments, or transactions that cross subsidiaries with fundamentally different chart structures. Document these explicitly. Don’t pretend the automation covers them. Instead, build a checklist that the finance team follows at close time to ensure these balances are explicitly reviewed and eliminated if appropriate.

Fourth, if your organization is running Dynamics 365 Finance with Power Automate or has development resources, invest in a custom validation flow. The flow should read the pending elimination entries, compare them to the underlying subledger transactions, check for matching invoices or supporting documentation, and flag entries that don’t pass basic reasonableness checks. This isn’t fully automatic elimination, but it’s a guardrail that catches the most common errors: duplicated entries, reversed entries posted as new eliminations, and account mismatches that slipped through the configuration.

The Business Case for Getting This Right

Finance organizations that automate 80 percent of intercompany eliminations and tightly control the remaining 20 percent typically see close cycles compress by two to three days. They reduce restatements for intercompany errors to nearly zero. They cut the finance team’s close-period overtime significantly. They have a documented process that external auditors can review with confidence.

But the real benefit is visibility. When intercompany eliminations are systematized, not manual, you actually know which transactions were eliminated and why. You have an audit trail. You can run analytics on intercompany activity and see patterns: which subsidiaries have the most outstanding intercompany balances, which transaction types take longest to settle, where cash is actually stuck in the system. That visibility drives better working capital management and faster cash conversion.

The risk of not doing this isn’t just operational. If your finance team is doing intercompany eliminations manually, you’re relying on individual judgment calls about what to eliminate and what to leave open. That’s fine until someone new joins the team, or someone leaves, and the institutional knowledge walks out the door. You end up with intercompany balances that neither the subsidiary nor the parent fully understands. You run into issues at audit time or during a consolidation review that force a restatement.

Getting Started

If you’re currently doing intercompany eliminations manually in Dynamics 365 Finance, your first step is to stop trying to fully automate them immediately. Instead, audit what you’re actually eliminating each month. Document the transactions, the accounts involved, the business rationale. This gives you the blueprint for what the automation should cover versus what requires manual review.

Build the elimination rules in a test environment first, and run them against three months of historical data. Don’t post the entries. Instead, compare what the system generated against what your finance team actually eliminated in those three months. Identify where the automation missed transactions or created incorrect entries. Fix the configuration. Repeat.

Once the automation covers the repetitive 80 percent cleanly, document what’s left as exception handling. Document the account pairing rules so that whoever is managing the process next year—or five years from now—understands why the automation is configured the way it is.

If you have the resources, layer on a Power BI dashboard or a Power Automate flow that validates elimination entries before posting. Even a simple check that counts invoices on both sides of the elimination catches most errors.

The close process is where finance leaders are usually most stretched during the month. Taking even two days off your close cycle is worth the implementation effort.

About Routeget Technologies

Routeget Technologies has spent years helping mid-market and enterprise finance organizations streamline their period-close processes in Dynamics 365 Finance. Intercompany elimination automation is one of the first things we look at during an implementation review because it’s one of the highest-return-on-effort improvements available. If your current close process is still mostly manual, we can help you audit what’s actually happening, design an elimination configuration that works for your subsidiary structure, and build the validation layer that keeps the automation reliable.


#IntercompanyElimination #DynamicsFinanceOps #FinanceAutomation #PeriodClose #ERPGovernance #FinanceTransformation #DynamicsFinance

Why CIOs Underestimate the Cost of Poor Sales Data Quality in Dynamics 365

Why CIOs Underestimate the Cost of Poor Sales Data Quality in Dynamics 365

Your CFO walks into your office with a question: “Why are our forecasts off by 30 percent every quarter?” Before you can answer, your VP of Sales chimes in about reps spending two hours a day manually cleaning data instead of selling. Both are describing the same invisible cost, and it’s draining millions in lost productivity and revenue visibility across your organization. Yet most CIOs budget for platform licenses and integrations while treating data quality as a business problem, not a technology one. It is, in fact, both.

Dynamics 365 Sales can deliver remarkable visibility into pipeline health and customer behavior. The platform excels at capturing, organizing, and surfacing information. But the data flowing through those systems reflects the behavior of thousands of individual salespeople who prioritize closing deals over database hygiene. When records remain incomplete, duplicated, or outdated, the platform becomes a liability: forecasts become guesses, reporting becomes hours of manual reconciliation, and decision-making suffers because nobody trusts what the dashboard shows.

The hidden cost goes far beyond compliance frustration. Poor data quality creates a cascade of operational friction that affects margins, customer retention, and employee satisfaction in ways that traditional IT budgets don’t account for.

The True Cost Architecture

Most organizations measure CRM data quality in a single dimension: “How complete is the contact record?” But the real impact spreads across at least four distinct operational costs that accumulate quickly.

First is the operational drag on sales teams themselves. When salespeople cannot trust the data they see, they replicate effort. A rep might open a contact record, find it incomplete, and spend thirty minutes calling the client to re-verify information that should already be there. This happens thousands of times a month across a medium-sized sales organization. Multiplied across annual hours and sales compensation, this single friction point can exceed six figures in lost productivity for a 50-person sales team.

Second is the cost of downstream process failures. When a lead record is incomplete or duplicated, it corrupts every downstream process that depends on it. Duplicate records lead to redundant follow-ups, wasted marketing spend, and customer frustration when they receive the same message twice. Bad data in the opportunity record means inaccurate revenue recognition, failed forecasting, and last-minute scrambles to understand why quarterly projections missed by millions.

Third is the cost of unreliable decision-making. A CFO looking at a forecast report cannot distinguish between a strong pipeline and a data quality problem. This uncertainty creates two bad outcomes: either decisions get made on incomplete information, or meetings get delayed while finance teams spend hours validating data that should be trustworthy. The cost is not always quantifiable, but it is real in terms of decision velocity and confidence.

Fourth is the cost of rework and remediation. Once data quality problems accumulate, fixing them becomes increasingly expensive. Hiring a data analyst to run one-off cleanup scripts, blocking users to perform bulk-import corrections, or buying third-party data enrichment services all represent unplanned spending that reflects poor data governance earlier in the system’s lifecycle.

Why Good Data Governance Saves More Than It Costs

The instinct to defer data governance is understandable. It requires investment in process design, user training, and often tooling. It feels like overhead when the system is already deployed and working. This thinking reverses the actual economics.

A typical medium-market organization running Dynamics 365 Sales generates 500 to 1,000 new lead or opportunity records per week across all teams and channels. Left unmanaged, data decay accelerates. Contacts move to new roles without updating their account relationship. Phone numbers become obsolete. Competitors are captured in competing fields depending on which rep filled them out. Over a year, 20 to 30 percent of records become partially corrupted or unreliable.

Establishing clear data governance on the front end prevents that decay from taking root. This means defining required fields based on business outcomes, not just technical minimums. It means automating common data entry patterns where possible using Power Automate or plugin logic. It means creating simple, non-punitive workflows that catch obvious errors at the moment of entry rather than after they’ve been analyzed and reported.

The investment horizon is short. A data governance program that costs 50,000 to 100,000 in the first year typically pays for itself within six to nine months when measured against the operational cost of poor data. A sales team that trusts their data moves faster through the pipeline. Forecasting becomes reliable, which means finance can commit with confidence. Marketing can stop buying more leads to compensate for poor conversion and instead optimize against better segmentation.

Implementation Starting Points

Data governance in Dynamics 365 is not a one-time project; it is an ongoing operational capability. Organizations that perform well typically start with three elements.

First is a clear definition of what constitutes “good data” for each entity type. This is more specific than “all required fields must be filled.” It means defining business rules such as “opportunities cannot proceed to stage 3 without a contact name, title, and confirmed budget” or “any contact created through a website form must have their source and campaign tracked.” These rules should be documented and then built into the platform using Dynamics 365 business processes and Power Apps to make them invisible to the user.

Second is a data steward function, even if it starts part-time. This person or small team owns the quality of the data flowing through the system. They don’t enter all the data themselves; instead, they establish procedures, monitor quality metrics, and coach sales and marketing teams on why the governance rules matter to their work. They also have authority to make targeted corrections and to intervene when patterns of bad data emerge from a particular source or team.

Third is ongoing monitoring through dashboards and reports that surface data quality metrics to both the operations team and to leadership. Metrics such as record completeness by account owner, duplicate detection reports, or the percentage of opportunities with populated deal stage history should be visible and trended. When leadership sees that data quality is improving, behavior changes. When sales managers see that their team’s data cleanliness affects forecast accuracy, they prioritize it.

Starting Before It Gets Worse

Most organizations do not invest in data quality until it becomes a crisis. A sales forecast misses badly and suddenly finance demands to know why. A compliance audit reveals that customer consent tracking is incomplete. A new analytics initiative fails because nobody can trust the underlying data.

The better time to invest is now, before the debt accumulates further. Dynamics 365 sales organizations running for more than two years almost always have significant data quality challenges. They are also almost always unaware of how much those challenges cost them operationally.

A focused effort to establish governance, train the organization, and implement basic controls typically takes four to eight weeks and involves both technology changes and process discipline. The return in operational clarity, team velocity, and decision confidence arrives within months. For a CIO, data governance in Dynamics 365 is not an IT infrastructure project; it is a business transformation initiative that returns value faster than most other platform investments.

The question is not whether your organization has a data quality problem. It does. The question is whether you address it by design or by crisis.


Routeget Technologies specializes in Dynamics 365 implementations and governance programs. Our Dynamics 365 consulting teams help organizations establish data quality practices that accelerate adoption and unlock the business value embedded in the platform.


#SalesDataQuality #Dynamics365CRM #DataGovernance #SalesOperations #CRMImplementation #DataManagement

Why CIOs Underestimate the Cost of Poor Sales Data Quality in Dynamics 365

Why CIOs Underestimate the Cost of Poor Sales Data Quality in Dynamics 365

Your CFO walks into your office with a question: “Why are our forecasts off by 30 percent every quarter?” Before you can answer, your VP of Sales chimes in about reps spending two hours a day manually cleaning data instead of selling. Both are describing the same invisible cost, and it’s draining millions in lost productivity and revenue visibility across your organization. Yet most CIOs budget for platform licenses and integrations while treating data quality as a business problem, not a technology one. It is, in fact, both.

Dynamics 365 Sales can deliver remarkable visibility into pipeline health and customer behavior. The platform excels at capturing, organizing, and surfacing information. But the data flowing through those systems reflects the behavior of thousands of individual salespeople who prioritize closing deals over database hygiene. When records remain incomplete, duplicated, or outdated, the platform becomes a liability: forecasts become guesses, reporting becomes hours of manual reconciliation, and decision-making suffers because nobody trusts what the dashboard shows.

The hidden cost goes far beyond compliance frustration. Poor data quality creates a cascade of operational friction that affects margins, customer retention, and employee satisfaction in ways that traditional IT budgets don’t account for.

## The True Cost Architecture

Most organizations measure CRM data quality in a single dimension: “How complete is the contact record?” But the real impact spreads across at least four distinct operational costs that accumulate quickly.

First is the operational drag on sales teams themselves. When salespeople cannot trust the data they see, they replicate effort. A rep might open a contact record, find it incomplete, and spend thirty minutes calling the client to re-verify information that should already be there. This happens thousands of times a month across a medium-sized sales organization. Multiplied across annual hours and sales compensation, this single friction point can exceed six figures in lost productivity for a 50-person sales team.

Second is the cost of downstream process failures. When a lead record is incomplete or duplicated, it corrupts every downstream process that depends on it. Duplicate records lead to redundant follow-ups, wasted marketing spend, and customer frustration when they receive the same message twice. Bad data in the opportunity record means inaccurate revenue recognition, failed forecasting, and last-minute scrambles to understand why quarterly projections missed by millions.

Third is the cost of unreliable decision-making. A CFO looking at a forecast report cannot distinguish between a strong pipeline and a data quality problem. This uncertainty creates two bad outcomes: either decisions get made on incomplete information, or meetings get delayed while finance teams spend hours validating data that should be trustworthy. The cost is not always quantifiable, but it is real in terms of decision velocity and confidence.

Fourth is the cost of rework and remediation. Once data quality problems accumulate, fixing them becomes increasingly expensive. Hiring a data analyst to run one-off cleanup scripts, blocking users to perform bulk-import corrections, or buying third-party data enrichment services all represent unplanned spending that reflects poor data governance earlier in the system’s lifecycle.

## Why Good Data Governance Saves More Than It Costs

The instinct to defer data governance is understandable. It requires investment in process design, user training, and often tooling. It feels like overhead when the system is already deployed and working. This thinking reverses the actual economics.

A typical medium-market organization running Dynamics 365 Sales generates 500 to 1,000 new lead or opportunity records per week across all teams and channels. Left unmanaged, data decay accelerates. Contacts move to new roles without updating their account relationship. Phone numbers become obsolete. Competitors are captured in competing fields depending on which rep filled them out. Over a year, 20 to 30 percent of records become partially corrupted or unreliable.

Establishing clear data governance on the front end prevents that decay from taking root. This means defining required fields based on business outcomes, not just technical minimums. It means automating common data entry patterns where possible using Power Automate or plugin logic. It means creating simple, non-punitive workflows that catch obvious errors at the moment of entry rather than after they’ve been analyzed and reported.

The investment horizon is short. A data governance program that costs 50,000 to 100,000 in the first year typically pays for itself within six to nine months when measured against the operational cost of poor data. A sales team that trusts their data moves faster through the pipeline. Forecasting becomes reliable, which means finance can commit with confidence. Marketing can stop buying more leads to compensate for poor conversion and instead optimize against better segmentation.

## Implementation Starting Points

Data governance in Dynamics 365 is not a one-time project; it is an ongoing operational capability. Organizations that perform well typically start with three elements.

First is a clear definition of what constitutes “good data” for each entity type. This is more specific than “all required fields must be filled.” It means defining business rules such as “opportunities cannot proceed to stage 3 without a contact name, title, and confirmed budget” or “any contact created through a website form must have their source and campaign tracked.” These rules should be documented and then built into the platform using Dynamics 365 business processes and Power Apps to make them invisible to the user.

Second is a data steward function, even if it starts part-time. This person or small team owns the quality of the data flowing through the system. They don’t enter all the data themselves; instead, they establish procedures, monitor quality metrics, and coach sales and marketing teams on why the governance rules matter to their work. They also have authority to make targeted corrections and to intervene when patterns of bad data emerge from a particular source or team.

Third is ongoing monitoring through dashboards and reports that surface data quality metrics to both the operations team and to leadership. Metrics such as record completeness by account owner, duplicate detection reports, or the percentage of opportunities with populated deal stage history should be visible and trended. When leadership sees that data quality is improving, behavior changes. When sales managers see that their team’s data cleanliness affects forecast accuracy, they prioritize it.

## Starting Before It Gets Worse

Most organizations do not invest in data quality until it becomes a crisis. A sales forecast misses badly and suddenly finance demands to know why. A compliance audit reveals that customer consent tracking is incomplete. A new analytics initiative fails because nobody can trust the underlying data.

The better time to invest is now, before the debt accumulates further. Dynamics 365 sales organizations running for more than two years almost always have significant data quality challenges. They are also almost always unaware of how much those challenges cost them operationally.

A focused effort to establish governance, train the organization, and implement basic controls typically takes four to eight weeks and involves both technology changes and process discipline. The return in operational clarity, team velocity, and decision confidence arrives within months. For a CIO, data governance in Dynamics 365 is not an IT infrastructure project; it is a business transformation initiative that returns value faster than most other platform investments.

The question is not whether your organization has a data quality problem. It does. The question is whether you address it by design or by crisis.

—

*Routeget Technologies specializes in Dynamics 365 implementations and governance programs. Our Dynamics 365 consulting teams help organizations establish data quality practices that accelerate adoption and unlock the business value embedded in the platform.*

—

#SalesDataQuality #Dynamics365CRM #DataGovernance #SalesOperations #DynamicsConsulting

Dataverse Conditional Access & MFA: Enterprise Auth Strategy Without Breaking Power Platform

You’ve mandated that your organization must enforce conditional access policies and multi-factor authentication across all cloud services. It’s the right call from a security standpoint. Your CISO is demanding it, your compliance framework requires it, and your risk assessment puts it at the top of the priority list.

But then you hit the wall: conditional access policies that work perfectly for Microsoft 365 web applications cause Power Platform apps to stop authenticating altogether. Users can no longer access the Power Apps that run critical business processes. Your integration flows in Power Automate start failing because they’re hitting MFA challenges mid-workflow. The Dataverse API connections that your Line of Business applications depend on suddenly require interactive authentication that isn’t available in batch processing scenarios.

The tension isn’t theoretical. It’s real, it’s urgent, and it forces you to choose between security governance and operational continuity. Most organizations resolve this tension by weakening their conditional access policies, carving out exceptions for Power Platform, or exempting service accounts from MFA entirely. All of those choices push you further from true security maturity.

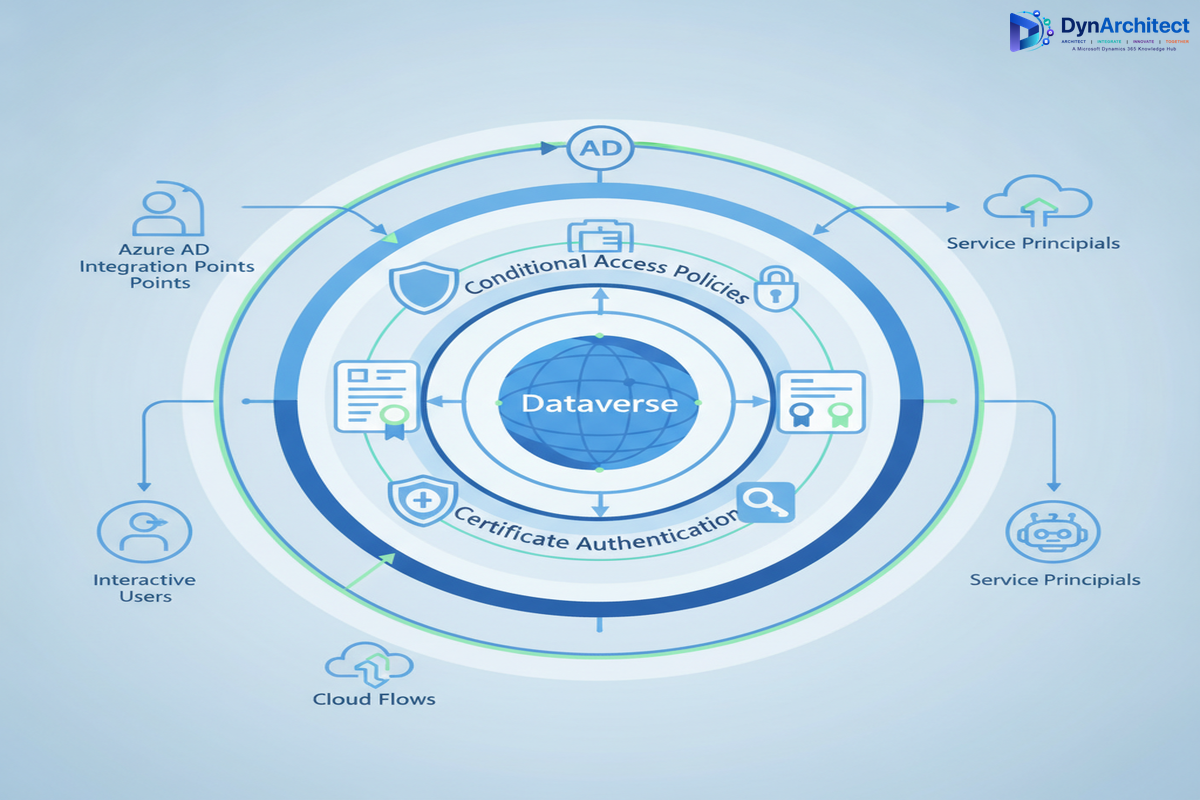
There’s a better path, but it requires understanding how Dataverse, Conditional Access, and the Power Platform authentication layer actually interact.

Why Standard Conditional Access Policies Break Power Platform

Conditional Access is a powerful feature in Azure AD. It evaluates device compliance, sign-in risk, geographic location, and dozens of other signals before granting authentication tokens. When you create a policy that requires MFA for all cloud apps, or limits access to corporate-managed devices, you’re making a sound security decision.

The problem: Power Platform applications don’t authenticate the same way that Outlook or SharePoint do.

When a user opens Power Apps in a browser, they’re presented with an interactive login page. That interface can handle MFA prompts, device compliance checks, and the full conditional access flow. So far, so good. But many organizations use Power Apps in ways that don’t involve a browser:

  • Mobile apps built on Power Apps don’t always gracefully handle MFA challenges in the middle of a user session.
  • Service accounts that run cloud flows in Power Automate are trying to authenticate without user interaction, which violates the interactive requirement of most conditional access policies.
  • Custom applications that use the Dataverse Web API through a service principal must request tokens in a non-interactive context. If your conditional access policy requires MFA or device compliance checks, the token request fails.
  • Integration scenarios where your on-premises LOB application authenticates directly to Dataverse hit the same wall.

The Dataverse API itself doesn’t block these scenarios. Azure AD’s conditional access policies do. The authentication platform is saying, “I need interactive user presence to validate MFA,” but the application doesn’t have a way to provide it.

The Real Cost of Over-Exempting Service Accounts

When token requests fail, the most common workaround is to exempt service accounts from conditional access policies. If you carve out an exclusion for all accounts in a particular group, those accounts no longer need to satisfy MFA requirements, even though their access might be just as sensitive as any human user’s.

This creates a security problem that goes deeper than it first appears:

First, service accounts become targets. If a threat actor gains access to a service account password, they have a golden ticket to your Dataverse environment without triggering MFA challenges. They can run integration flows, extract data, or modify records in batch operations that are harder to detect than interactive user activity.

Second, the exemption tends to expand over time. One service account becomes two. Two becomes five. Then you’re exempting entire groups. The exception becomes the rule, and your conditional access policy devolves into a symbolic gesture rather than a functioning security control.

Third, you lose the audit trail. When a service account isn’t subject to conditional access policies, you don’t get the same visibility into what it’s doing. Azure AD doesn’t log conditional access evaluations for exempt accounts. Your security team can see that the account authenticated, but not whether it was accessing data from an expected location, or whether the request exhibited anomalous characteristics.

Implementing Conditional Access for Power Platform Without Breaking Applications

The solution requires thinking about service accounts, Power Apps clients, and Dataverse API access as three distinct authentication scenarios, each with different architectural requirements.

Scenario 1: Interactive Power Apps and Power Automate Usage

This is the easiest scenario to secure. When a user opens Power Apps or Power Automate in a browser, they’re in an interactive context. Standard conditional access policies apply directly. You can require MFA, enforce device compliance, and apply geographic restrictions without breaking the user experience.

The key is to ensure that your Power Apps environment is registered in Azure AD as a cloud application, and that conditional access policies explicitly include it. Many organizations assume that Power Apps are covered by broad policies that target “all cloud apps,” but Power Apps needs explicit mention in the policy scope.

For Power Automate, the situation is slightly different. Cloud flows that require user interaction can handle MFA. But the moment you implement a background cloud flow, you’re in a non-interactive context. Conditional access policies that require MFA will block the token request.

Scenario 2: Unattended Cloud Flows and Service Accounts

This is where most organizations struggle. A cloud flow that processes orders, sends notifications, or synchronizes data is running without a user present. It needs a way to authenticate to Dataverse without triggering an MFA challenge.

The recommended approach is to use a managed identity or a service principal with a certificate-based credential, combined with a conditional access policy that evaluates non-interactive sign-ins differently than interactive ones. Instead of requiring MFA for all accounts, your policy should:

  • Require MFA for interactive sign-ins from all user accounts.
  • Skip MFA for service accounts or managed identities, but enforce stronger authentication (certificate-based credentials instead of passwords).
  • Apply additional controls to service accounts, such as restricting geographic locations or requiring authentication from specific networks.

The idea is that MFA is one control among many. If you compensate for the absence of MFA with other controls (certificate authentication, network restrictions, IP allowlisting), you maintain a strong security posture without blocking legitimate application access.

Scenario 3: Custom Applications and Direct Dataverse API Access

When a Line of Business application calls the Dataverse Web API directly, it’s requesting a token using application credentials. This is always a non-interactive flow. Conditional access policies that block non-interactive sign-ins will block this access.

Here’s where conditional access policies designed for interactive users start to feel restrictive. Your policy might say “Require MFA and a corporate device,” but neither condition can be evaluated for a non-interactive application. You’re forced to choose between blocking the integration or exempting the service account.

The better solution is to use a service principal with certificate-based authentication, combined with conditional access policies that allow certificate-authenticated service accounts to authenticate without MFA, but apply other compensating controls: network-based restrictions, role-based access control, and comprehensive audit logging.

Designing the Authentication Flow

Here’s how to architect this at the enterprise level:

Step 1: Segment Your Conditional Access Policies by Sign-In Type

Create two distinct conditional access policies: one for interactive sign-ins and one for non-interactive sign-ins. The interactive policy can be strict (require MFA, device compliance, geographic restrictions). The non-interactive policy should be more lenient on the authentication factor, but compensate with additional controls.

Step 2: Use Certificate-Based Credentials for Service Principals

Never use passwords for service accounts that need to authenticate to Dataverse. Certificates are more secure, easier to rotate, and compatible with conditional access policies that distinguish between interactive and non-interactive flows.

Step 3: Implement Network-Based Restrictions

Use conditional access policies to restrict service accounts based on network location. If your integration platform is running on premises, create a policy that allows your service principal to authenticate only from that server’s IP address. This adds a layer of security: even if credentials are compromised, the attacker can’t authenticate from an arbitrary location.

Step 4: Enable Comprehensive Logging and Monitoring

Enable Azure AD sign-in logs and audit logs. Monitor for sign-in failures, authentication attempts from unexpected locations, large batch operations, and privilege elevation. Use Azure Sentinel or a SIEM to correlate these signals and alert on anomalous activity.

Step 5: Test and Validate Before Enforcement

Before enforcing conditional access policies broadly, test them with your Power Platform applications, integrations, and service accounts. Use the conditional access policy’s report-only mode to see which authentication attempts would be blocked, then adjust policies to allow legitimate scenarios.

Implementation Challenges and How to Avoid Them

Challenge 1: Power Apps and Power Automate Have Different Requirements

Power Apps desktop application, mobile apps, and cloud flows each have slightly different authentication behavior. Test each scenario in your environment.

Challenge 2: Certificate Rotation Is Easy to Forget

Service principals with certificate-based credentials need regular rotation, typically every 1 to 2 years. Implement automated certificate rotation using Azure Automation or App Service certificate management.

Challenge 3: Conditional Access Policies Interact With Each Other

If you have multiple policies, they’re all evaluated. A token request must satisfy all applicable policies. Regularly review your policy set and consolidate where possible.

The Path to Zero Trust

Implementing conditional access and MFA for Power Platform and Dataverse is a step toward Zero Trust security architecture. Instead of trusting an account because it has MFA enabled, you trust accounts based on multiple signals: device state, location, authentication method, audit trail, and runtime behavior.

For Dataverse environments that handle sensitive data or run mission-critical processes, this level of security maturity is essential. The key is to design your authentication architecture around your actual use cases, not around a generic policy that exempts half your accounts.

Your CISO wants to see conditional access and MFA enforced. Your application owners need Power Platform and integrations to work reliably. These goals aren’t in conflict if you architect the authentication layer thoughtfully.

Business Central Production Scheduling: Why Visual Scheduler Configuration Fails When Demand Patterns Change

Production scheduling in Business Central sounds straightforward until you implement it at scale. The visual production scheduler promises drag-and-drop job sequencing and real-time capacity planning. Deploy it and discover that your demand patterns don’t fit the assumptions the system bakes into its default behavior. Planners revert to spreadsheets within weeks. The scheduler wasn’t broken; the configuration was incomplete.

The visual production scheduler in Business Central sits between shop floor execution and demand planning. It maps jobs to work centers, respects capacity constraints, and surfaces bottlenecks visually. But it works only when three conditions align: demand forecasts are stable, work center capacity is fixed, and job dependencies follow predictable patterns. Change any one of those, and the scheduler either produces schedules that don’t work or gets abandoned for manual planning.

Why Visual Scheduling Breaks Under Real Demand

Most implementations configure the scheduler once at go-live, assume demand won’t shift significantly, and leave it. Demand does shift. Seasonal patterns emerge. Customers request expedited jobs. Supply constraints force substitution of materials that process differently. The visual scheduler has no feedback loop; planners see outdated capacity assumptions in their schedules but have no way to tell the system that the underlying model has changed.

The core issue is that the scheduler operates on historical work center capacity and fixed routing assumptions. When a customer order arrives that doesn’t match the standard bill of materials or when a work center consistently underperforms its configured hours available due to changeover time or quality hold-ups, the scheduler still assumes standard capacity. Planners know the real constraint (the paint booth runs six hours a day, not eight, because of cure time between jobs), but the system doesn’t. Schedules become fiction.

Adding seasonality creates a secondary failure mode. Winter orders require different sequencing than summer demand. Heat-treating capacity bottlenecks shift based on product mix. The scheduler can’t recognize these seasonal patterns because configuration is static. A planner building schedules manually can say, “December through February, we prioritize thinner stock because it moves through coating faster.” The visual scheduler just sees jobs and available hours and proposes sequences that look optimal on the Gantt chart but fail in execution.

The Configuration Reality

Setting up the visual scheduler correctly requires knowing your capacity model in detail before you have execution data. That’s the uncomfortable truth. You need to define work center hours, parallel or sequential capacity, setup and teardown time, quality hold periods, material feed time, and routing flexibility. Get any of those wrong, and schedules drift immediately from what the system proposes to what planners can actually execute.

Most small and medium manufacturers don’t have this data documented at configuration time. They know their shop floor, but they don’t have it formalized into the work center master in Business Central. So they estimate. The estimates are close but not exact. Schedules are therefore slightly off from day one. The delta is small enough that planners don’t notice for weeks, but once they do, credibility in the tool evaporates.

Diagnosis: When Schedules Stop Matching Reality

The failure usually manifests as a mismatch between what the scheduler says can be done and what actually ships. A planner creates a schedule showing three jobs fitting into a work center in a day. The first job completes on time, but the second never starts because the first consumed more setup time than the system assumed. The planner gets blamed for a bad schedule. The scheduler gets blamed for being unrealistic. Neither blame is accurate; the system doesn’t know the real setup time.

Spot this problem early by comparing historical throughput data against scheduler assumptions. Pull actual shop floor execution history and overlay the capacity assumptions in each work center definition. If real throughput is 15 percent lower than configured, the system is optimistic. If throughput is 15 percent higher, the system is conservative (less common, but it happens when planners are very efficient or when the scheduler’s assumptions about parallel work are overstated). The gap is your calibration opportunity.

Three Production-Ready Fixes

The most effective fix is to build a demand-responsive scheduling loop. Instead of assuming demand is stable, capture actual demand patterns over a rolling window (usually 3-6 months of order data) and re-baseline the scheduler assumptions quarterly or semi-annually. This doesn’t require expensive plugins; it requires discipline in the operations team to review throughput variance and update work center capacity definitions when patterns change.

Second, implement a hierarchical scheduling approach. Use the visual scheduler for the primary constraint (often one critical work center) and leave everything else to manual planning or automated sequencing. Don’t try to optimize the entire job shop simultaneously; optimize the bottleneck. Everything else sequences around it. This reduces the configuration surface and makes the system more robust to planning changes.

Third, establish a feedback cycle between planners and the master scheduler. Every two weeks, have the planner who lives with the schedule review it and flag five jobs that were either much easier or much harder to execute than the system predicted. Feed those observations back into work center definitions. This is operational overhead, but it’s the operational overhead that keeps the scheduler aligned with reality instead of chart fantasy.

When to Accept Spreadsheets Instead

Not every manufacturer can or should use the visual scheduler. If your demand patterns change weekly, your jobs have highly variable routing, or your work centers have truly shared capacity across unrelated product families, the scheduler will always lag reality. In those cases, accept that planners will use spreadsheets or written job cards and build Business Central to support that workflow. Track scheduled completion dates and actual completion dates, but don’t pretend a static scheduler will optimize a fundamentally dynamic shop floor.

For manufacturers with repeatable products, stable demand patterns, and one or two clear bottlenecks, the scheduler is valuable. For job shops or custom manufacturers, it’s decoration.

Moving Forward

The visual production scheduler in Business Central is a tool, not a solution. It works best when you know your constraints and keep them documented. It fails quietly when assumptions drift from reality without anyone noticing until schedules stop matching execution. The organizations that sustain scheduler use treat it as a system that needs constant calibration, not a one-time configuration.

Start with the simplest possible scheduler setup: one work center, one product family, one demand pattern. Get that right before adding complexity. Use the first three months of data to calibrate. Then decide whether to expand or whether your planners are already doing a better job with their current method and the scheduler will just slow them down. That’s the conversation that happens too late in most implementations, when the scheduler is already abandoned.

About Routeget Technologies: With over a decade of Business Central implementation experience across discrete, process, and hybrid manufacturers, Routeget helps organizations design production planning systems that planners actually use. Our consultants focus on aligning system configuration with operational reality rather than forcing operations to match system assumptions.


#BusinessCentralManufacturing #ProductionScheduling #ManufacturingERP #JobShopScheduling #CapacityPlanning #BusinessCentral #SupplyChainOptimization #SmallManufacturing

AI-Powered Lead Scoring in Dynamics 365 Sales: Turning Raw Data Into Revenue Priority

Your sales team has access to thousands of leads. The problem is not finding prospects; it is identifying which ones are worth the time of your most expensive salespeople. Most organizations still rely on a combination of manual CRM notes, email volume, and gut feel to determine which leads get attention. The result is predictable: sales reps work randomly through their pipeline, cold accounts consume their bandwidth, and opportunities grow stale while tier-two prospects wait.

Dynamics 365 Sales, combined with AI Builder and Power Automate, offers a practical alternative: automated lead scoring that continuously evaluates prospect behavior and intent signals, surfacing the highest-probability deals to your team. This is not a generic tactic; it is a specific system that assigns numerical scores to every lead based on your own historical conversion data, and then uses those scores to automatically route, prioritize, and stage deals. For many midsize and enterprise sales organizations, implementing this correctly compresses sales cycles, improves win rates, and frees your team to focus on closing rather than hunting.

Why Scoring Beats Instinct (And Why Dynamics 365 Is the Right Platform for It)

Lead scoring rests on a simple premise: your best leads look like your past best deals. If you can identify the early signals that characterized your won deals, you can apply those same signals to your pipeline in real time.

In practice, scoring requires three things. First, you need historical data: a clean set of opportunities that closed as won, complete with the lead source, company size, industry, engagement pattern, and other attributes that came before the win. Second, you need an algorithm that maps those attributes to probability. Third, you need a system that applies that scoring continuously, updates scores as new activity arrives, and feeds the results back to your sales team in a way they actually use.

Dynamics 365 Sales provides all three. The platform already holds your historical opportunity data and your lead attributes. AI Builder, Dynamics’ no-code machine learning tool, can ingest that historical data and generate a scoring model without requiring you to hire data scientists or build a custom pipeline. Power Automate can then apply that model to every new lead and opportunity, and can automatically update scores as activity accumulates. The result is a lead scoring system that lives inside the CRM where your team already works, rather than in a separate tool that requires them to toggle between windows.

For a sales leader, the advantage is clear. A scoring model trained on your own data will reflect your unique sales motion, your typical deal cycle, and the specific attributes of your market. An off-the-shelf scoring engine, by contrast, is built on generic B2B assumptions that may not match your business at all. When you train your model on your own closed deals, your salespeople are more likely to trust the scores, and they are more likely to act on them. That trust translates to adoption, and adoption translates to impact.

The Lead Scoring Workflow: How It Works in Practice

Setting up automated lead scoring in Dynamics 365 requires clear thinking about what you are trying to score and how you will use the scores once they are calculated.

Start with definition. Decide whether you are scoring leads (unconverted prospects) or opportunities (qualified leads that have entered your formal sales process), or both. Most organizations score at the opportunity level, because that is where actual revenue potential becomes measurable. Define your target variable: are you predicting whether a deal will close, or are you predicting deal size, cycle length, or the probability of a specific outcome?

Next, assemble your training data. Go back through your closed opportunities for the past 12 to 24 months. For each closed opportunity, document the attributes that were visible early in the deal: company industry, company size (headcount or revenue), whether they came from inbound or outbound marketing, how many email interactions occurred before the first sales conversation, whether a technical evaluation took place, how many stakeholders were involved. Then add the outcome: did the deal close? For closed-won deals, record the deal size and the time from initial contact to close.

This is the dataset that AI Builder will learn from. The more historical data you assemble, the more reliable the model. If you have fewer than 50 closed-won deals in your history, scoring will be difficult; if you have 200 or more, you have strong signal.

Upload that dataset into a spreadsheet or a Dataverse table, or connect AI Builder directly to your Dynamics 365 opportunity list. AI Builder’s automated machine learning will ingest the historical data, identify which attributes most strongly correlate with closed-won outcomes, and generate a scoring model that assigns a probability to new opportunities based on their current attributes.

Once the model is trained and validated, use Power Automate to apply it. Create a cloud flow that triggers whenever a new opportunity is created or whenever an activity is recorded against an existing opportunity. The flow calls the AI Builder scoring model, collects the predicted score, and writes it back to the opportunity record in a custom Score field. You can also set up automatic actions triggered by score thresholds: when an opportunity crosses above 70% probability, automatically assign it to your top sales rep and send a summary email to the sales manager.

The Business Case: Impact You Can Measure

The value of lead scoring shows up in three areas, all measurable.

First, sales team efficiency. When leads are scored and routed based on probability, your best salespeople spend their time on high-probability deals rather than randomly working through a queue. In practice, this often means a 20 to 30 percent reduction in the time spent on early-stage qualification, and a corresponding increase in the number of high-value conversations happening per week. You are not changing headcount; you are redistributing where existing salespeople spend their effort.

Second, pipeline velocity. Deals that are accurately scored tend to move through your pipeline faster. Sales reps focus on moving high-probability deals to close, rather than keeping stalled opportunities open indefinitely. Early action on low-probability deals (either aggressive qualification or formal disqualification) clears the pipeline and keeps your forecast clean. For a $10 million sales organization, even a modest acceleration of your average deal cycle by 10 to 20 percent can add millions of dollars to annual revenue.

Third, forecast accuracy. When leads are continuously scored based on consistent criteria, your sales managers can forecast pipeline with much greater confidence. Instead of relying on a subjective assessment of deal status, managers can look at the aggregate score distribution of their pipeline and predict with reasonable accuracy what will close. This precision becomes particularly valuable if you operate with quota management, revenue recognition, or board-level reporting that requires predictability.

Common Mistakes and How to Avoid Them

Most organizations do not fail to deploy lead scoring; they fail to deploy it correctly, and then they abandon it.

The most common mistake is training a model on data that is too thin or too old. If your training set includes only 20 closed opportunities, or if those opportunities closed more than three years ago, the model will perform poorly on new data. Build your training dataset deliberately. If you have a young sales organization with limited historical data, start with a smaller set of attributes that you are confident are predictive (perhaps company size, industry, and sales motion source), and plan to retrain the model every six months as you accumulate more closed deals.

The second mistake is treating the score as a rank. Sales reps sometimes interpret a lead with a 65% score as inferior to one with an 80% score, and deprioritize it accordingly. In reality, both are valuable; the difference is risk profile. A 65% score means the deal has a reasonable chance of closing, but with more uncertainty. A 80% score means the deal is more likely to close, but may be smaller or further away. Train your team to interpret scores as probability, not hierarchy, and to view all scores above your qualification threshold (typically 50 to 60%) as worthy of active pursuit.

The third mistake is deploying the score without changing your process. Simply displaying a score in Dynamics 365 will not change behavior; salespeople will ignore it if it feels disconnected from the way they work. Instead, wire the score into your sales process. Use it to trigger automatic task assignments, to rank leads in your daily view, or to flag deals that have stalled despite a high score. Make the score a structural part of your daily work, not a novel data point that sits on the side.

Getting Started: The First 90 Days

If you decide to implement lead scoring, plan for a three-month project. Weeks one and two focus on data assembly. Work with your finance and sales operations teams to pull together your closed opportunity history, verify data quality, and prepare the training set.

Week three covers modeling. Upload your data to AI Builder, train a scoring model, and validate it against a holdout sample of historical data. Most models will achieve 70 to 80% accuracy on historical data; that is expected.

Weeks four through six focus on integration. Build the Power Automate flow that applies the model to new opportunities and activities. Set up automatic actions. Write a short guide for your sales team explaining what the scores mean and how to use them.

Weeks seven through 12 are deployment and refinement. Roll out scoring to your team. Collect feedback. Monitor which leads are being acted on and which are being ignored. Refine your thresholds. After 90 days, pause and evaluate: did sales cycle compress? Did revenue increase? Did forecast accuracy improve? Use those results to decide whether to expand the model or refine it further.

Conclusion

AI-powered lead scoring in Dynamics 365 Sales is not a futuristic concept; it is a practical system available to any sales organization with 50 or more closed deals and the willingness to spend 12 weeks implementing it. The payoff is significant: freed-up sales time, faster deals, and more predictable revenue. For sales leaders tasked with improving efficiency without adding headcount, or for IT leaders evaluating how to deliver business value from Dynamics 365, a lead scoring implementation offers measurable, defensible ROI.

At Routeget Technologies, we have built lead scoring systems for dozens of Dynamics 365 organizations. The implementation patterns we have learned apply to most sales organizations: start with clean historical data, train a model conservatively, integrate it into your daily sales process, and refine over time based on real results. If your sales team is currently managing leads by feel or by gut, a data-driven approach to prioritization will likely produce immediate impact.


#Dynamics365Sales #AILeadScoring #SalesEnablement #AIBuilder #SalesOptimization #CRM #LeadManagement #SalesAutomation

Power BI Financial Dashboards for Dynamics 365 Finance: Building the Business Case Without Overcommitting Resources

Power BI financial dashboard with budget variance analysis and cash flow metrics

Your Dynamics 365 Finance implementation is live. You saw a beautiful demo six months ago showing real-time cash flow forecasts, interactive budget variance analysis, and executive dashboards that updated daily. The vendor closed by saying, “You can build this in Power BI in a few weeks.”

Now, three months into your Power BI financial analytics initiative, your internal team is debating whether to hire a permanent analytics hire, your costs have tripled, and you’re six weeks behind on the first dashboard. That demo didn’t account for your Chart of Accounts structure complexity, your subsidiaries’ separate accounting policies, or the fact that your finance team still reconciles GL accounts in a spreadsheet no amount of automation can entirely replace.

This gap between demo and reality is not unusual. It is the norm. Finance organizations that understand this gap upfront build realistic programs that deliver value in 18 to 24 months. Those that don’t end up with abandoned dashboards, frustrated finance teams, and justifiably skeptical CFOs.

What Power BI Actually Brings to Finance

Power BI is a visualization and analytics tool. It is not magic, and it is not a substitute for good financial process discipline. What it does extremely well is surface patterns and relationships in data that spreadsheets obscure, refresh reporting faster than month-end manual consolidations, and give finance teams access to their own analysis without waiting for IT to run scripts.

For Dynamics 365 Finance specifically, Power BI connects directly to your financial data through Dataverse, Power BI’s native Dynamics 365 connector, or Azure Synapse Link for larger datasets. This means your dashboards can show live GL balances, budget variances, or cash flow trends without your finance team building and maintaining ETL jobs in Excel. That alone is valuable. It also means your governance and data accuracy problems do not disappear; they become visible much faster.

The Real Cost of Financial Analytics

Most finance organizations underestimate three cost categories when planning Power BI dashboards.

First: Data Preparation and Model Building. Your chart of accounts is not flat. Your GL transactions include reversals, accruals, and period-end corrections. Your budget data lives in multiple systems (ERP, planning tools, legacy spreadsheets). Your actuals do not reconcile automatically to budget because your organization budgets differently than you post GL transactions. Building a semantic model that surfaces truth instead of confusion requires someone (or a team) to understand your financial processes deeply enough to build that logic in Power BI’s data model.

A consultant or senior analyst can build a basic cash flow dashboard in two weeks. Building a GL variance analysis dashboard that your business partner actually trusts because they understand where the numbers came from requires six to eight weeks of data modeling, testing, and refinement. Multiply this by five to ten dashboards, and you are talking about 10 to 15 person-months of skilled analytical work before you have a production-grade Power BI program.

Second: Governance, Security, and Access Control. Power BI’s row-level security (RLS) model is powerful and flexible. It is also complex. If you need controller-level access to consolidated GL but division heads to see only their own GL, and you want budget managers to compare actual to budget within their business unit, you need a well-designed RLS strategy built on top of your Dynamics 365 security roles.

Adding RLS after dashboards are built is expensive. Building it from the start means taking time to model your organizational hierarchy, decide how P&L responsibilities map to GL structures, and test that every user sees exactly what they should. In large organizations, this is not a week-long project. It is often three to six weeks of iterative testing, edge-case resolution, and alignment with your controller’s office.

Third: Change Management and Training. Your finance team has used the same reports for five years. A new dashboard that shows variance differently, calculates metrics in an unfamiliar way, or requires them to self-serve analysis instead of calling the accounting department will be questioned. Finance organizations move slowly because accuracy matters. Spending time to train your finance team, document assumptions in your dashboards, and let them develop confidence in new analytics before expanding access is essential. Organizations that skip this step often see adoption stall after the initial roll-out.

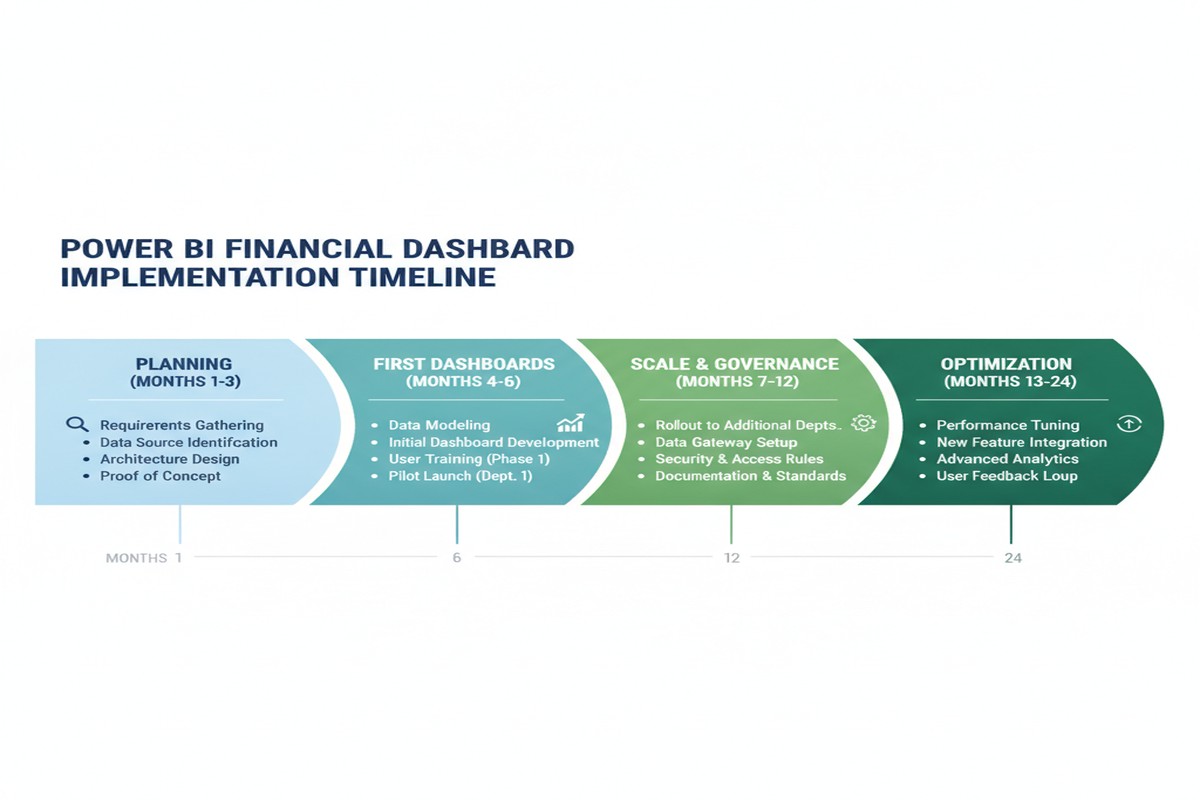
Timeline showing 24-month implementation roadmap for Power BI financial analytics

Timeline Reality for Finance Dashboards

A realistic timeline for a production-grade Power BI financial analytics program looks like this:

Months 1 to 3: Planning, Architecture, and Foundation Building. You define which dashboards matter most. You audit your GL structure and data quality. You design your semantic model. You plan your security model. You do not build dashboards yet. This period is invisible to executives but essential to avoid rebuilding everything later.

Months 4 to 6: First Dashboards and Pilot Testing. You deliver one to two core dashboards (GL overview, budget variance, or cash flow) to a pilot group of power users. You iterate based on their feedback. You refine the data model. You document assumptions. You do not declare victory.

Months 7 to 12: Scale and Governance. You build three to five additional dashboards based on lessons from the pilot. You harden your security model. You establish SLAs for data refresh (daily, hourly). You set up processes for your finance team to request new analysis without recreating dashboards.

Months 13 to 24: Optimization and Organizational Adoption. Your dashboards are live for most of the organization. You optimize performance, add forecasting or predictive capabilities, and integrate with planning tools. Real adoption happens here, not during launch.

Eighteen months is a conservative estimate for a mid-market organization. If you are larger or your GL is more complex, add six months. If you try to compress this to nine months, you will compromise on governance or data quality, and you will pay for it later.

Realistic ROI and Business Case Framework

Financial analytics ROI is real but indirect. You should not expect Power BI alone to reduce headcount. What you should expect is that your finance team spends less time on manual reporting and more time on analysis, and that finance leaders can answer ad hoc questions faster.

For a CFO building a business case, frame the ROI around three levers:

Time Savings. If your month-end close takes ten days and two weeks of follow-up reporting questions, and Power BI cuts that to eight days with faster ad hoc answer time, quantify that. At a typical all-in cost of $200 to $250K annually for a finance analyst, saving 10 to 20 percent of their time across the team is meaningful.

Decision Velocity. Finance leaders who can answer a business partner’s variance question in hours instead of days make better decisions. Quantify this carefully (it is subtle), but it is real. Include it in your business case as a strategic benefit, not just cost savings.

Risk Mitigation. Faster visibility into GL accuracy, budget performance, and cash flow trends reduces surprises at board meetings. This is hard to quantify but worth naming in your business case, especially if you have had historical GL variance issues or cash flow forecasting failures.

Pragmatic Next Steps

Before committing to a large Power BI investment, take these steps:

Start with a pilot. Pick one financial process (GL variance analysis or monthly cash flow forecasting) and build a proof of concept with one to two analysts over 8 to 12 weeks. Spend one week on planning. Spend six weeks on data modeling and development. Spend one week on pilot testing. Use what you learn to scope the larger program.

Assess your data quality. If your GL balances don’t reconcile to your trial balance, or your budget data lives across five systems, fix that first. Power BI will not solve data quality problems; it will highlight them.

Define governance upfront. Decide who owns the semantic model. Decide how often dashboards refresh. Decide how users request new analysis. These decisions are boring but essential.

Budget realistically. A multi-dashboard financial analytics program for a mid-market organization costs between $200K and $500K over 18 to 24 months, including internal team time, consulting, and platform licenses. If your CFO is not comfortable with that range, you are not yet ready for the program.

The Business Case That Actually Works

Power BI for financial analytics delivers real value. The organizations that see that value are those that plan for 18 months, budget realistically, and recognize that the real cost is not the software license or the initial implementation. It is the investment in data quality, governance discipline, and finance team capability that makes analytics actionable.

The demo you saw six months ago was real. You are just building the foundation to support it.


Routeget Technologies helps organizations build data-driven financial organizations through Dynamics 365 Finance implementations and Power BI analytics programs that actually fit your organization’s reality. Reach out to discuss your financial analytics roadmap.

#PowerBIFinance #FinancialAnalytics #DynamicsFinance #BusinessCaseAnalysis #CFOStrategy #FinancialReporting

The Power Apps Per-App Plan Is Retiring. It’s Forcing Overdue Power Platform License Optimization.

IT director and finance director reviewing a Power Platform license usage dashboard on a large office monitor

An IT director at a distribution company got her Power Platform renewal quote back in August and the per-app line item had a note attached: new purchases under that SKU were no longer available through her Enterprise Agreement’s normal channel. She had eleven apps running on per-app capacity packs, covering everything from a driver check-in tool to a rebate approval workflow, and nobody on her team had ever audited whether those apps still needed dedicated capacity or whether half their users had moved to other roles. The renewal conversation, which was supposed to be a formality, turned into a scramble to figure out what she was actually paying for, and into the kind of overdue Power Platform license optimization exercise most IT organizations keep putting off until a contract forces it.

IT director and finance director reviewing a Power Platform license usage dashboard on a large office monitor

That scramble is becoming common. Microsoft ended new sales of the Power Apps per-app plan on January 2, 2026, and the way that retirement plays out depends entirely on which purchasing channel an organization uses: Enterprise Agreement customers can keep renewing and adjusting counts through their normal true-up process, MPSA customers lose access to the SKU when their current agreement expires and get sixty days to move to something else, and CSP customers were largely unaffected, with the plan returning to availability there in early April. Three different outcomes for the same retirement, depending on how procurement happens to be structured, is exactly the kind of detail that gets missed until a renewal quote forces the question.

The timing matters because it coincides with something genuinely useful: Microsoft has finally shipped a way to see what a Power Platform license estate is actually being used for, instead of relying on procurement records and institutional memory. Getting that visibility in place before the next renewal cycle is the difference between a defensible Power Platform license optimization decision and another round of guessing.

Why Power Platform License Optimization Has Been Mostly Guesswork

Until recently, an organization trying to right-size Power Apps and Power Automate licensing had to stitch together the answer from several disconnected places: the Microsoft 365 admin center for what was purchased and assigned, PowerShell exports like Get-AdminPowerAppLicenses for a point-in-time snapshot, and whatever the CSP or EA reseller could pull from their own systems. None of those sources actually answered the question a CFO cares about, which is how many of the licenses being paid for are being used by someone doing real work in a given month.

The license consumption experience now available (in preview) inside the Power Platform admin center closes that gap. Under Licensing, administrators can pull up Power Apps and see, side by side, per-user licenses purchased against per-user licenses actually consumed by someone who launched an app in the last 90 days, per-app licenses allocated to environments against what was purchased, and any pay-as-you-go billing plans linked in the same view. It breaks down by environment as well as organization-wide, and it will export a CSV of active users, their last app launch, and which license type they used to get in. For an IT director trying to answer “do we actually need eleven per-app packs,” that is the first time the honest answer has been sitting in one screen rather than scattered across three systems and a spreadsheet someone built two years ago.

There is a companion version of this reporting for Dynamics 365 Finance and Operations environments connected through the Power Platform admin center, and it is worth calling out separately because F&O licensing carries its own compliance exposure that per-app and per-user Power Apps licensing does not. That report maps security roles to license requirements and flags users who are under-licensed for the roles they hold, over-licensed relative to what they actually use, or missing a license entirely despite having role access. For a finance organization worried about a true-up or compliance review turning up unlicensed F&O access, that role-to-license breakdown is arguably more valuable than the Power Apps consumption view, because F&O license gaps carry direct compliance risk rather than just wasted spend.

Two enterprise IT professionals reviewing a printed license usage report and laptop dashboard during a renewal discussion

What This Changes About the Renewal Conversation

None of this reporting makes the decision automatically. It gives a CIO or CFO the input needed to make a real one, and there are three moves worth having on the table before the next renewal.

The first is treating the per-app retirement as a forcing function to re-evaluate whether per-app capacity was ever the right model for those specific apps in the first place, rather than assuming the goal is simply to find a like-for-like replacement. An app used constantly by a stable group of forty employees usually still makes sense on a capacity or per-user model. An app used sporadically by three hundred people across the organization, the kind of low-frequency, wide-distribution use case Microsoft explicitly points pay-as-you-go at, is often cheaper and administratively simpler on a consumption model tied to an Azure subscription, where there is no license procurement cycle at all and the organization pays only for sessions that actually happen.

The second is using the consumption report before, not after, the renewal negotiation. A vendor conversation about right-sizing an estate is a different conversation when the buyer walks in with an export showing which per-app allocations have had zero active users in the trailing ninety days versus one built on assumptions. That data also gives Finance a defensible basis for the true-up number instead of an estimate carried forward from the prior year.

The third is recognizing that pay-as-you-go billing plans allow granular cost allocation that traditional licensing does not. Because a billing plan links specific environments to an Azure subscription, and because Azure’s own cost management and resource tagging can then split charges by team or department, an organization running Power Platform across multiple business units can get a real chargeback model instead of a Power Platform budget line that IT absorbs and never breaks down by consumer. That is a meaningfully different conversation for a CFO than “the Power Platform bill went up again this year.”

What to Do Before the Next Renewal

For an organization anywhere in the Power Platform per-app transition, the practical sequence is straightforward even if the underlying decisions are not. Pull the license consumption report for Power Apps and, if applicable, the F&O consumption report, before assuming a renewal quote reflects actual need. Segment the app portfolio by usage pattern rather than by however licenses happen to be allocated today, since a capacity pack purchased three years ago for a pilot may now be covering an app that either died quietly or scaled to a very different usage profile. Confirm which purchasing channel governs the organization’s contracts, since an EA customer facing no disruption and an MPSA customer facing a sixty-day migration window are working against very different timelines, and the MPSA customer in particular should not wait for the renewal notice to start that conversation. And treat pay-as-you-go as a genuine option for the specific subset of apps that fit its profile, rather than a fallback only considered after per-user and per-app options are exhausted.

None of this requires a platform migration or a change to how the apps themselves work. It requires pulling data that, for the first time, is actually sitting in one place, and using it to make a licensing decision on facts rather than habit. Organizations that have gone through a Power Platform license optimization exercise with us tend to find the same thing: the spend was rarely wildly wrong, but it was almost never right, and the gap between those two states is usually worth the afternoon it takes to run the report.


Routeget Technologies works with IT and finance teams on Power Platform governance and licensing reviews as part of broader Dynamics 365 and Power Platform engagements.


#PowerPlatformLicensing #LicenseOptimization #PowerAppsPerApp #PayAsYouGo #PowerPlatformGovernance #ITCostGovernance

Power Apps Delegation Limits Don’t Throw an Error. They Just Give You the Wrong Answer.

Solution architect reviewing a data table dashboard on a large monitor, illustrating enterprise data query review

A finance team at a mid-size distributor built a canvas app to flag overdue receivables. It worked perfectly in every demo. Then it went into production against a SharePoint list that had grown past 4,000 rows, and the “overdue balance” total the app displayed started coming in a little low every week, never wildly wrong, just quietly off by a shrinking or growing margin depending on how the underlying data happened to sort. Nobody got an error message. Nobody got a warning banner in the running app. The gallery rendered, the total summed, and the number was simply incomplete, because Power Apps had silently stopped looking at the data after the first 500 records.

That is the practical shape of a delegation problem, and it is one of the more consequential gaps between how canvas apps behave in the maker’s testing environment and how they behave once real data volume shows up. Power Apps delegation limits determine whether a formula gets pushed down to the data source, which processes it server-side and returns only the matching rows, or whether Power Apps has to pull a bounded chunk of records locally and evaluate the formula against that chunk alone. When delegation fails and the underlying table is larger than the configured limit, the app does not stop working. It keeps working, on a subset of the data, without saying so.

Why Power Apps delegation limits fail silently instead of crashing

A crash gets fixed immediately because someone notices. A silently truncated query gets fixed only when someone happens to reconcile the app’s output against the source system and finds a discrepancy, which in the receivables example took several weeks. For a technical team supporting Dynamics 365 or Power Platform deployments, this is the argument for treating delegation as an architecture decision made at design time, not a performance tweak applied after a slow gallery gets noticed.

The default data row limit in a canvas app is 500 records, adjustable up to a hard ceiling of 2,000 in the app’s Settings under General. Raising that number is a common instinct and a bad one to rely on as a fix, because it just moves the cliff edge further out rather than removing it; a table with 50,000 rows behaves identically whether the limit is set to 500 or 2,000; it only changes how much data has to grow before someone notices something is wrong. Microsoft’s own guidance for this reason recommends the opposite move during development: set the limit down to 1 in a test environment, which forces every non-delegable formula to reveal itself immediately with obviously wrong results, rather than leaving that discovery to production data volume.

What actually gets delegated, and what does not

Power Fx delegates a meaningful set of operations against supported data sources, including Dataverse, SharePoint Online, SQL Server, and Salesforce. Filter, Search, LookUp, and First all delegate, as do the standard comparison operators, And, Or, Not, StartsWith, EndsWith, and the core aggregates: Sum, Average, Min, Max, CountRows, and Count. Sort and SortByColumns delegate as well, with an important caveat covered below for SharePoint. The In operator delegates too, but only against a column on the base table; the moment a formula tests In against a related or lookup column, delegation breaks and the query falls back to local evaluation.

Developer typing Power Fx formula logic on a laptop with a monitor showing abstract code in the background

The non-delegable list is longer and easier to trip over than most makers expect. FirstN, Last, and LastN do not delegate. Neither does If, which means embedding conditional logic inside a Filter predicate is a common way a formula that looks delegable quietly is not. String manipulation functions including Left, Mid, Len, Lower, and Upper are non-delegable, along with Concatenate and the & operator, GroupBy, Ungroup, and type-casting functions like Text and Value. Collect and ClearCollect are non-delegable by nature, since they materialize data locally rather than querying it. A formula like Filter(Fruit, Mid(FruitName, 1, 1) = “A”) looks reasonable and reads cleanly, but because Mid cannot be pushed to the data source, it only ever evaluates against the first page of records pulled locally, meaning a record named “Pineapple” sitting past row 500 will never match a search for names starting with “P,” not because the logic is wrong, but because the function never sees that row.

SharePoint makes this worse than Dataverse does

Anyone who has built canvas apps against both SharePoint lists and Dataverse tables has felt the difference in how forgiving each source is, and the gap is documented, not just anecdotal. SharePoint does not delegate relational comparison operators (less than, greater than, not-equal) on plain text fields at all, only equality. IsBlank does not delegate against text fields either, and the commonly suggested workaround, comparing to Blank() directly, does not behave identically for genuinely empty strings versus null values, which is a subtle correctness gap worth documenting in code review rather than discovering in production.

The bigger gap sits in SharePoint’s complex column types: Choice, Lookup, Person, Group, Task Outcome, Managed Metadata, and External Data. None of these support delegated sorting, so Sort or SortByColumns against a Choice or Person field will silently fall back to sorting only the locally retrieved page. StartsWith does not work against subfields of Choice or Lookup columns. Person and Group fields only delegate on their Email and DisplayName subfields, not on other properties. A set of SharePoint system fields, including ContentType, ModerationStatus, VersionNumber, and several path-related fields, do not delegate under any function at all. UpdateIf and RemoveIf against SharePoint are handled through a batching simulation bounded by the same 500/2,000 record limit rather than a true server-side delegated operation, which matters for any flow that bulk-updates list items from within the app rather than through Power Automate.

Dataverse does not eliminate delegation limits, but it closes most of these specific gaps: relational operators work against text columns, In delegates on base-table columns consistently, and sorting against lookup and choice columns behaves as makers expect. For any canvas app expected to scale past a few thousand records with complex filtering or sorting, that difference is a legitimate factor in the SharePoint-versus-Dataverse decision, not just a licensing or governance one.

Designing around it instead of hoping around it

The most reliable pattern is to push complexity toward the data source rather than the formula bar. Where a filter needs to test a derived value, calculated columns created in Dataverse (or, with more limitation, in SharePoint) let the comparison happen against a pre-computed, delegable field instead of a runtime string function the client has to evaluate locally. Where a search needs to match across multiple text fields, Search() itself delegates and is usually a better first attempt than a hand-built Filter with concatenated conditions, since it is one of the few functions built specifically to delegate substring matching.

For teams supporting these apps in production rather than just building them, the practical safeguard is process, not just formula discipline: run the app with the row limit forced to 1 during test cycles, review any gallery, dropdown, or KPI tile driven by a filter or sort against a table that could plausibly exceed a few hundred rows in production, and treat a yellow delegation warning triangle in Power Apps Studio as a defect ticket rather than a cosmetic nag to dismiss. The warning is not a suggestion about performance. It is Power Apps telling the maker, in the only language it has, that the number on screen may not represent all of the data.

We’ve walked enough Dynamics 365 and Power Platform clients through exactly this kind of discovery, usually during a post-go-live support engagement rather than a planned architecture review, to treat delegation as a first-week design conversation on every canvas app project involving a table that is expected to grow. It is a cheap conversation to have early and an expensive one to have after a finance report has been quietly wrong for a month.


#PowerApps #PowerFx #CanvasApps #Dataverse #SharePointOnline #EnterpriseArchitecture #LowCodeDevelopment

The Business Central Payables Agent Drafts Invoices. It Still Won’t Match a Purchase Order.

Finance professional reviewing an AP invoice matched against a purchase order and receipt on a computer dashboard

A controller at a mid-sized distributor recently described the moment her AP team realized what they’d actually bought. A vendor emailed a PDF invoice to the shared mailbox Business Central was watching, and within a few minutes the Business Central Payables Agent had pulled the vendor, mapped the line items to a G/L account, and dropped a fully drafted purchase invoice into the review queue. It looked like the AP clerk role had been automated away. Then someone asked whether the agent had checked the invoice against the purchase order or the goods receipt behind it, and the honest answer was no. It never does. Purchase order matching sits on Microsoft’s own published list of things the Payables Agent explicitly does not do, right alongside approval flows and anomaly detection.

That gap matters more than it sounds like it should, because Microsoft shipped a separate, unrelated feature in the same Business Central 2026 release wave that does handle order and receipt matching, and the two are easy to mistake for one connected capability. They are not. Understanding where the line actually falls is the difference between a rollout that genuinely reduces AP workload and one that quietly removes a control your finance team assumed was still there.

What the Business Central Payables Agent Actually Automates

The agent’s job starts and ends with turning an inbound PDF into a usable draft. It monitors a dedicated mailbox, pulls unread invoice emails, and runs each attached PDF through Azure Document Intelligence to extract the vendor name, amounts, and line detail. From there it tries to match the sender to an existing vendor record in Business Central; if it can’t do that confidently, it stops and asks a designated supervisor for instructions rather than guessing. When a new vendor genuinely needs to be created, the agent prefills the card from what it read off the invoice, but the record comes in blocked by default until a person reviews and releases it. Only after the vendor question is settled does the agent move to drafting the invoice itself, using historical purchasing patterns and item references to suggest which G/L accounts the line items belong to.

Finance professional reviewing an AP invoice matched against a purchase order and receipt on a computer dashboard

None of that becomes a posted transaction on its own. Every draft lands in a review queue where a human has to confirm, correct, or reject it before it becomes an actual purchase invoice, and Microsoft is direct about why: the agent’s account classifications and vendor matches “can be inaccurate,” and it has no way to evaluate business context the way a person reviewing the invoice would. That’s a reasonable design for what the agent is built to do, which is eliminate the manual keying and re-typing that eats the first half of most AP cycles. It is not built to answer the question of whether what you’re about to pay actually matches what was ordered and what showed up on the dock.

The Three-Way Match Gap Nobody’s Marketing Slide Mentions

Three-way matching, the practice of confirming an invoice against its purchase order and its receipt before payment, is the control most finance organizations rely on to catch overbilling, duplicate charges, and phantom deliveries. The Payables Agent doesn’t perform it. That’s not a bug or an oversight Microsoft is quietly working around; it’s a documented limitation, and as of this writing the agent itself is still labeled a public preview release rather than a finished, generally available feature.

What makes this genuinely confusing for a rollout is that the same 2026 wave 1 release also introduced “Match Purchase Invoices to Multiple Order and Receipt Lines,” a completely separate, non-AI capability built directly into standard purchase order processing. It adds a “Get Order Lines” action that surfaces received-but-uninvoiced or unreceived order lines, a “Matched Order Lines” page for reviewing and adjusting how invoice lines tie back to multiple purchase orders and partial receipts at once, and a “Receipt on Invoice” toggle that can auto-generate the receipt when a linked invoice posts. It reached general availability in April 2026, on its own timeline, with its own set of exclusions that keep it away from prepayment orders, item charges, projects, subcontracting, blanket orders, and intercompany transactions. Nothing in Microsoft’s documentation ties these two features together, and there’s no evidence the Payables Agent hands its drafts off into this matching workflow automatically. They simply shipped in the same release, aimed at the same purchase-to-pay process, and solve two different halves of the problem without talking to each other.

The practical result is that an AP team running the Payables Agent still needs to run invoices through order and receipt matching separately, whether that means the new native matching screens, an existing three-way-match process, or a third-party tool already in place. Treating the agent’s fast, clean drafts as evidence that matching already happened is exactly the kind of assumption that erodes a control environment quietly, one invoice at a time, until an audit or a duplicate payment surfaces the gap.

Consumption Billing Changes How You Budget for This

The licensing model adds a second layer finance leaders need to plan around before anyone flips this on for real volume. Copilot itself is bundled into Business Central’s Essentials and Premium subscription tiers, so the base chat and suggestion features a user sees day to day don’t carry a separate charge. Agents are different. The Payables Agent runs on Copilot Credits, a metered unit purchased through an Azure subscription, and consumption scales with how much work the agent actually does rather than with how many people are logged in. Microsoft’s own guidance is candid that it doesn’t publish a flat per-invoice rate; credit consumption depends on which features get used and what actions the agent performs on a given document, which means the honest answer to “what will this cost us” only comes from watching it run.

Hands comparing a printed purchase order against an invoice on a laptop screen during AP review

That variability lands at an awkward moment for most finance calendars. Invoice volume tends to spike at quarter-end and during seasonal peaks, which is precisely when a consumption-based bill is likely to jump, and precisely when a finance team has the least appetite for a surprise line item. Organizations used to a flat per-seat software cost don’t automatically have a forecasting habit built for variable, usage-driven spend, and marketing language that blurs “Copilot is included” with “the agent is included” doesn’t help anyone build one. There’s also a governance detail worth knowing before you assign ownership: viewing actual billing and consumption detail requires the SUPER or AGENT-DIAGNOSTICS permission set specifically. The narrower AGENT-ADMIN role that would typically administer the agent day to day does not, by itself, grant visibility into what it’s costing, so whoever ends up accountable for the Azure bill needs to be deliberately provisioned, not assumed.

What This Means for a Rollout Decision

None of this argues against adopting the Payables Agent. For an AP team drowning in PDF invoices that arrive by email in a single language, it removes a real chunk of manual entry, and the human-in-the-loop design means it isn’t going to post something wrong without a person signing off first. The documented ceilings are worth checking against your own volume before you commit to it as a strategy rather than a pilot: the agent tops out at 500 processed invoices and 100 monitored emails per day per environment, it’s validated for English only, it only reads PDF attachments up to a handful of pages and a few megabytes each, and it will not touch approval workflows or flag anomalies on its own. A high-volume, multi-language AP operation with heavy PO-based purchasing is going to run into those edges quickly.

The more useful framing for a CIO or CFO evaluating this isn’t “should we turn on AI for accounts payable.” It’s two separate questions that deserve two separate answers: does this reduce the manual work our AP team does today, and does it strengthen or weaken the matching controls we already rely on. The first answer, for the right invoice profile, is genuinely yes. The second, at least for now, is that the agent doesn’t touch that control at all, and the feature that does was built and shipped on its own, waiting to be adopted separately. Firms we’ve worked with on Business Central Copilot rollouts have had the smoothest results when they scoped the agent narrowly, ran it against real invoice volume for a full billing cycle before expanding it, and kept three-way matching exactly where it already lived rather than assuming the new AI layer had absorbed it.


#BusinessCentral #PayablesAgent #APAutomation #CopilotCredits #ThreeWayMatch #ERPGovernance