Extending Power Pages Beyond UI: Liquid Templates, Code Components, and JavaScript for Production Portal Requirements

Power Pages’ low-code interface makes building portals faster than traditional custom development. But every organization eventually hits the moment where the out-of-the-box form controls, basic table views, and standard workflows become constraints rather than features. The portal needs business logic that doesn’t fit the declarative model. Data needs to transform based on context. The user experience requires patterns Power Pages doesn’t provide natively.

At that point, technical teams face a critical decision. Many teams build custom portals in React or Vue, burning months of development and losing the Power Platform’s Dataverse integration layer. Others try to force every requirement into Power Pages’ declarative surface, resulting in fragile workarounds that break with each platform update. A third path exists: understanding how to extend Power Pages with Liquid templates, custom JavaScript, and code components without abandoning the platform’s operational advantages.

The Architecture Mismatch: Why Low-Code Hits a Ceiling

Power Pages’ strength is also its limitation. The platform provides configuration-driven portal building because that model works for the common cases: customer self-service forms, portal content, and basic lookup forms. The form engine optimizes for ease of use, not for the kind of sophisticated client-side behavior a production portal often requires.

Consider a realistic scenario. A financial institution needs a partner portal where finance directors can submit loan applications, see real-time pricing based on their organization’s profile, track application status through workflow stages, and export reports combining Dataverse data with external system information. The default Power Pages form control has no awareness of multi-step workflows. Table views don’t support the kind of conditional formatting and interactive filtering the business expects. The out-of-the-box experience feels incomplete.

This gap between what Power Pages provides by default and what production portals require is not a product limitation. It’s a signal that the team needs to step beyond configuration and into code. The opportunity is recognizing which layer to extend, which will determine the development complexity and maintenance burden of the resulting system.

Three Extension Points: Understanding When to Code

Liquid Templates are server-side templating that query Dataverse using FetchXML and render dynamic content before sending HTML to the browser. They excel at personalized content: showing customers only their records, displaying role-based form sections, or calculating KPIs in dashboards. Liquid queries run with elevated permissions, making it safe to expose read-only data that would be restricted through the client-side portal Web API. The limitation is clear: Liquid generates static HTML. Interactive behavior requires client-side code.

JavaScript and Portal Web API enable client-side interactivity. Custom JavaScript embedded in web templates can make asynchronous Dataverse calls for create, retrieve, update, and delete operations. This supports sophisticated portals: real-time filtered dashboards, search-and-filter experiences, and form interactions without page reloads. The portal Web API is constrained by design (specific tables and columns exposed, row-level security enforced), which means portals are secure by default. The tradeoff: teams sometimes discover in production that row-level security filters block the data they need. Performance matters here too. Portals making dozens of sequential API calls feel slow. Efficient implementations batch calls, cache data, and avoid redundant queries.

Code Components built with the Power Apps Component Framework (PCF) provide reusable custom controls that can be packaged and deployed independently. A data grid with sorting and filtering. A date picker with business calendar logic. A currency converter. Code components encapsulate complexity and can be versioned and reused across multiple portals. Power Pages supports a subset of PCF APIs (no device access, no multi-field components), but this covers most scenarios. The advantage over inline JavaScript is encapsulation and reusability; the cost is more formal development and packaging.

Combining Patterns in Production

Successful portals typically combine these extension points strategically. Liquid templates render personalized, read-only content server-side. JavaScript layered on top adds client-side interactivity like filtering, modal dialogs, and form submission without page reloads. Code components provide sophisticated interactive controls for scenarios too complex for inline JavaScript.

The principle is simple: use the least powerful extension point that solves the problem. Server-side logic stays in Liquid. Client-side behavior goes to JavaScript. Reusable controls become code components. This discipline keeps portals maintainable and reduces the surface area for bugs.

Common Implementation Mistakes

Teams building production portals frequently encounter predictable problems.

Overusing the portal Web API is the most common. Developers build portals that make dozens of sequential API calls to fetch related records, transform them, and populate sections of the page. The portal feels slow because it genuinely is slow: each API call adds 200-500ms of network latency. The solution is to rethink the architecture: can Liquid fetch the related records server-side? Can the JavaScript cache frequently needed data instead of querying it repeatedly? Can the form be restructured to avoid needing related data?

Neglecting row-level security testing is another common mistake. Developers build portals using a system administrator account and assume the portal Web API will return certain columns and records. In production, when row-level security rules are applied, the queries fail or return no data. Testing with non-administrator accounts during development prevents this category of surprise.

Security logic embedded in JavaScript is another pattern to avoid. A developer might write JavaScript that checks whether a button should be shown by verifying the user’s role. But if the role is determined by JavaScript on the client, an attacker can modify the browser’s DOM and show a button that should be hidden. Any security decision must be validated server-side, either through Liquid templates or through server-side plugins.

Moving Forward: When to Invest in Extension Architecture

The decision to extend Power Pages with code components, custom JavaScript, and Liquid templates should be made deliberately, not by accident. If the portal’s core requirements can be met with Power Pages’ declarative features, stay there. Configuration is faster to build, simpler to maintain, and survives platform updates with fewer breaking changes than custom code.

But if the portal needs personalized server-side content, client-side interactivity beyond basic form submission, or reusable custom controls, then understanding these extension points is essential. Teams that build with a clear architecture in mind, that understand which layer solves which problems, and that test thoroughly across use cases and user roles will build portals that feel native while leveraging the operational advantages of the Power Platform and Dataverse.

Organizations that struggle are often those that assume Power Pages is only for simple portals, then scramble to refactor when production requirements demand sophistication. By understanding the extension architecture from the start, teams can make intentional decisions about scope, complexity, and implementation approach rather than discovering these constraints partway through development.

Power Pages is capable of hosting sophisticated production portals. The key is recognizing what each extension point is designed to solve, and building with that clarity in mind.


About Routeget Technologies

Routeget Technologies helps enterprise organizations design, implement, and optimize Power Platform solutions including sophisticated Power Pages portals. Whether you’re planning a customer-facing portal, a partner collaboration site, or an internal employee experience, the difference between a successful portal and a frustrating one often comes down to architecture choices made early in the project. Our team works with organizations to understand their portal requirements, design an appropriate extension architecture, and guide implementation to ensure portals perform well, remain secure, and stay maintainable through their production lifecycle.

#PowerPagesCustomization #LiquidTemplates #CodeComponents #PortalDevelopment #PowerPlatform #EnterprisePortals #CustomJavaScript #WebAPIDevelopment #LowCodeExtension #PortalArchitecture

Unified Routing Queues in Dynamics 365 Customer Service: Why Your Default Queues Won’t Scale

The default queue system in Dynamics 365 Customer Service feels complete when you first set it up. Conversations route, assignments work, and during pilot your team absorbs the load. Then you go live with real volume, add a second channel like SMS alongside chat, and everything stalls. Conversations sit unassigned. Supervisors cannot override routing decisions. Your skilled chat specialists are handling SMS they’re not trained for. The root cause isn’t a bug. It’s that your queue infrastructure was built on a system designed for simplicity, not scale. The default queue form is intentionally constrained, and most organizations don’t discover this limitation until they need to rebuild everything under pressure mid-implementation.

Understanding unified routing queues means separating what feels simple from what actually works at scale, recognizing when the default approach has run its course, and planning queue architecture before implementation rather than after cutover. This distinction is what separates successful, efficient Omnichannel implementations from those that limp along with chronic escalations and burned-out agents.

The Default Queue Problem and the Read-Only Constraint

The system creates default queues for chat, email, and cases that appear fully functional in Omnichannel Administration. What’s rarely emphasized in documentation is that default queues are read-only except for one field: the assignment method. Queue priority, overflow behavior, fallback routing, and service level thresholds are locked down and cannot be changed. To modify any of these, you must rebuild the queue as an advanced queue from scratch.

This read-only constraint exists because the default queue form has dependencies throughout the Customer Service platform. If you customize the form or remove fields, basic queue creation fails for subsequent queue instances. Microsoft’s solution is not to fix this dependency but to tell you to use advanced queues and leave defaults alone. The problem is most implementation teams don’t discover this requirement until they’ve already configured SLAs and escalation logic against the default queues, assuming they could adjust settings later as business needs clarified. Switching to advanced queues mid-implementation means dismantling and rebuilding your entire routing configuration.

The solution is deliberate and discipline-based: never use default queues in production. Create advanced queues immediately, even if they initially look identical to the defaults. Advanced queues give you full control over priority, assignment method, overflow conditions, and fallback routing. The minute you need queue-level SLA enforcement or priority-based overflow, you will have already invested the time to set advanced queues up correctly. Retrofitting this mid-implementation is expensive, creates downtime, and typically requires extensive retesting.

Channel-Based Queue Types and Assignment Method Trade-Offs

Omnichannel separates queues by channel type rather than business function: messaging queues for chat and SMS, record queues for cases and email, voice queues for phone conversations. This channel-based separation exists because each channel has fundamentally different workload characteristics. A chat conversation expects response within seconds; an email case might accept response within hours. Mixing them into a single queue means your best agents either sit idle waiting for voice transfers or drown in backlogged emails they can’t possibly clear.

Within each channel, the assignment method determines who gets the next piece of work. Omnichannel offers four core options. Highest capacity sends work to whoever has the most available slots, keeping queue depth low but ignoring agent skill. An available chat specialist might be skipped in favor of an available email specialist if that email specialist has higher capacity. Advanced round-robin forces the system to consider skills, presence, and capacity simultaneously. An agent marked unavailable doesn’t receive work. An agent whose skills don’t match the conversation type doesn’t receive the assignment. An agent at capacity doesn’t get another conversation. This is operationally more complex, requiring reliable presence discipline and accurate skill definitions, but at scale this is what prevents specialized agents from being overwhelmed and generalists from handling conversations they can’t resolve. Least active assigns based on recent inactivity, fragile because inactivity doesn’t distinguish between an agent wrapping a difficult conversation and an agent sitting idle. Create new uses custom rulesets for priority, severity, or customer tier routing, requiring configuration overhead but delivering transparent business logic that agents and supervisors can understand.

Advanced round-robin is the right choice for mixed-channel operations. It requires reliable presence discipline and complete skill definitions. Custom rulesets work when you need predictable, documented routing rules that explain why an urgent case reached a senior agent while a routine chat went to a junior specialist.

Overflow, Fallback Queues, and Capacity Planning

Queue overflow moves conversations out when they hit a threshold (queue depth or wait time). Overflow typically routes to a fallback queue with its own assignment method, service-level target, and staffing model. The critical mistake is treating fallback as a rare edge case and understaffing it. If your primary queue strategy isn’t perfectly calibrated to real demand, overflow happens regularly and conversations languish in a poorly-resourced fallback queue, breaching SLAs chronically.

Second complexity: conversations already assigned to an owner do not move via overflow rules. If agent Sarah claimed work that later triggers overflow, that conversation stays with Sarah even if she’s over capacity. This is by design. The system doesn’t arbitrarily rip work away mid-conversation, but it means your overflow thresholds must account for actual cycle time. If average chat resolution is eight minutes but your overflow triggers at 15-conversation depth, you overflow multiple times per hour in busy periods before normal completion clears the queue. The threshold needs to reflect your actual call-handling time.

Common Configuration Mistakes and Permission Models

Beyond the default queue constraint, permission model misalignment is a major trap. Granting an agent permission to view a queue doesn’t automatically grant permission to view the conversations or cases assigned to that queue. Agents end up unable to see their own assigned work because the queue form is visible but related records are not. The fix is a plugin that propagates queue member permissions to related tables, not installed by default and often overlooked.

Presence discipline matters critically in round-robin assignment. If agents stay marked available while away from desk, round-robin logic becomes essentially random. Presence management must be a disciplined daily practice. Presence also interacts with geographic staffing: round-robin might send work to an agent about to log off. Your SLA clock started when work entered the queue, not when it reached an agent.

Planning Queue Architecture Upfront

Front-load queue design during requirements. Map your channels and identify which require specialized skills. Define assignment logic explicitly. Establish overflow and fallback strategy with clear staffing models. Plan for governance: who owns queue configuration changes, and how do you test before live deployment?

Integration with Workforce Engagement Management

The 2026 Wave 1 release brings integrated Workforce Engagement Management (WEM) with demand forecasting and capacity planning. WEM predicts queue volume across channels and flags imbalances. Queue design transitions from static configuration to continuous optimization. Advanced queues with explicit priority and overflow rules become the mechanism converting demand variation into staffing adjustments.

Conclusion

Unified routing queues are the foundation of omnichannel customer service at scale. The gap between theory and practice comes down to recognizing that default queue systems are minimal-viability, not production-ready. Advanced queues, clear assignment methods, explicit overflow logic, and disciplined presence management are prerequisites for routing that reaches the right agent, keeps SLAs intact, and avoids constant escalation. Planning this architecture before implementation prevents the scaling failures plaguing many Customer Service implementations.

Routeget Technologies helps organizations design Omnichannel routing architectures that scale with demand variation while keeping administrative overhead manageable, starting with your actual channel mix, staffing model, and SLA requirements.

#UnifiedRouting #OmnichanelRouting #DynamicsCustomerService #CustomerServiceArchitecture #QueueManagement #WorkforceOptimization #ServiceLevelAgreements #DynamicsImplementation #OmnichanelConfiguration

Building Autonomous Agents with Copilot Studio: Moving Beyond Chatbots

# Building Autonomous Agents with Copilot Studio: Moving Beyond Chatbots

Most organizations implementing Copilot Studio treat it as an intelligent chatbot that responds to user queries. That’s a missed opportunity. The platform’s real power lies in building autonomous agents that can make decisions, trigger downstream processes, and handle multi-step workflows without human intervention at each stage. Finance teams processing invoice exceptions, HR departments handling onboarding, and supply chain teams managing vendor communications all stand to benefit.

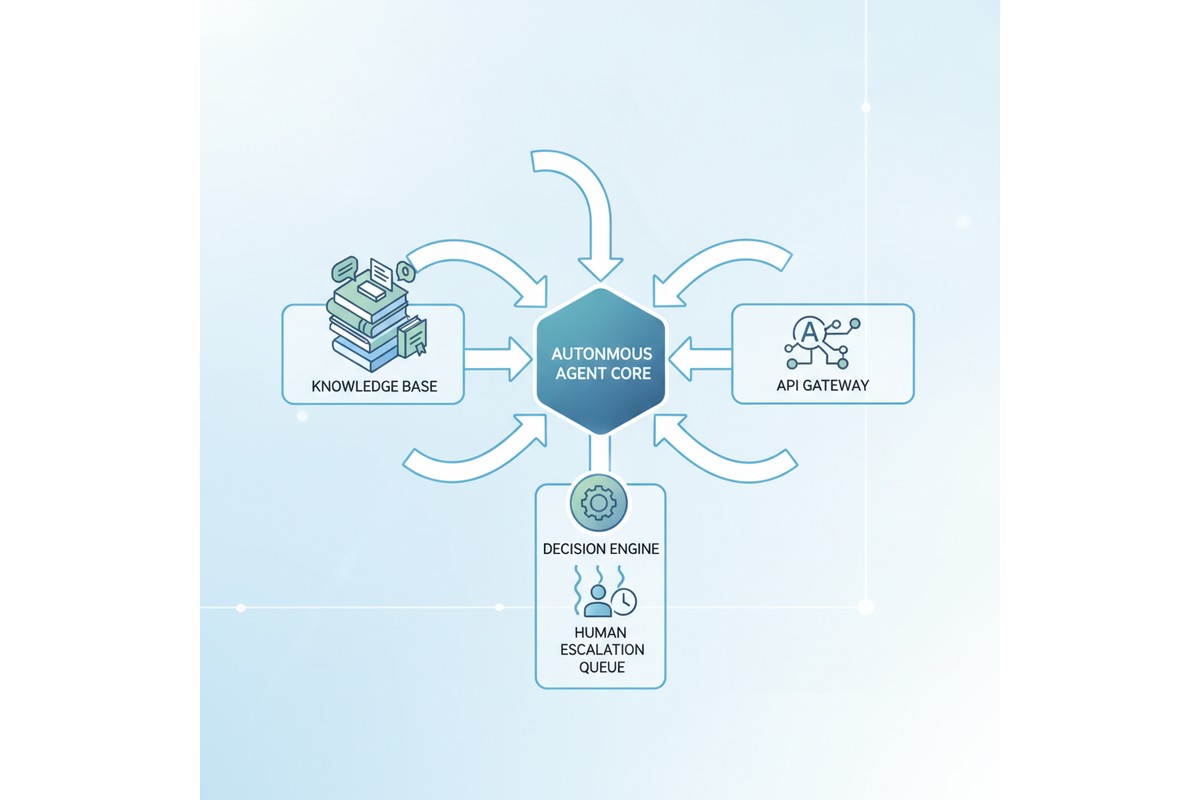
Copilot Studio autonomous agent system architecture

The gap between a chatbot and an autonomous agent comes down to three capabilities: the ability to invoke external systems without manual triggers, the capacity to make contextual decisions based on structured data, and the skill to maintain state across actions without restarting. Most Copilot Studio implementations lack these, which means their agents remain reactive and conversation-driven rather than autonomous and process-driven.

Building such an agent requires careful attention to custom actions, knowledge base integration, prompt engineering, and error handling. It’s not enough to wire up an API connection. You need to architect the agent so it knows when to act independently, how to handle failures gracefully, and when to escalate decisions to human reviewers.

Autonomous Agents vs. Interactive Chatbots

An interactive chatbot waits for user input at every step. The user submits a question, the chatbot responds, and the conversation ends until the next message arrives. Autonomous agents complete tasks without requiring user input at each decision point.

Consider a claims-processing agent. An interactive version might ask, “Does this claim qualify for expedited review?” and wait. An autonomous agent evaluates the claim against configured rules, makes the decision independently, updates the backend system, and notifies stakeholders automatically. The user’s role shifts from guiding each step to reviewing high-risk exceptions.

This design shift affects multiple aspects. First, the agent must understand when to act without prompts, requiring condition evaluation and decision trees beyond natural language understanding. Second, the agent must have authority to modify downstream data, introducing governance questions about which decisions need audit trails, human review, or policy-based automation.

Third, autonomous agents must recover from failure states gracefully. If an API call fails, an interactive chatbot tells the user it didn’t work. An autonomous agent must retry, escalate, or follow a fallback path based on business logic. Building robust error handling into the agent’s design from day one is essential.

Custom Actions and API Integration

Copilot Studio’s custom actions allow you to connect to external APIs and invoke them as part of the agent’s workflow. This is where many implementations falter. Teams configure basic actions without thinking through how the agent should behave when an API call fails, how long it should wait, or whether it should retry.

For a typical autonomous agent, you’ll define custom actions for the key external systems your agent needs to access. In a finance context, this might mean actions that query an ERP system to check if a purchase order exists, retrieve the purchasing history for a vendor, or post a transaction to the general ledger. In an HR context, you might define actions to look up employee records, check manager approval status, or send notifications through Teams or email.

Each action should include error handling at the definition level. Define which HTTP status codes are retryable (typically 502, 503, 504 and timeout errors), which represent permanent failures (400, 401, 403), and which might represent missing data (404). Configure exponential backoff for retries to avoid overwhelming the downstream API.

The other critical design choice is authentication. Copilot Studio supports connection references, which allow you to authenticate to external APIs securely. For a finance agent, you might use a service account that has specific permissions (read-only access to check PO status, but write access only to specific GL accounts). Never give your agent more permissions than it needs. If an agent is compromised, narrow permissions limit the damage.

Knowledge Base Integration

Most Copilot Studio agents include at least one knowledge base: a collection of documents or FAQs that the agent can reference when answering questions. For autonomous agents, knowledge bases serve a different purpose. Rather than storing answers to user questions, you use them to store decision logic, business rules, and process documentation that the agent uses to make autonomous decisions.

Consider a vendor onboarding agent. Instead of storing a knowledge base full of “How do I become a vendor?” FAQs, you store the actual business rules: vendors in certain geographic regions require additional tax documentation, vendors spending over a certain threshold need credit checks, and vendors in specific industries need compliance certifications. The agent retrieves these rules from the knowledge base, evaluates them against the vendor’s profile, and determines which documents need to be collected before onboarding can proceed.

This approach works because Copilot Studio’s retrieval-augmented generation (RAG) allows the agent to fetch relevant information from the knowledge base and incorporate it into its reasoning. The agent doesn’t just repeat back what’s in the knowledge base; it uses the information to make decisions.

For this to work reliably, your knowledge base content needs to be structured and current. Avoid storing conflicting information. If rule A says “credit checks are required for vendors over $100K” but another document says “credit checks are needed for vendors over $50K,” the agent’s behavior becomes unpredictable. Centralize your business rules in a single source of truth, and refresh the knowledge base whenever rules change.

Prompt Engineering for Autonomous Decision-Making

The system prompt enables autonomous action. A poorly written prompt produces an agent that refuses decisions or decides carelessly. A strong system prompt includes four elements: clear boundaries on what decisions it can make versus escalate, step-by-step decision logic (“Check vendor history using the vendor-lookup action. If they have 50 successful transactions in the past 12 months and average payment time under 30 days, they qualify for expedited payment”), guardrails for when to escalate (“If you cannot retrieve the vendor record after two retries, escalate with a detailed explanation”), and instructions for maintaining context (“Remember the vendor ID throughout. Do not make redundant lookup calls”). Specificity separates reliable agents from unreliable ones.

Error Handling and Escalation Workflows

Every autonomous agent will encounter situations where it can’t proceed. An API call fails. Required data is missing. A decision requires human judgment because it involves an exception to the normal rules. How the agent handles these situations determines whether it’s actually useful.

Design your escalation workflow first. Identify three or four common failure scenarios for your agent. For a claims processor, these might be: missing medical documentation, conflicting diagnoses from different providers, and claims that exceed specific dollar thresholds. For each scenario, define who reviews it, what information they need to see, and how they communicate their decision back to the agent (if it needs to resume).

In Copilot Studio, escalations typically flow through Power Automate. When your agent encounters a situation that requires human review, it creates a ticket or sends a notification through Teams, Power Automate, or a ticketing system. That ticket should include all the context the reviewer needs: the data the agent gathered, the decision it tried to make, and why it couldn’t proceed.

When the human reviewer makes a decision, it needs to flow back to the agent. This might happen through manual input in Teams, through an approval flow in Power Automate, or through a custom action that queries decisions from a database. The agent needs to know what the reviewer decided and continue processing if appropriate.

Test your error handling paths before going live. Don’t assume the happy path works and hope the error handling magically works when things go wrong. Deliberately trigger failures: kill an API connection, send bad data, create scenarios where required fields are missing. Observe how your agent behaves and refine the escalation logic.

Testing Autonomous Agents

Testing an autonomous agent is more complex than testing a chatbot because behavior depends on data state, API responses, and decision logic. Test at three levels: individual actions in isolation using Copilot Studio’s built-in testing, decision paths using test data with known outcomes, and escalation and error handling by simulating API failures and missing data. For each scenario, document expected behavior and verify the agent performs as designed.

Governance and Monitoring

Autonomous agents that make decisions without human review carry risk. Build governance into your design by logging every decision with the context that informed it. Set up monitoring dashboards that track autonomous decisions, escalations, errors, and human overrides. If humans override agent decisions more than 20 percent of the time, the agent’s logic needs refinement. Schedule periodic audits to verify correctness and identify patterns in mistakes, then update the system prompt or decision logic to correct them.

Conclusion

Building a true autonomous agent in Copilot Studio requires more up-front design work than building a chatbot, but the payoff is significant. Autonomous agents reduce manual work, ensure consistent decision-making, and allow organizations to scale processes without proportional increases in headcount. The key is treating autonomy as a design requirement from day one: architect your custom actions, knowledge base, prompts, and error handling specifically to support autonomous decisions, and build governance and monitoring to ensure those decisions stay accurate over time.

—

**About Routeget Technologies:** Routeget specializes in designing and implementing autonomous agents across the Microsoft cloud platform, helping organizations move beyond chatbots to truly autonomous processes. Our team brings hands-on experience building agents for finance operations, supply chain, HR, and customer service use cases, with a focus on robust error handling, governance, and measurable business outcomes.

#CopilotStudioAgents #AutonomousAgents #PowerPlatform #AIDecisionMaking #ProcessAutomation #Microsoft365AI #AgentDesign

#CopilotStudioAgents #AutonomousAgents #PowerPlatform #AIDecisionMaking #ProcessAutomation #Microsoft365AI #AgentDesign

Power Automate Desktop Flow Error Handling: Designing Reliable Unattended RPA for Finance Automation

Finance automation dashboard showing error logs and performance metrics

It is 8 a.m., and your finance team discovers the unattended desktop flow that processes overnight vendor invoices never completed. The bot logged into the ERP, opened the vendor invoice module, clicked through the first two forms, then stopped. No error message. No retry. By now, 500 invoices have piled up in the inbound folder, and the accounts payable clerk is manually logging them in. This scenario plays out in production environments every week, and the root cause is almost always the same: a UI element did not load in time, a dropdown rendered differently, or a network timeout caught the flow mid-interaction. The flow had no error handling, so it simply stopped, leaving no trace for anyone to diagnose.

This is the cost of unguarded desktop automation in finance operations. Unlike cloud-based flows with built-in retry mechanisms and structured error handling, Power Automate desktop flows operate at the edges of UI fragility. They click buttons, read text fields, and wait for controls to appear, making them dependent on stable selectors, predictable timing, and consistent system state. When any of those assumptions break, the entire unattended run fails silently, and your batch processing becomes a silent disaster.

Designing reliable desktop flows for finance means treating error handling not as an afterthought, but as a structural requirement. This guide walks through the strategies, patterns, and tools that let you build unattended RPA flows that tolerate real-world failures and keep your finance processes moving.

Where Errors Hide in Desktop Flows

Desktop flows fail at predictable boundaries. Understanding where to expect trouble is the first step toward preventing it.

UI interactions are the most fragile component of any desktop flow. A selector depends on stable element IDs, control names, or image references. But ERP forms change with updates, browsers render elements in different orders depending on load times, and dropdowns sometimes load asynchronously. A web automation expert will click a “Save” button that works perfectly in test, then fails in production because the button did not render before the click action fired.

File operations introduce another failure mode. Your flow reads vendor invoices from a network folder. But network connectivity drops for a second, a filename contains unexpected characters, or the file gets locked by another process. Without explicit error handling, the flow crashes and the batch stalls.

External system calls add latency and timeout risk. When your flow posts data to Dynamics 365 Finance and Operations or calls an API, network delays or rate-limiting can cause timeouts. The flow queues the request, waits 30 seconds, and gets no response. Without retry logic, it treats a temporary timeout as permanent failure.

Database operations can fail if the connection drops, the schema changes, or a unique constraint violation occurs. These are recoverable errors, but only if your flow is designed to catch them.

The critical insight is that none of these failures are truly catastrophic. A file-read error is recoverable (retry a few seconds later). A UI selector failure might be fixable with a fallback selector. A rate-limited API call should wait and retry, not fail the entire batch. But standard desktop flow design treats them all as terminal.

Structuring Error Detection and Recovery

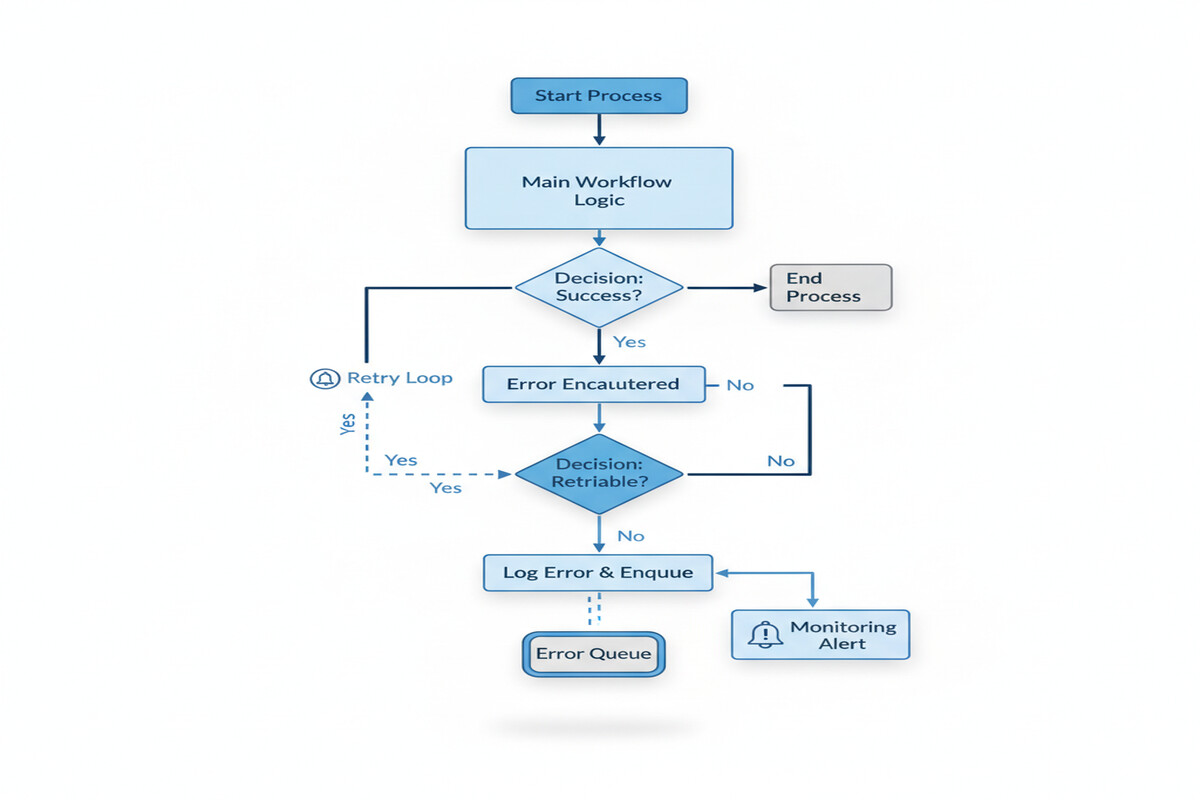
Error handling and retry logic flow diagram

The fix starts with deliberate error handling at every risky operation. In Power Automate desktop flows, this means wrapping key actions in error-handling blocks and designing recovery logic for each failure type.

For UI interactions, implement multiple selector strategies. Your primary selector targets a button by its automation ID, but include a fallback that searches by image or OCR text. If the first method fails, the flow tries the second before declaring defeat. Add explicit waits with timeouts before clicking, giving slow-loading forms time to render. Rather than hoping a dropdown appears in exactly 2 seconds, wait up to 10 seconds but proceed immediately if it appears sooner.

For file operations, check that files exist before attempting to read them. Wrap file reads in error handlers that catch “file not found” or “access denied” errors. Implement a retry loop that waits 3 seconds and tries again, up to three times. This handles transient network glitches without manual intervention. Log every file operation to your audit trail, including timestamps and error details.

For API calls, build explicit timeout and retry logic. When calling a Finance and Operations endpoint, set a reasonable timeout (10 to 15 seconds for most invoice operations), then add retry logic. If the call fails, wait a few seconds, then retry. This pattern, called exponential backoff (where wait time increases with each retry), handles temporary network issues and transient service problems. After three retries, log the failure and move to the next item, rather than halting the entire batch.

For validation errors (OCR confidence too low, GL account does not exist, vendor number invalid), treat these differently. These are not temporary failures; they reflect real data quality issues. Log the validation failure with details, add the item to a “review queue” in Dataverse, and continue processing. This partial-failure pattern is critical for batch operations: some items succeed, some need manual review, and the entire batch does not fail because of one bad invoice.

Building Visibility Through Monitoring

Error handling is only useful if you know when it is being triggered. Build monitoring into your flows from the start.

Every error should be logged to a structured destination. Create a Dataverse table called “Desktop Flow Error Log” with fields for flow name, timestamp, error type, error message, affected item (invoice number, vendor ID), and status (retry pending, review needed, failed). When your flow encounters an error, write a record to this table before proceeding.

Implement email and Teams alerts for critical failures. If a flow encounters more than three failures in a single run or fails to process more than 10 percent of items, send an alert to your finance operations team. Include the error log snippet so they can see which items need attention.

Create a Power BI dashboard showing flow performance metrics: items processed per run, success rate, average processing time per item, and top error types. Track these over weeks to identify patterns. Perhaps 95 percent of failures are “GL account not found,” indicating a data quality issue in your GL master. Perhaps 80 percent fail between 2 a.m. and 3 a.m., suggesting a scheduled database backup that blocks access.

Use Dataverse to maintain a “dead-letter queue” of failed items. When an error is unrecoverable after retries, the flow moves the item to this queue instead of simply stopping. Your finance team reviews the dead-letter queue each morning, triaging items for manual processing or corrective action.

A Practical Implementation

Consider a concrete scenario: your flow processes vendor invoices from a shared folder, extracts details via OCR, validates data against your GL, and posts to Dynamics 365 Finance and Operations.

The flow starts by listing files in the folder. Error handling: check that the folder exists and is accessible. If not, log a failure and exit gracefully.

For each file, the flow reads it (error handling: retry three times if locked or inaccessible). It applies OCR to extract vendor number, invoice amount, and GL account. If OCR confidence is below 85 percent, log the item as “low confidence” and queue it for review. This is not a retry scenario; it is a data quality gate.

The flow validates the vendor number against your vendor master via Finance and Operations API. Error handling: wrap in try/catch. If the call times out, retry with exponential backoff (wait 3 seconds, retry; wait 6 seconds, retry; wait 12 seconds, retry). If it still fails, log and queue for review. If the vendor is not found, the flow logs this specific error and moves the item to the review queue—retrying is pointless.

Finally, the flow posts the invoice to Finance and Operations. Wrap this in retry logic: try once, then retry twice with waits. If all three attempts fail, log the invoice with full details to the error table and dead-letter queue.

Throughout, track metrics: items processed, succeeded, reviewed, and failed. At the end of the run, log a summary and send an alert if the failure rate exceeds your threshold.

Designing for Partial Success

The mindset shift is subtle but profound. Design flows to succeed partially. Some invoices post immediately. Some fail validation and go to the review queue. Some hit transient API errors, retry, and eventually post. Some encounter unrecoverable errors and go to the dead-letter queue.

This requires that underlying systems support idempotency (running the same operation twice produces the same result, not duplicates). It requires careful state tracking so your flow knows which items have been processed. It requires monitoring that surfaces failures quickly.

Test error paths as deliberately as you test the happy path. Identify the three highest-risk operations in your flow. Add explicit error handling to each. Add logging. Set up alerts. Then scale from there. This is how you build desktop flows that run unattended, at scale, in production finance environments, turning silent failures into managed, observable exceptions.

Routeget Technologies brings deep experience in building production-scale RPA for finance automation, from designing error-resilient flows through monitoring strategy and alerting. If your organization is scaling unattended desktop automation and needs guidance on reliability and governance, we can help navigate the implementation challenges that most organizations discover too late.


#PowerAutomateErrorHandling #RPAFinance #DesktopFlowRetry #UnattendedAutomation #DynamicsFinanceAutomation #AutomationReliability #ProcessMining

Why Your Supply Chain Visibility Stops at Your Warehouse Door: Building End-to-End Traceability in Dynamics 365

Why Your Supply Chain Visibility Stops at Your Warehouse Door: Building End-to-End Traceability in Dynamics 365

It’s 2 a.m. on a Tuesday. Your manufacturing facility just identified a critical defect in raw materials that arrived from a supplier last week. By the time your quality team finished root-cause analysis, those defective materials were already processed into three separate production batches. Now you’re facing potential customer recalls, regulatory notification deadlines, and no clear way to trace which finished goods actually contain the defective material. Your supply chain software told you where the raw material was ordered and when it arrived. It told you absolutely nothing about where it went after that.

This scenario plays out in manufacturing and distribution operations every day. Supply chain visibility systems excel at tracking inbound inventory but break down once materials enter production or move through fulfillment. For many operations leaders, the supply chain becomes a black box the moment inventory leaves the warehouse.

The business cost of that blind spot is substantial. When quality issues surface, traceability delays mean either expensive and conservative recalls that pull good products from shelves, or risky decisions to ship products you cannot confidently verify as safe. For regulated industries, regulators expect faster, more precise responses than manual investigation can deliver. Beyond quality, lost visibility into material flow makes it nearly impossible to understand true landed costs, verify supplier performance claims, or negotiate accurately on future contracts.

Dynamics 365 Supply Chain Management addresses this visibility gap by connecting procurement, inventory, production, and fulfillment into a unified traceability architecture. The difference is not just better information. It is speed and precision when those information gaps cost you the most.

The Visibility Problem Runs Deeper Than Poor Reporting

Most supply chain systems treat traceability as an optional feature bolted onto inventory management. A truck arrives with materials. The system records receipt and location. Then it moves to the next transaction. There is no continuous thread connecting that receipt to the production order that consumed it, to the manufactured batch that contains it, to the shipment that sent it to customers.

This architectural gap exists because legacy systems were built for transaction volume, not data continuity. A system designed in 1997 needed to process thousands of purchase orders and shipments daily. It could not afford to maintain detailed linkages between every input and output. Instead, operations relied on physical batch logs, manual tracking spreadsheets, and the assumption that anyone who needed to trace materials would do so through paper records and institutional memory.

That model breaks when scale grows, when complexity increases, and when regulators start asking for proof instead of accepting your word.

The actual impact shows up in three ways. First, quality investigations take weeks instead of days because tracing backward from a customer complaint requires manual detective work across multiple systems and warehouses. Second, compliance teams spend months preparing for audits because they cannot quickly demonstrate that materials flowed exactly as regulations require. Third, cost analysis remains vague because you cannot match specific materials through production to specific finished goods and actual profit margins by customer or product line.

For operations leaders evaluating the business case for new systems, this is the tension: your current software works fine for running day-to-day operations, but it leaves you strategically blind when problems surface.

Dynamics 365 Solves This Through Persistent Tracking Dimensions

Dynamics 365 Supply Chain Management addresses traceability through a concept called inventory tracking dimensions. These are optional attributes you assign to materials when they arrive that the system carries forward through every downstream transaction.

In practice, this means when a raw material shipment arrives from a supplier, you can assign a lot number, a batch identifier, or a supplier batch code to that inventory. Every time that material moves, Dynamics 365 maintains that linkage. When it gets consumed in production, the system knows exactly which finished goods batch contains that material. When the finished goods shipment occurs, the system knows which supplier lot reached which customer.

This is simpler than it sounds in theory and more complex in execution. The traceability chain only works if data quality is maintained at every step. Warehouse receiving teams must accurately record lot numbers when materials arrive. Production schedulers must use the right lot allocation logic so materials move in the order and combinations you intend. Finished goods picking must respect lot traceability so batches do not inadvertently mix material from multiple suppliers.

Beyond receiving and production, Dynamics 365 extends visibility into logistics through Transportation Management integration. When finished goods ship, the system can attach the upstream supplier and production batch information to the shipment record. If your logistics partners accept real-time shipment data, you can even extend visibility beyond your own dock to show customers or regulators exactly when and how products moved from your facility.

Quality management workflows layer on top of this. When a quality hold is placed on a supplier lot, Dynamics 365 can automatically flag all downstream inventory and production batches that contain that material. Recalls, when they become necessary, can be precisely scoped to affected batches rather than conservative over-recalls of everything you cannot immediately rule out.

The Implementation Reality

Building this capability requires more than buying software. It requires operational discipline and often represents a genuine change in how warehouse and production teams work.

First, data quality becomes non-negotiable. If lot numbers are not recorded accurately at receiving, the entire chain breaks. Many organizations find this is the hard part, not the technology. Warehouse teams accustomed to checking boxes now need to record specific identifiers and understand why precision matters. For operations leaders, this means investment in training and ongoing quality checks, not just software implementation.

Second, integration with logistics partners becomes necessary if you want visibility to extend beyond your facility. Most transportation management systems now accept data feeds, but the integration requires coordination and often custom mapping to match your identifier schemes with your logistics partners’ systems.

Third, implementation timelines are usually longer than initial estimates because the visibility you gain surfaces data quality issues that existing systems were hiding. You may discover that your receiving team has been using approximate lot numbers or that production scheduling has been commingling materials from different lots without clear documentation.

For most mid-market to large manufacturers, the return on investment justifies that effort. Once you have consistent end-to-end traceability, quality investigations that previously took ten business days now take one. Compliance audits shift from defensive documentation gathering to straightforward system queries. Supplier negotiations become evidence-based rather than assumption-based when you can show precisely how their material performed through your production process.

What This Means for Your Supply Chain Strategy

The businesses that maintain the strongest competitive positions today are those that treat supply chain as a strategic asset, not a cost center. Part of that strategy is building the visibility to know what you own, where it is, and what happened to it at every stage.

Dynamics 365 Supply Chain Management makes that visibility achievable at reasonable scale. The foundation is simple: persistent tracking dimensions that follow materials from receipt through production and shipping. The execution requires discipline and investment in data quality and integration. The payoff is speed and precision when quality issues surface, confidence in regulatory readiness, and the data you need to make supplier performance and profitability decisions based on fact instead of intuition.

If your current supply chain software has a blind spot after inventory leaves the warehouse, that blindness has a cost. The question is whether you measure it.


#SupplyChainTraceability #Dynamics365SCM #InventoryTracking #SupplyChainVisibility #LotTracking #QualityManagement #SupplyChainCompliance #ManufacturingERP

Intercompany Accounting in Dynamics 365 Finance: Why Consolidated Ledger Elimination Entries Don’t Match Subledger Details

Your company’s intercompany transactions balance perfectly within each legal entity. General ledger accounts zero out to the cent when you print a subledger report. But when you run the consolidated ledger elimination process in Dynamics 365 Finance, the elimination entries don’t match the detail you’re looking at, the reports don’t tie back, and your financial close process stalls while the accounting team investigates discrepancies that shouldn’t exist.

This isn’t a rounding error or a posting issue. Intercompany accounting in Dynamics 365 Finance operates on assumptions about how intercompany transactions flow through the chart of accounts, how elimination entries get created, and how consolidated reporting aggregates data across legal entities. When those assumptions don’t align with your actual business structure, transactions don’t eliminate cleanly, reconciliation becomes manual, and the close process loses the automation benefit that makes consolidation work.

How Intercompany Accounting Is Supposed to Work

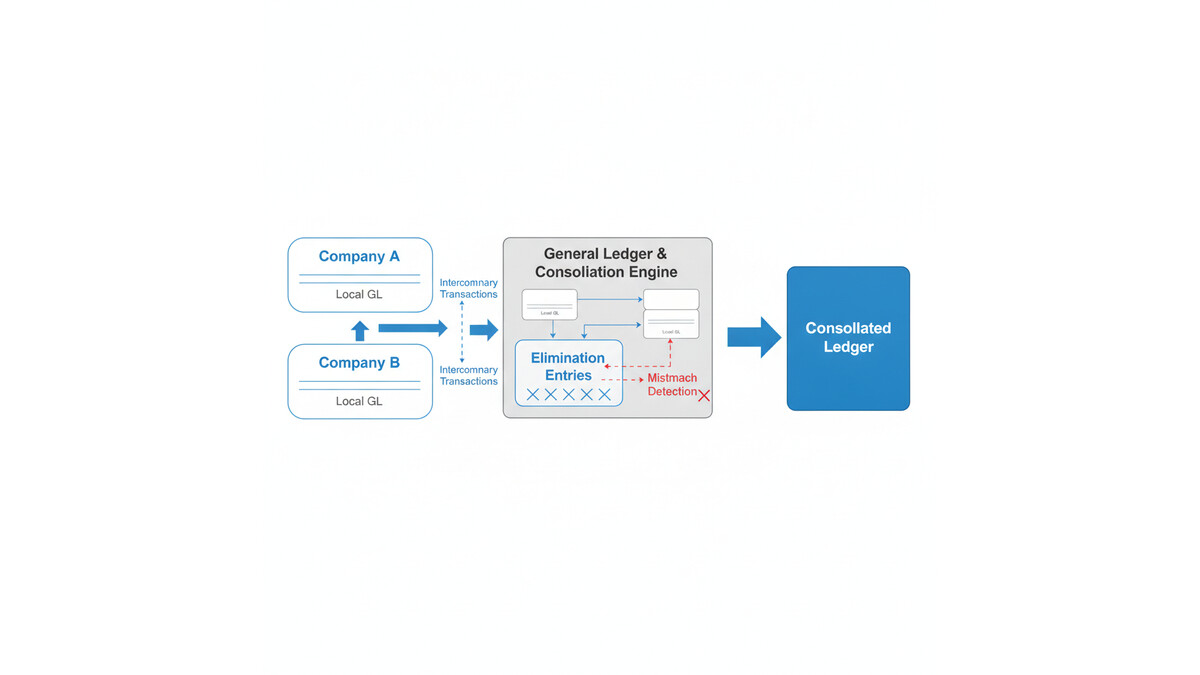
Dynamics 365 Finance treats intercompany transactions as a special case within the general ledger. When one legal entity (the originating company) records a transaction with another legal entity (the counterparty), both sides record the transaction independently. The originating company records the full transaction amount and an intercompany payable or receivable. The counterparty records the mirror transaction and an intercompany receivable or payable. These two sides are supposed to eliminate when you consolidate.

The elimination process is straightforward conceptually: find all intercompany balances, create offsetting entries to zero them out at the consolidation level, and produce a consolidated financial statement that shows only external transactions. In practice, Finance requires you to identify which accounts are intercompany balances, set up elimination rules, and ensure that the consolidation process knows how to match and eliminate transactions.

Where things diverge from this ideal is in the details of how intercompany transactions actually map to accounts. Finance assumes intercompany receivables and payables flow through specific account structures. If your chart of accounts doesn’t follow that structure, or if your intercompany transactions post to unexpected account combinations, the elimination logic can’t find matching pairs to eliminate.

Consolidated financial reporting process showing intercompany transaction flows and elimination logic

Why Elimination Entries Don’t Match Your Subledger

The root cause usually sits in one of three places: account mapping, transaction routing, or elimination rule configuration.

Account mapping issues: Intercompany receivables and payables need to map to specific accounts that the elimination process recognizes. If your chart of accounts assigns different accounts for intercompany activity than the elimination rules expect, transactions won’t match. For example, if you have intercompany sales recorded against one receivable account but intercompany service fees recorded against another, and your elimination rules only target the first account, service fee intercompany balances persist in the consolidated ledger.

Dimensional mismatch: Dimensions are where intercompany accounting often breaks down in practice. If your originating company records an intercompany transaction tagged with a specific cost center or business unit dimension, but the counterparty company records the mirror transaction without that same dimension combination, the two entries won’t find each other during elimination. The consolidation engine can’t match and eliminate transactions that have different dimension combinations, even if the account numbers and amounts are identical.

Timing and period mismatch: Intercompany transactions posted in one period in the originating company may not be received and matched in the counterparty company until the next period. If you try to run elimination at period-end before the counterparty company has received and recorded the transaction, the elimination process will create a temporary imbalance. This is especially common in month-end closes when one entity’s period ends before another’s, or when intercompany invoices are issued late in the month.

Control account vs. detail account confusion: Many implementations assign intercompany transactions to control accounts in the general ledger but then try to reconcile using subledger detail accounts. Finance’s elimination engine works at the general ledger level, not the subledger level. If the control account total is correct but the subledger detail account distribution doesn’t match what elimination expects, you’ll see reconciliation mismatches.

How to Diagnose the Problem

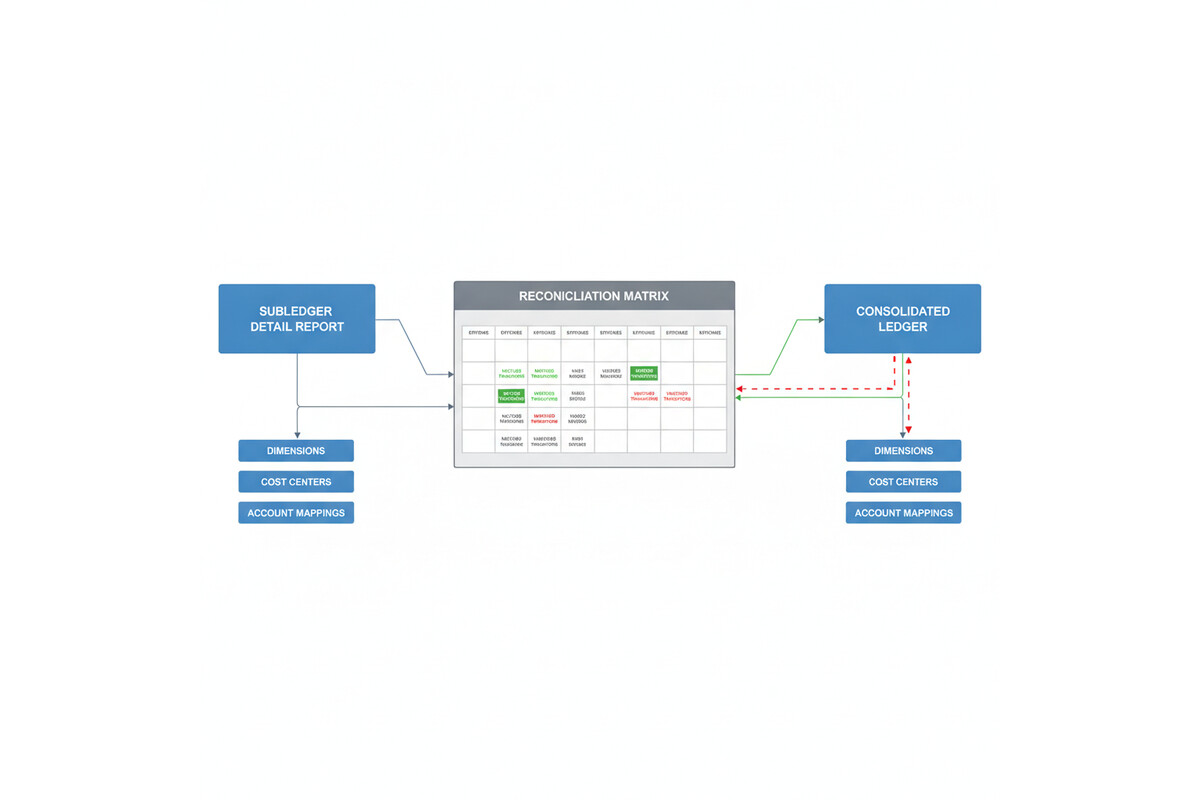
Start with a simple reconciliation: for each intercompany payable and receivable account, calculate the balance in the originating company’s general ledger, then calculate the mirror balance in the counterparty company’s general ledger. These two numbers should be equal and opposite. If they’re not, the problem is upstream of the elimination process.

If the balances match, the issue is in how the consolidation process is configured. Navigate to the consolidation elimination rules in Finance and verify that the account mappings and dimension rules are set up to match your actual posting. The elimination rules should specify which accounts contain intercompany balances, how they map between legal entities, and which dimension combinations are included in the elimination logic.

A common troubleshooting technique is to export the elimination entries that Finance generated, then manually reconcile them back to the intercompany transactions in your subledger. If the elimination entries don’t match specific subledger transactions, you’ve found the problem: either a transaction posted to an account the elimination rules don’t cover, or a dimension combination that doesn’t align between the two companies.

Intercompany reconciliation matrix showing matched and unmatched transaction entries

Designing Intercompany Accounting That Actually Eliminates

The cleanest approach is to standardize how intercompany transactions post across all legal entities. Define a consistent chart of accounts for intercompany receivables and payables, with the same account numbers used in every legal entity. If you use dimensions to tag transactions, establish a rule that intercompany transactions must be tagged with identical dimension combinations in both the originating and counterparty companies.

Consider whether you truly need dimensional detail on intercompany balances. Many implementations create dimensional complexity that adds no value to the intercompany reconciliation. If cost center assignment doesn’t affect how you manage intercompany payables, don’t require a cost center dimension on those transactions. Simpler account structures mean cleaner eliminations.

Set up a pre-consolidation reconciliation process in Finance. Before running elimination, generate a report of all intercompany balances, grouped by company pair, account, and dimension. Reconcile this to your subledger detail. If discrepancies appear, resolve them before you run the consolidation. This prevents the elimination engine from encountering unmatched transactions.

If you’re running multiple consolidation entities with nested parent-subsidiary relationships, test your elimination logic at each level. A common failure mode is that consolidation works correctly at the first level (subsidiary to intermediate parent) but breaks at the second level (intermediate parent to ultimate parent) because dimension combinations or account assignments drift as you go up the hierarchy.

When to Use External vs. Internal Elimination

Finance supports two elimination approaches: internal elimination (within Finance, using the consolidation module) and external elimination (in a separate consolidation tool or process). Internal elimination is simpler if your intercompany transactions follow a clean, standardized structure. External elimination is more flexible if your transactions are complex or your intercompany relationships don’t fit Finance’s default assumptions.

If you’ve been troubleshooting intercompany eliminations for months and the mismatches persist, it may be worth evaluating whether an external consolidation engine better serves your structure. Some organizations find that moving complex intercompany and consolidation logic to a dedicated consolidation tool reduces the burden on the Finance general ledger and makes the close process more transparent.

Preparation for Implementation

If you’re building an intercompany accounting structure from scratch, start by documenting your actual intercompany flow: which companies transact with each other, what types of transactions (sales, services, loans, expense allocations), and whether dimensional detail is needed on each type. Then design your chart of accounts and elimination rules to match that flow exactly.

Before you go live, run a full consolidation cycle with representative historical data. Create test transactions that cover every intercompany transaction type, post them in both the originating and counterparty companies, and run elimination. Verify that the elimination entries match the transactions you created, and that the consolidated ledger balances correctly. If you find mismatches at this point, you’re catching them before real transactions are in the system.

Assign one person ownership of the intercompany reconciliation and elimination process. That person should understand how the system is configured, have access to the elimination rules and the subledger detail, and be responsible for ensuring the process runs correctly every month. Intercompany accounting has a way of drifting if no one is explicitly in charge of keeping it clean.

Intercompany accounting is one of the places where small configuration oversights create large reconciliation problems. Taking time upfront to design and test your structure eliminates months of frustration during the close process.


Routeget Technologies: Our Finance & Operations consulting team helps enterprises design and implement intercompany accounting structures that consolidate cleanly and close on time, whether you’re building from scratch or fixing an existing implementation that’s struggling with elimination reconciliation.

#IntercompanyAccounting #Dynamics365Finance #FinanceImplementation #ConsolidatedReporting #ERPGovernance #AccountingAutomation #FinanceOperations #Dynamics365Implementation

Dataverse Calculated Columns and Rollups: When Summary Data Becomes a Bottleneck

Most Dynamics 365 implementations contain at least one field that should not exist. It is usually a number that sums values from child records, or a formula that derives from related data. The reason it exists is always the same: someone wanted real-time access to that information from a parent record, without running a report or opening a separate list.

Dataverse calculated columns and rollup columns promise to solve this problem. Calculated columns apply a formula to one or more fields on the current record, showing the result live without code. Rollup columns sum, count, average, or find min/max values from related records, showing that aggregation on the parent record. Both sound straightforward in a demo. Both become serious performance liabilities in production when misapplied.

The problem is not that calculated columns or rollups are poorly designed. The problem is that their flexibility and ease of configuration make it tempting to create them for every question a user asks, and because Dataverse computes these columns synchronously during record operations, each one you add delays every operation touching that record or its related data. At scale, calculated columns and rollups can turn a fast, responsive system into one where simple form loads lag and mass operations hang.

Performance metrics dashboard for database optimization

How Dataverse Calculated Columns and Rollups Actually Work

Calculated columns in Dataverse run when a record is created, updated, or retrieved. Unlike plugin code you can optimize or disable, calculated columns execute on every interaction. If you define a calculated column that divides a budget by a count of child records, that division happens every time anyone loads the form, every time a Power Automate flow retrieves that record, and every time an integration fetches the data via the API.

Rollup columns add another layer of complexity. A rollup does not just read data from related records; it must traverse a relationship, evaluate a condition on each related record, and then compute the aggregation. If you create a rollup that counts all incomplete tasks related to an account, Dataverse must walk through every task record linked to that account, check each one’s status, and return the count. On an account with 50,000 tasks, this query can take seconds.

Both calculated columns and rollups are recomputed on a schedule. Dataverse does not compute them in real-time on demand; instead, the system recalculates them asynchronously in batch jobs. This means that displayed values may not always reflect the absolute latest state of the source data. For a dashboard or a report, this lag is usually acceptable. For a workflow that needs to make a decision based on that value, the delay can cause logic to fail or bypass critical checks.

When Calculated Columns and Rollups Become Problems

Performance issues with calculated columns and rollups typically emerge at one of three trigger points.

First is load time. A form containing multiple calculated columns or rollups can take noticeably longer to render, especially on mobile or slower connections. Users perceive this as a slow or unresponsive system. The impact scales with the number of columns; a form with 2 or 3 calculated fields performs fine, but one with 10 or more can lag visibly.

Second is mass operations. Bulk operations such as Power Automate loops that create or update thousands of records will execute more slowly if those records contain calculated columns or rollups. Each record operation pays the calculation cost, so a loop that would normally complete in 30 seconds might take 3 minutes. Workflows that timeout during scheduled jobs often have calculated columns as a hidden root cause.

Third is query performance. Reports or Power BI dashboards that query many records will hit slowdowns if the records contain expensive calculated columns or rollups. The calculation must complete before the record is returned, so querying 10,000 records with heavyweight calculations forces Dataverse to compute all 10,000 calculations before the query finishes.

A fourth, more subtle issue is the logical inconsistency created by asynchronous recalculation. If a workflow reads a rollup column value, performs business logic based on that value, and then the rollup recalculates a moment later and changes, the workflow has acted on stale data. This can create gaps in audit trails or cause business logic to diverge from the actual state the user sees.

Detecting Bottlenecks

Before optimizing, you need to know if calculated columns or rollups are actually the problem. A few diagnostic approaches work.

Check the Dataverse environment’s performance reports. Look for slow-running queries or forms that take longer than expected. If a form with calculated columns loads in three seconds and the same form without them loads in one second, the columns are adding two seconds of latency. Similarly, check Power Automate run histories for timeouts or slow execution in flows that work with records containing rollups.

Enable Plugin Trace Log (under Settings in your Dynamics environment) and examine traces for records being retrieved with calculated columns. Look at the duration of retrieve operations; if simple record retrievals are taking longer than 500 milliseconds, calculated or rollup columns are a likely culprit.

Query the Dataverse API directly with and without calculated columns in the result set. Use select parameters to request only the columns you need. If adding a calculated column to the query selection significantly increases response time, you have confirmed the issue.

Database schema showing parent-child record relationships and calculation flows

Alternatives to Calculated Columns and Rollups

If you have identified a bottleneck, you have several options. The best choice depends on your specific scenario.

Use plugins or Power Automate to calculate on demand. Instead of computing the value every time a record is retrieved, calculate and store it only when necessary. A plugin triggered on form load can calculate a summary and display it in a banner, showing fresh data without impacting record retrieval. A Power Automate cloud flow can run on a schedule to update rollup values once per hour or once per day, depending on your tolerance for staleness. This approach keeps the permanent record lean.

Move calculations to the reporting layer. Power BI does not care if a column is calculated in Dataverse or computed in the dataset; the result looks the same to an end user. Create a calculated column in a Power BI dataset instead of in Dataverse, and use that column only for dashboards and reports. Forms and integrations get the base data without calculation overhead.

Use views and roll-up jobs sparingly. If you do use rollups, create them for only the most critical summaries. A single rollup that counts open orders on an account is reasonable; four rollups that count open orders, sum order amounts, calculate average order value, and find the date of the latest order should be four separate on-demand calculations in Power Automate or a custom plugin.

Denormalize selectively. For high-cardinality relationships (an account with tens of thousands of related records), consider storing pre-calculated values in a separate summary table updated by a scheduled batch process, rather than relying on Dataverse to calculate them live. This trades a small amount of design complexity for significant performance gains.

Production-Ready Patterns

In practice, high-performing Dataverse implementations keep calculated and rollup columns minimal. A good rule of thumb: if a column is not displayed on a form or used in a critical workflow decision, it should not exist as a calculated or rollup column.

When you do create them, profile the specific form or report where they appear. Measure load time before and after; if latency increases by more than 200 milliseconds per column, investigate alternatives. For rollups, test with realistic data volumes; a rollup that works fine with 100 related records may not work at all with 10,000.

Document which forms, reports, and integrations depend on each calculated or rollup column. This becomes essential when troubleshooting slow operations; knowing that a dashboard uses a particular rollup helps you understand why it is not refreshing quickly.

Finally, review calculated and rollup columns every few months. As your implementation matures and data volumes grow, columns that performed acceptably in early stages may become bottlenecks. Removing a column that no longer serves a critical business purpose often has an immediate, measurable impact on overall system responsiveness.

Calculated columns and rollups are powerful tools when used deliberately. They become performance anchors when used casually. The teams that manage Dataverse best treat them not as convenience features, but as performance decisions that must be justified by real business need and validated through testing at production scale.


#DataversePerformance #CalculatedColumns #RollupOptimization #DataverseTuning #Dynamics365Performance #CloudArchitecture #DataverseArchitecture #SystemPerformance

Distributed Order Management Date Logic in Dynamics 365: Why Your Order Promise Dates Don’t Match Fulfillment Reality

Distributed Order Management dashboard showing fulfillment network optimization

A CFO at a mid-market distributor implemented Distributed Order Management in Dynamics 365 Supply Chain Management expecting it to automatically optimize which warehouse fulfilled each order. Six weeks after go-live, order promise dates started slipping consistently beyond what the fulfillment network could actually deliver. The system promised customers Friday delivery, but warehouse capacity and transit times said Tuesday was realistic. The DOM configuration looked correct on paper, but something in the date calculation logic wasn’t aligning with how the fulfillment network actually worked.

This scenario repeats across Dynamics 365 implementations. Distributed Order Management is powerful, but the interaction between order promise date logic, inventory allocation, and fulfillment location rules creates a complexity that most teams underestimate. The system doesn’t fail loudly; it simply generates commitments that the supply chain can’t keep.

How DOM Calculates Order Promise Dates

Distributed Order Management dashboard showing fulfillment network optimization

Distributed Order Management in Dynamics 365 uses a specific sequence when evaluating whether an order can be fulfilled. First, DOM checks inventory availability across fulfillment locations based on allocation rules you configure. Then it calculates a delivery date by adding transit time from the selected warehouse to the delivery address. Finally, it compares that calculated date against your order promise date policy. If the fulfillment location can deliver within the promised window, the order is allocated there. If not, DOM tries the next location in the rule priority sequence.

The order promise date itself is typically set during order entry, usually based on a default lead time from your Sales module or a customer-specific agreement. That date becomes a hard constraint in DOM’s allocation logic. If no warehouse can deliver by that date, DOM marks the order as unallocated, and a manual intervention becomes necessary.

The problem emerges when your order promise date policy doesn’t account for the actual distribution network topology. Many teams set promise dates based on what customer expectations are, not what the fulfillment network can physically deliver. You might promise Friday delivery in all cases, but your nearest warehouse to a particular delivery address is two days away by standard transit. DOM will correctly refuse that allocation, but the order is already in the system with a date you can’t keep.

Common Date Logic Failures

Transit time configuration is the first place this breaks. Dynamics 365 allows you to define transit times between fulfillment locations and delivery addresses using distance-based or location-based rules. If your transit time matrix is incomplete or uses broad assumptions (for example, assuming all addresses in a state can be reached in one day), DOM will calculate delivery dates that don’t match reality. A customer in a remote area might be assigned a warehouse that’s technically capable of shipping, but the transit time estimate is wildly optimistic.

Inventory allocation sequencing compounds the issue. DOM prioritizes fulfillment locations based on rules you define, often weighted toward nearest warehouse or lowest cost. If your highest-priority warehouse has zero inventory but a high promised delivery date policy, DOM may skip it and try a lower-priority location further away. That second location might have inventory, but if its transit time exceeds your order promise date, the order goes unallocated. Your first-choice warehouse would have delivered on time, but it was out of stock.

Lead time inclusion creates another layer of complexity. Some organizations include a buffer in their order promise dates to account for order processing and picking time at the warehouse. Dynamics 365 allows this through the delivery date offset configuration in DOM rules. If that offset is set incorrectly (too small or too large), the system either promises dates that include warehouse processing time that doesn’t exist, or it excludes processing time that’s actually required, causing fulfillment failures when the order reaches the warehouse and needs to be queued.

Customer-level promise date overrides can also break assumptions. You might configure DOM with a global 5-day promise window, but a contract with a specific customer guarantees 3-day delivery. If that override isn’t captured in your fulfillment location rules or priority weighting, DOM will allocate to a warehouse that can deliver in 4 days, violating the contract.

Diagnosing What’s Actually Happening

Modern warehouse fulfillment center with inventory management operations

The DOM allocation trace in Dynamics 365 is your primary diagnostic tool. When an order fails to allocate, you can review the detailed trace that shows which fulfillment locations were evaluated, in what order, and why each was rejected or selected. This trace will show you if DOM was considering a warehouse that’s 800 miles away when one 50 miles away was available, or if it rejected a capable warehouse because of a date mismatch.

Run a date audit on recent orders. Compare the promised delivery date in the order against the calculated fulfillment date from the allocating warehouse. If most discrepancies are 1-2 days, your promise date policy is probably out of sync with network capability. If discrepancies are random and larger, your transit time matrix or delivery date offset configuration needs review.

Test your fulfillment location rules under load. DOM’s behavior changes when multiple orders are competing for the same inventory. Create test orders representing different geographic regions and order volumes, then check whether DOM’s allocation recommendations make sense. A warehouse that looks ideal in isolation may become bottlenecked when handling actual volumes, and DOM doesn’t account for capacity constraints in its date calculations, only inventory availability.

Fixing the Fundamental Mismatch

Start by establishing what your supply chain can actually deliver. Map your fulfillment locations, typical inventory levels, and genuine transit times (not best-case, but realistic). Document customer-specific commitments and contract terms separately from default policies. This foundation is non-negotiable.

Configure DOM’s promise date policy to match this reality. If your farthest delivery address is 4 days by ground from your nearest warehouse, your default promise date can’t be 2 days. If you want to offer 2-day delivery, you need inventory positioned closer to that customer or expedited shipping available. The promise date is a hard constraint in DOM’s logic, and you can’t configure your way around physics.

Use delivery date offsets intentionally. Set offset values to match actual warehouse processing and handling time, not to pad margins or squeeze perceived cost. A 1-day offset means that when DOM calculates a delivery date, it subtracts 1 day from the available time window to account for warehouse operations. If your actual processing time is 1 day, use 1 day. If you set 2 days to add safety margin, you’ll miss valid allocation opportunities and generate unallocated orders.

Test with real order patterns before relying on DOM for critical orders. Run a pilot allocation cycle using your actual customer set and geographic distribution. Let DOM run without overriding individual allocations, then measure how many orders allocate successfully and how many miss their promise dates. That result tells you whether your configuration is grounded in supply chain reality or wishful thinking.

Implementation Considerations

DOM becomes more valuable when it’s working with accurate constraints, not fighting against them. The system will allocate orders optimally, but only within the bounds you set. If those bounds don’t match physical reality, you’re asking DOM to solve an impossible problem, and the system will fail in ways that look like bugs but are actually configuration problems.

Many teams discover this only after going live and watching order dates slip. By then, you’re rewriting promise date policies, adjusting transit times, and managing customer expectations, all while DOM continues to make allocation decisions based on outdated assumptions. The cost of getting this wrong extends beyond supply chain operations into customer service and revenue recognition, where promise dates become contractual commitments.

The solution isn’t complex, but it is foundational. Your Dynamics 365 implementation needs to start with an honest assessment of what your fulfillment network can deliver, then configure DOM to work within those constraints. When you do, the system’s optimization capabilities become genuinely valuable. When you don’t, you’re managing conflict between a system trying to allocate optimally and a supply chain that can’t deliver on what it’s promising.


#DynamicsSupplyChain #DistributedOrderManagement #DOM #SupplyChainOptimization #D365SCM #FulfillmentLogistics #InventoryAllocation #OrderManagement #SupplyChainTechnology

Business Central Virtual Tables Eliminate the ETL Job Between BC and Dataverse. They Also Eliminate Half Your Filter Options.

Solution architect reviewing a real-time data integration visualization between enterprise systems

A solution architect scoping a Dynamics 365 Sales rollout for a distribution client recently asked a straightforward question: does the sales team need to see live Business Central order and inventory data inside their CRM records, or is a nightly sync job good enough? The honest answer took longer than it should have, because Business Central virtual tables, the feature Microsoft built specifically to answer this question, solve it only for a narrower set of scenarios than the AppSource listing and most walkthroughs suggest. The core mechanism works exactly as advertised. Where it falls short is rarely covered in the getting-started guides, and that gap is exactly where a scoping conversation needs to happen before anyone commits to an architecture.

Virtual tables have been positioned, correctly in most cases, as the end of a certain kind of integration project: the one where someone builds a scheduled job to copy Business Central records into Dataverse so Power Apps and Dynamics 365 Sales can read them. That job needs error handling, a schema that drifts every time BC gets a service update, and someone on call when the sync silently stops. Virtual tables remove that job entirely for read-heavy scenarios, just not for every scenario, and the difference is worth planning around before it’s discovered mid-build.

How Business Central Virtual Tables Actually Work

The Business Central Virtual Table plugin, published on AppSource, gives Dataverse a way to read and write Business Central records without copying that data into Dataverse storage. Under the hood, it consumes the Business Central API (v2.0), turns each endpoint’s response properties into virtual table columns, and maps the API’s own relationships into table relations that Power Apps and Power Automate can traverse like any native table. None of that translation happens on a schedule. Every query against a Business Central virtual table becomes a live OData call back to the Business Central tenant the moment a user opens a form, loads a subgrid, or a flow condition evaluates.

That real-time behavior is the actual selling point, and it’s a legitimate one. A Dynamics 365 Sales rep looking at an account record sees the customer’s current balance and open orders as they exist in Business Central right now, not as of last night’s sync window. There’s no data duplication to reconcile, no field mapping table to maintain as BC’s schema evolves, and no separate storage cost in Dataverse for records that already live somewhere else.

What Setup Actually Involves

Getting virtual tables running is a Power Platform admin task more than a developer task, which is worth knowing before anyone estimates the work. The solution installs from AppSource into a target Power Platform environment. Inside Business Central, an administrator enables the corresponding Microsoft Entra application, listed on BC’s own Entra applications page as the option for virtual tables. In Dataverse, the Business Central Virtual Data Source Configuration table needs the target BC environment name and a default company, since every request has to resolve to a specific company context.

Microsoft ships this as a set of managed solutions rather than one package: a company reference table every request depends on, the core plugin support, a catalog of tables available from the connected BC environment, and the generated virtual table definitions themselves. Because that catalog reflects the full breadth of Business Central’s OData surface, tables aren’t visible in Power Apps by default. An admin has to open the Business Central Configuration app and mark each table an app will use, a sensible governance control once you know it’s coming, and a confusing missing-table problem the first time you don’t.

Developer workstation displaying live data flow dashboards representing database integration

The Tenant Requirement That Ends Some Projects Before They Start

The detail worth checking on the first scoping call, not discovering three weeks into a build, is that the Business Central environment and the Dataverse environment must sit in the same Microsoft Entra tenant. For an organization that has run its Dynamics footprint under one tenant from the start, this is a non-issue. It becomes a real blocker for companies that grew through acquisition and still operate a separate Business Central tenant for a subsidiary, and it comes up constantly on engagements where a client’s CRM and ERP environments were provisioned years apart, sometimes by different vendors, under different tenants.

When that’s the situation, virtual tables aren’t an option regardless of how well everything else fits, and the project falls back to a conventional integration built on Power Automate flows against the Business Central API, or a dedicated integration platform between the two systems. Confirming tenant alignment costs a few minutes of checking admin center settings. Discovering the mismatch after a Power Apps screen is already designed around virtual tables costs a redesign.

Where the Filtering Restrictions Actually Bite

Because every virtual table query is a live OData call, the filtering grammar available to a Dataverse view or an advanced find is exactly as expressive as OData’s filter syntax, and no more. Predicates like does not equal, does not contain, does not begin with, and does not end with aren’t available. A view can’t combine AND and OR groups across different columns the way a native Dataverse table allows, and filtering on related tables or calculated fields isn’t supported either, nor are charts, attachments, images, or any BLOB-backed multiline text field built on a virtual table.

None of that shows up in a basic demo, which is the actual problem. A subgrid or gallery built against a virtual table for a first pass usually works, because the first pass rarely tests anything more demanding than “show me the open orders.” The gap surfaces once a real user asks for something like “show open sales orders where the requested ship date isn’t blank and the customer isn’t on credit hold,” a query needing a does-not-equal check on one column joined with an AND against a second. A native Dataverse table handles that without anyone thinking twice. A virtual table view can’t express it, and the fix ends up being either a purpose-built custom API on the Business Central side shaped for that exact query, or pushing the filtering logic into a Power Automate flow or a canvas app formula instead of the view. Either workaround is manageable, but only if someone anticipated it, and the tutorials rarely mention it exists.

Synthetic Relationships Connect the Models, But Only One Way

Virtual tables can also link to native Dataverse tables through what Microsoft calls synthetic relationships, letting a record like a Dataverse Account display related Business Central sales orders in a subgrid without custom plugin code. Building one means creating a foreign key on the native table first, then defining the relationship in the Business Central Configuration app’s Table Relations screen, mapping the native table’s key columns to the matching virtual table columns.

The relationship, once created, isn’t editable. Changing which columns participate means deleting it and rebuilding from scratch, and refreshing the underlying virtual table’s metadata while a relationship depends on it tends to throw errors rather than update quietly. The practical implication is to stabilize the Business Central side of the schema first: it’s far cheaper to adjust a Dataverse foreign key than to reconstruct several relationship mappings after a field gets renamed on the BC side. It’s also worth knowing upfront that relationships between two virtual tables aren’t supported at all, only between a native table and a virtual table, so an architecture chaining two Business Central entities purely through Dataverse relationships needs a custom API instead.

When Virtual Tables Are the Right Call

Virtual tables fit read-heavy scenarios well: a Power App or Dynamics 365 Sales form that needs current item availability, order status, or account balance without anyone owning a sync pipeline, where the filtering the business needs stays inside basic equality and straightforward AND logic. They’re a poor fit for anything involving attachments or images tied to BC records, analytics that need to chart or aggregate BC data directly, filter logic needing negation or mixed AND/OR groups, and any architecture spanning two Entra tenants.

The habit worth building into every Business Central to Dataverse integration scope is prototyping the specific filter and subgrid scenarios the business will actually use, not a generic list view, before the architecture is locked in. Almost every gap covered here only shows up once a real filter requirement meets OData’s grammar, and that’s cheap to test in the first week and expensive to discover after Power Apps screens are already built around the wrong assumption. Teams we’ve helped scope this kind of integration get the most value out of virtual tables when the tenant check and a short filter-requirements workshop are treated as the first two deliverables, not something left until a screen doesn’t do what the demo implied it would.

Virtual tables genuinely remove a maintenance burden that used to be permanent: the sync job nobody wanted to own, the schema drift nobody wanted to chase down. What they don’t remove is the need to know, before the architecture is set, exactly which filters, which tenant, and which record types the integration actually has to support.


#BusinessCentral #DataverseIntegration #VirtualTables #PowerPlatform #ERPIntegration #DynamicsConsulting

Your Field Service Techs Are Getting Blank Screens Offline. The Mobile Offline Profile Is Probably Why.

Field service technician reviewing a mobile app on a rugged tablet at a remote service site

A field technician pulls into a rural service site with one bar of signal, opens the Dynamics 365 Field Service mobile app to check the work order, and gets a blank booking screen. No linked asset. No contact history. No parts list. The dispatcher, sitting in an office with full connectivity, sees the record perfectly. By the time anyone traces the problem, three more technicians have hit the same wall in three different territories, and the rollout that was supposed to cut truck-roll callbacks is instead generating help desk tickets.

Nine times out of ten, this isn’t a connectivity problem. It’s an offline profile problem, and it’s almost always self-inflicted during setup rather than caused by anything Microsoft shipped broken. The mobile offline profile is the single control surface that decides what data a technician’s device downloads before it goes dark, and getting it wrong doesn’t throw an error message. It just quietly leaves data out.

What the Mobile Offline Profile Actually Controls

Every Field Service mobile deployment starts from a default profile, “Field Service Mobile – Offline Profile,” preloaded with the tables most implementations need: bookable resource bookings, work orders, and the handful of related entities technicians touch in the field. Each table in the profile carries its own filter and its own sync frequency, and the defaults are conservative on purpose. Bookings, for instance, are filtered out of the box to only those starting within the next seven days, which keeps the initial download small but also means a technician who needs to glance at next month’s schedule offline simply can’t.

The part that trips up most implementations isn’t the top-level filters. It’s item association: how child tables inherit scope from their parent. When a table is configured with a “related rows only” filter, it doesn’t get its own independent rule, it borrows whatever the parent table’s filter already decided. If a work order filter is scoped to status equals Scheduled, and the contact table beneath it is set to related rows only, technicians lose visibility into every contact tied to a work order that isn’t currently in Scheduled status, including ones they closed out an hour ago and now need to reference for a warranty callback. This is rarely intentional. It’s usually the byproduct of an admin extending the default profile with a new custom table, applying “related rows only” because it’s the fastest configuration path, and never testing what happens once a record moves out of the parent filter’s scope.

Where FetchXML Earns Its Place

Point-and-click filters cover a lot of ground, but they run out fast once the business logic gets specific: technicians who should only see assets under an active maintenance contract, or work orders filtered by a custom priority field that doesn’t map cleanly to the standard filter builder. That’s what the FetchXML editor built into the offline profile experience is for. It sits underneath the same table configuration screen as the standard filter UI, and it lets an admin or developer write the actual query logic that determines what gets pulled down, rather than settling for whatever combinations the visual filter builder happens to expose.

Two details matter here that don’t show up until you’re debugging a slow sync in production. First, table relationships in an offline profile are capped at fifteen linked tables, counting the downstream relationships each linked table pulls in, so a profile built by repeatedly adding “just one more related table” to solve an edge case will eventually hit a wall that has nothing to do with data volume and everything to do with query complexity. Second, several standard tables never make it into offline mode at all regardless of how the FetchXML is written, among them purchase orders, agreements, and return-to-vendor or return-merchandise-authorization records. If a workflow depends on a technician checking RMA status from a job site with no signal, that has to be redesigned around the platform’s boundaries rather than configured away.

The Update Trap Almost Nobody Reads About Until It Bites

Microsoft updates the default offline profile periodically as part of ongoing Field Service releases. That sounds like a convenience, and for tables you haven’t touched, it is: their sync filters get refreshed automatically, though the updated version lands unpublished, waiting for an admin to review and accept it rather than going live silently. The trap is on the other side. The moment you edit a table’s sync filter yourself, that table is permanently excluded from future automatic updates to its filter logic. Your customization sticks, which is usually what you want, but it also means nobody upstream is going to quietly fix a filter you configured eighteen months ago if Microsoft later improves the default logic for that table. Teams that treat the offline profile as a set-and-forget configuration item, rather than something reviewed on the same cadence as the rest of their Field Service solution, tend to find this out the hard way when a filter that was reasonable at go-live has quietly become wrong as the business changed around it.

Rugged tablet showing a sync status dashboard inside a field service van

Sync Behavior and the Conflict Question Nobody Asks Until It Happens

Sync intervals per table can be set anywhere from five minutes to a full day, and a related table with a shorter interval than its parent will pull the parent’s sync cadence down to match, which is a reasonable default but one worth knowing about before you tune a slow-changing table to sync once daily and then wonder why it’s still refreshing every few minutes. The conflict scenario that actually matters operationally is what happens when a technician edits a record offline while a dispatcher edits the same record online before the technician’s device reconnects. Dynamics resolves this at the table level, not the field level, meaning it can’t merge a technician’s parts-used update with a dispatcher’s status change on the same booking if both touched the record. By default, the technician’s offline change wins when the sync finally reconciles; that behavior can be flipped so the dispatcher’s online change takes precedence instead, but it’s a system setting, not something either side of that conflict controls in the moment. Organizations that run high-volume dispatch operations with technicians frequently going in and out of coverage should decide which side should win deliberately, rather than discovering the default behavior mid-incident.

Building a Profile That Holds Up in Production

The practical guidance that actually prevents the blank-screen scenario starts with resisting the urge to filter on “all records” for any table technicians don’t strictly need in full. A technician-scoped view like “my recent bookings” instead of the full bookings table, paired with tight date-range filters, keeps the initial download fast and avoids syncing data nobody in the field will use. For custom logic that needs to run without a network connection, offline-capable JavaScript on the form is the right tool, not a Power Automate flow, since cloud flows simply don’t execute until the device reconnects, which means any process depending on one won’t fire while the technician is actually offline. When custom commands query offline data directly, keeping concurrent database calls to two or three at a time avoids performance degradation on lower-end field devices, and using FetchXML paging with a page cookie rather than pulling an entire table in one request keeps large tables from stalling initial sync. Finally, testing a profile against a realistic data volume, not a clean sandbox with a handful of sample records, is what actually surfaces the fifteen-table ceiling and the related-row inheritance trap before a rollout, rather than after one.

None of this is exotic configuration. It’s closer to data modeling than app administration, and it rewards the same discipline: understand what each table’s filter actually inherits, know where the platform’s hard limits sit before you design around them, and revisit the profile as a living part of the solution rather than a one-time setup task. Teams we’ve worked with on Field Service rollouts consistently find that the offline profile, more than any other single configuration piece, determines whether the mobile app earns trust in the field or becomes the thing technicians route around.


#FieldServiceMobile #DynamicsFieldService #FetchXML #OfflineDataSync #EnterpriseMobility