Securing Multi-Tenant Dataverse Deployments: Governance Models and Compliance Strategies for Enterprise Organizations

Enterprise data governance dashboard showing Dataverse multi-tenant architecture with secure data silos and compliance controls

When a large manufacturing conglomerate with seven regional subsidiaries decided to consolidate its Dynamics 365 deployments, the IT leadership faced a fundamental question: should each subsidiary run its own independent Dataverse environment, or could they share a single tenant with logical data separation? The answer shaped not just their technical architecture but their compliance posture, operational costs, security model, and ability to scale quickly. It took six months of planning to get it right.

This is the decision every large enterprise faces when moving Dynamics 365 to the cloud. Dataverse gives organizations flexibility in how they structure data and access, but that flexibility demands clear governance thinking. The wrong choice creates either unnecessary costs, security vulnerabilities, or both.

Dataverse Multi-Tenancy: Three Fundamental Models
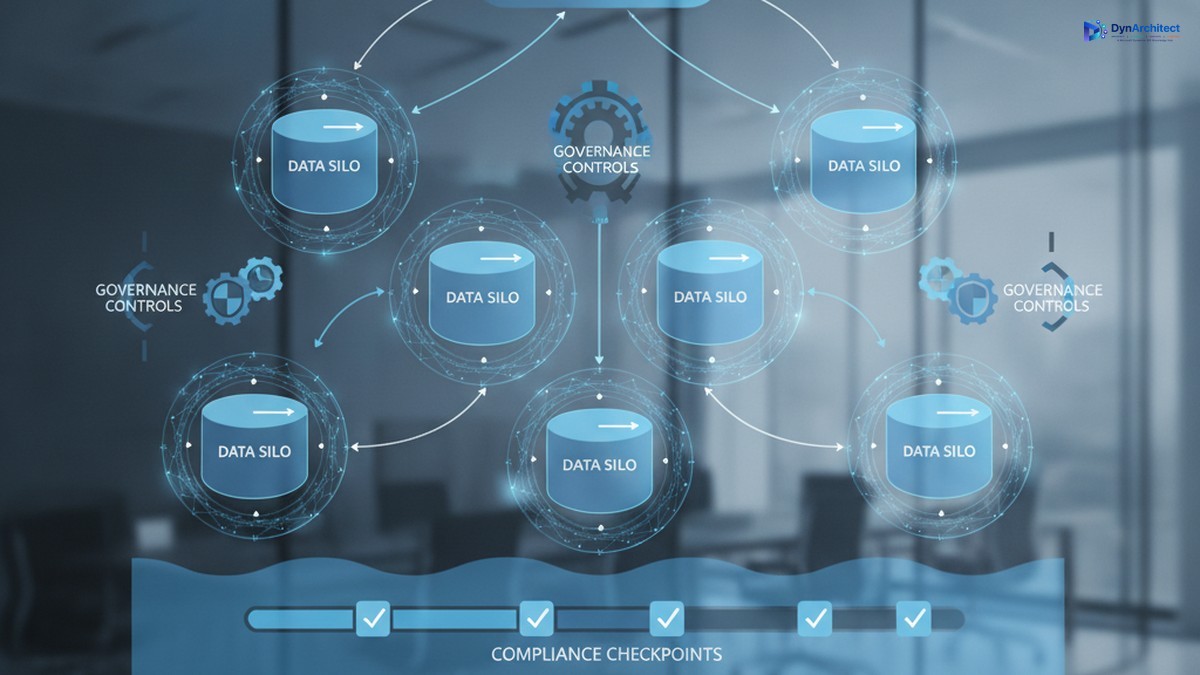
Enterprise data governance dashboard showing Dataverse multi-tenant architecture with secure data silos and compliance controls

Enterprises typically evaluate three deployment patterns, each with distinct governance and operational implications.

Single-tenant deployment assigns a dedicated Dataverse environment to one business unit or subsidiary. This model simplifies tenant isolation since no shared infrastructure exists by definition. Security boundaries are cleaner. Compliance is straightforward if each tenant operates independently. However, fixed operational costs accrue per environment. Database administration, monitoring, backup, and disaster recovery all require separate infrastructure management. For smaller subsidiaries or regional offices, this overhead becomes difficult to justify financially.

Multi-tenant through shared services consolidates multiple business units into one Dataverse environment. A single application or shared platform manages data for many organizations. The platform itself enforces logical separation through row-level security rules, tenant-scoped data models, and access controls. This dramatically reduces infrastructure costs and operational complexity. A single database serves multiple customers or business units with one support team managing the system. The tradeoff is immediate: the governing application must understand which organization a request belongs to, and that context must remain consistent across every operation, from queries and reports to background jobs and integrations. A single tenant-context error can leak data across organizational boundaries. Compliance teams want evidence that this separation actually works in practice.

Hybrid deployment splits the difference. Some data, like shared employee records or common business reference tables, lives in a truly shared environment. Sensitive or regulated data, integrations requiring stronger isolation, or high-value processes get their own dedicated environments. This approach suits large enterprises with compliance mandates that prohibit certain data sharing while allowing others. It requires governance discipline to maintain two separate data environments and ensure they stay in sync where intended.

The Governance Foundation: Tenant Identity and Isolation
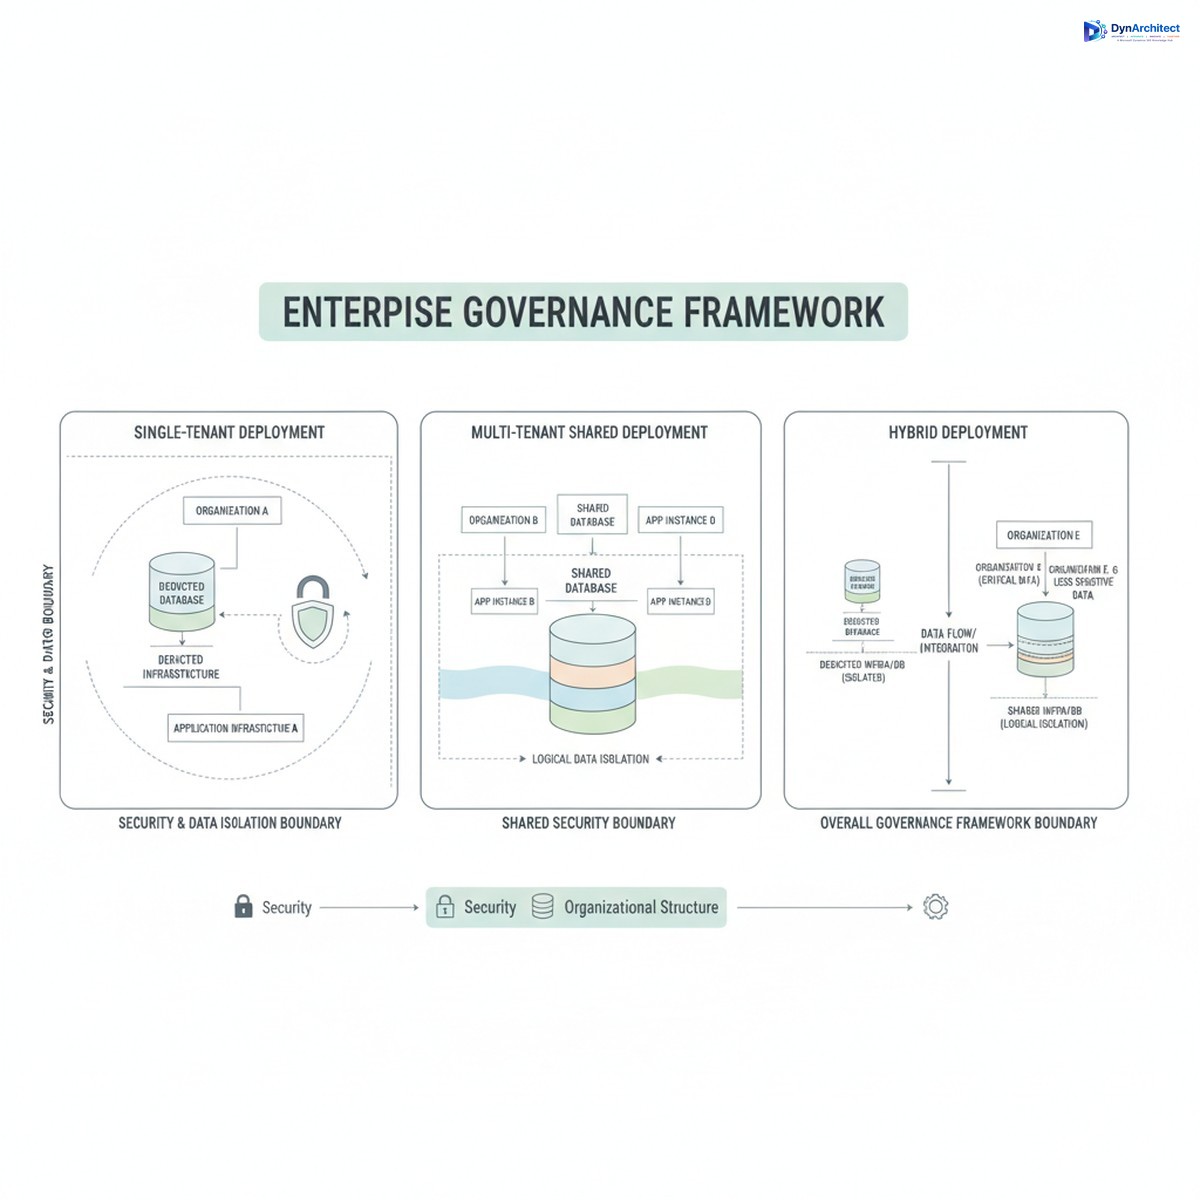
Three tenant deployment models for Dynamics 365 showing single-tenant, multi-tenant shared, and hybrid architectures

Successful multi-tenant deployments rest on one foundational principle: a stable, immutable tenant identifier that serves as the authoritative reference throughout the entire system. This is not the legal entity name, which can change. Not the region code, which can be reorganized. It is a stable, globally unique identifier assigned once to each tenant and never changed.

That identifier must flow consistently through every data operation. Row-level security rules check it to filter records. Integration service calls include it to route data to the correct tenant. Batch jobs and background processing reference it to ensure work stays within tenant boundaries. Logging systems tag every action with it. Reporting queries filter by it. Caching mechanisms key on it. If the tenant context becomes inconsistent anywhere in the system, separation breaks.

Compliance teams increasingly demand evidence that this separation actually works. That evidence includes tenant-attributed logging showing what data each tenant accessed and when, deletion verification confirming that removed records do not appear in other tenants’ data, and incident response procedures demonstrating how the organization would investigate suspected data leakage. Testing tenant isolation is no longer optional for regulated industries.

Governance Structures and Organizational Alignment

Multi-tenant governance requires clear organizational decision-making. Large enterprises typically establish a steering committee with representation from business unit leaders, compliance, information security, and IT operations. This committee makes decisions about which business units share a tenant, who has administrative access, approval processes for data access changes, and how compliance incidents are escalated.

Role-based access control becomes more complex in multi-tenant systems. A user working for Subsidiary A should never see Subsidiary B’s data, even if they have elevated system permissions. Dataverse security roles, business unit assignments, and column-level security all play a part. But the governing application layer above Dataverse must also respect these boundaries. A sales user from one region should not be able to see pipeline data from a different region through an analytics dashboard, even if the underlying queries are technically able to retrieve that data.

For organizations with strict regulatory requirements, the governance model may include physical separation of sensitive data. Regulated or restricted information remains in a dedicated, single-tenant environment with its own security posture, audit trail, and access controls. Non-sensitive shared data, like product catalogs or employee directories, lives in a shared tenant. This hybrid approach reduces operational costs for non-sensitive data while maintaining compliance for sensitive domains.

Compliance and Risk Management Implications

Multi-tenant Dataverse deployments touch several regulatory and risk areas that executives and compliance officers must address before deployment.

Data residency and sovereignty are the first consideration. Some regulations require data to remain in a specific country or region. A shared Dataverse environment across many business units may violate residency requirements if any tenants must store data outside their home region. The governance decision here may force certain subsidiaries into their own environments regardless of cost.

Data retention and deletion become more complex in multi-tenant systems. When a customer or business unit leaves your organization, their data must be removed completely, with no residual traces in shared systems. Testing this process and documenting it is essential for regulatory audits. Shared environments require proof that deletion actually worked and did not accidentally retain records in caches, backup systems, or logs.

User access and entitlements require clear governance. Who approves data access requests? How do you audit who has access to what? Multi-tenant systems need centralized entitlement management where access decisions can be reviewed, revoked, and traced back to business justifications. Integrating with Microsoft Entra ID and governance tools like privileged access management becomes necessary.

Building the Governance Framework

Successful enterprises start governance planning before they write code or configure Dataverse. The planning phase answers five key questions:

First, which data is truly shared, and which data must stay isolated? Not all data requires separation. Employee directories and organizational reference tables can be safely shared. Customer lists, financial records, and intellectual property need isolation.

Second, what tenant model fits the business? Single-tenant is simplest but most costly. Multi-tenant requires discipline but scales efficiently. Hybrid requires the most planning but may be necessary for compliance.

Third, how will you prove isolation works? Logging, testing, and incident response procedures should be planned upfront, not added later.

Fourth, who owns governance decisions? A clear organizational structure with decision rights prevents delays and conflicting policies.

Fifth, how will you monitor and enforce compliance? Automated controls, regular audits, and incident response playbooks should be part of the initial design, not afterthoughts.

Organizations that move Dataverse without this governance foundation often discover problems after deployment. Reorganizations reveal security gaps. Audits uncover poorly documented access controls. System failures expose incomplete backup strategies. The cost of retrofitting governance after deployment far exceeds the cost of planning correctly upfront.

The Path Forward

Dataverse multi-tenancy is not inherently risky, but it demands deliberate governance planning. Enterprises that treat this as a technical infrastructure decision alone will eventually face compliance violations, security incidents, or costly redesigns. Those that treat it as a governance and organizational design problem, with technical architecture supporting that design, build systems that are secure, compliant, and resilient. The most successful implementations started with governance, not with infrastructure.


About Routeget Technologies: Routeget assists enterprises with Dynamics 365 governance, architecture, and deployment strategy, helping organizations structure multi-tenant environments that balance operational efficiency with compliance requirements.

#DataverseGovernance #MultiTenantArchitecture #DynamicsCompliance #DataverseIsolation #EnterpriseDataStrategy #CloudArchitecture #DataGovernance

Optimizing Power BI Premium Capacity Management: Resource Allocation, Query Performance, and Cost Governance

Power BI Premium capacity management dashboard

Most organizations deploying Power BI Premium start with a single capacity and assume the cloud handles the complexity. Within months, they encounter the same problem: reports that were responsive at launch now run slowly, refresh jobs fail intermittently, and the monthly capacity bill climbs without corresponding value. The issue is rarely that Premium itself is insufficient; it is that few teams understand how Premium actually allocates compute, how to monitor that allocation in real time, and how to design workloads that fit the capacity constraints.

This is a technical guide for BI architects, developers, and capacity administrators who need to build production Power BI environments that deliver consistent performance and predictable costs. We will work through capacity planning, workload isolation, query optimization, and the operational patterns that prevent Premium environments from becoming expensive, unreliable systems.

Understanding Power BI Premium Capacity Architecture

Power BI Premium provides a dedicated cloud resource that isolates your organization’s workloads from the multi-tenant shared capacity used by Pro license users. That isolation is the primary value, but it also introduces responsibility: you now own the capacity planning, performance tuning, and cost management that shared capacity users delegate to Microsoft.

A Premium capacity is measured in compute units called virtual cores, or v-cores, priced in tiers from 1 core upward. Each v-core provides a fixed compute budget allocated across query execution, data refresh, and paginated reporting. The budget refreshes hourly. When workloads exceed that budget, Premium applies throttling: queries slow, refreshes delay or fail, and users experience degradation until the current hour’s budget resets.

This is not a failure mode; it is intentional. The throttling is meant to protect the capacity from runaway queries and ensure consistent service levels across all workloads sharing the same capacity. The problem occurs when capacity is undersized relative to the workload, or when workloads are poorly designed and consume disproportionate resources relative to their value.

Capacity Sizing and Workload Assessment

Build an honest inventory of what will run on the capacity. Most organizations plan around a single “average” workload size, then are shocked when peak usage overwhelms that estimate. A realistic approach profiles three scenarios: peak refresh, peak query, and a mixture of both.

Refresh costs depend on semantic model size, refresh frequency, and incremental refresh strategy. A 10 GB model refreshed hourly demands very different compute than a 1 GB model refreshed daily. Measure actual memory consumption and query duration during a test refresh, then multiply by expected concurrency during peak hours.

Query costs are driven by semantic model size, query complexity, and concurrent users. A simple filtered report consumes far less capacity than complex matrix visuals with millions of cross-filtered cells. DirectQuery and real-time data are more expensive than import mode. The capacity is effectively governed by the least-optimized workload; a single slow dashboard can trigger throttling affecting all operations.

Instrument capacity usage with Power BI’s Metrics app or Admin API, measure actual consumption over a production month, and size to the 95th percentile of observed usage, not the average. Most organizations reduce capacity cost by 20 to 40 percent by simply understanding what they actually use.

Workload Isolation and Semantic Model Design

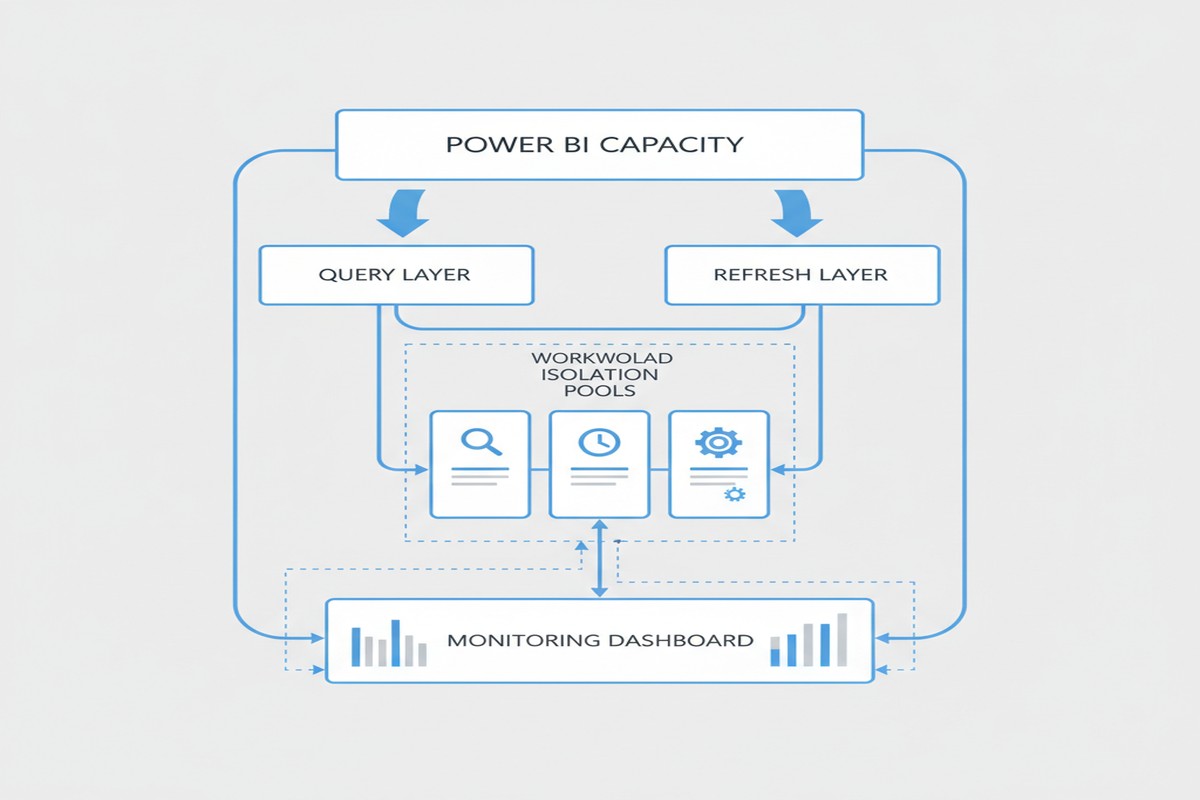
Premium capacity provides a feature called “workload isolation” that allows you to assign different workloads to separate compute pools with independent resource budgets. The most common pattern is to separate refresh workloads from query workloads, or to isolate a single expensive application from the rest of the organization’s reports.

At a technical level, workload isolation is effective because refresh and query operations compete for the same compute and memory on a shared capacity. During peak refresh hours, query performance degrades because the refresh jobs are consuming available vcore budgets. By isolating refresh into a dedicated workload with its own budget, you guarantee that queries will never starve, and vice versa.

Power BI capacity architecture and workload isolation

The decision to isolate workloads depends on whether the cost of isolation (you lose some capacity efficiency by dedicating separate resource pools) is outweighed by the benefit (guaranteed performance for critical queries or refreshes). For most organizations, a single isolated refresh workload is sufficient. Rarely do you need more than two or three workload isolations.

Semantic model design influences capacity efficiency dramatically. A single large model shared across many reports is more efficient than many small, redundant models duplicating the same dimensions and facts. However, large models are harder to maintain, permission, and optimize. Most organizations converge on a “hub-and-spoke” design: a small number of enterprise semantic models (3 to 6) owned by a central BI team, serving as the foundation for business-unit-specific reports and dashboards.

Query Optimization and Real-Time Analysis

Two mechanisms significantly impact capacity consumption: query folding in Power Query and relationship optimization in the semantic model.

Query folding pushes filter and aggregation operations down to the data source rather than pulling all data into Power BI for in-memory filtering. A properly folded query reduces data movement and memory consumption by orders of magnitude. The tradeoff is complexity: folded queries must be executable by the source system, ruling out some Python/R transformations.

For large data volumes or high refresh frequencies, investing in query folding often yields the highest return, reducing refresh time from hours to minutes and freeing up capacity for other workloads.

Relationship optimization includes careful cardinality settings, appropriate many-to-many relationships, and explicit measure branching. A model with thousands of ambiguous relationships forces Power BI to perform expensive relationship resolution on every query. Clean data models with clear relationships and explicit measures are far more efficient.

For real-time scenarios, DirectQuery and Push Datasets lower capacity consumption. DirectQuery queries the source directly but adds latency; the source must respond in hundreds of milliseconds. Push Datasets allow external systems to push data at API speeds, avoiding refresh windows entirely. Both require careful architecture to avoid swamping the data source.

Operational Monitoring and Cost Governance

Premium capacity consumption is measured via the Power BI Admin portal’s Metrics app and the Power BI API, which exposes activity logs and CPU/memory consumption by operation. The Admin API enables custom monitoring dashboards and automated alerting when thresholds are breached.

A mature Premium environment includes automated monitoring for capacity utilization trends, workloads consuming abnormal resources, failed refresh operations, and per-workload cost attribution enabling chargeback.

Governance practices include: quarterly capacity review boards, documented naming standards for models and reports, capacity impact assessment before onboarding new workloads, and performance SLAs backed by monitoring.

Organizations that skip this governance layer often find their Premium environment becomes a black box: costs rise unpredictably and performance degrades without clear cause. Operational tooling and governance practices pay for themselves many times over.

Common Pitfalls and Practical Next Steps

The most common mistakes are: sizing capacity based on theoretical maximum load rather than measured reality, allowing unoptimized queries and large unfolded data imports to run without constraint, mixing enterprise semantic models with personal workloads on the same capacity, and ignoring refresh scheduling and allowing refreshes to overlap.

The path forward is straightforward: measure actual consumption with the Metrics app or Admin API over a production month, document the peak periods and peak workloads, assess which workloads could be optimized with query folding or model redesign, and then right-size the capacity and implement workload isolation for any critically important refresh or query workload. Follow up monthly with utilization reviews and alert on workloads that consume anomalously high resources.

For teams implementing Premium for the first time, a pragmatic starting point is often a single 2 or 4 vcore capacity, one workload isolation for refreshes, and a simple monitoring dashboard tracking hourly utilization. From there, optimization and growth are data-driven: measure, identify bottlenecks, optimize, and only increase capacity when the measured peak approaches the capacity ceiling. Organizations that follow this pattern consistently report 30 to 50 percent lower costs than those that simply throw capacity at performance problems without understanding the underlying workload characteristics.


Routeget Technologies has guided dozens of organizations through Premium capacity design and optimization, from initial sizing through multi-capacity deployments with sophisticated governance. If your Premium environment is facing performance challenges or cost surprises, the root cause is almost always visibility and deliberate design, not capacity limitations.


#PowerBIPremium #CapacityManagement #DataLakeArchitecture #QueryOptimization #PowerBIGovernance #EnterpriseBI #DataEngineering

Building a Sustainable Power Automate Center of Excellence: Governance Without Gridlock

Most organizations that deploy Power Automate do so without any governance structure, then scramble to build one after their citizen developers have created hundreds of inconsistent, poorly monitored automations. The result is predictable: Shadow IT runs deeper, cloud costs spike unpredictably, and IT eventually responds with policies so rigid that the business stops creating new flows and the platform stalls. The tension between speed and control is real, but it does not require choosing one or the other.

A Center of Excellence for Power Automate is simply a structured approach to decision-making: who gets to build flows, what patterns we enforce, how we measure success, and where funding comes from. It is not bureaucracy. It is the difference between a platform that serves business strategy and one that devolves into a cost and compliance liability.

Why Power Automate Centers of Excellence Matter

Before the Cloud, automation meant capital expenditure on licensed tools, IT-owned build processes, and a multi-year return-on-investment narrative. Business units that needed a workflow change submitted requests and waited. Power Automate inverted this model. Individual contributors with no coding background can now build workflows that connect dozens of applications, move data, and execute business logic in minutes rather than months.

This democratization is valuable, but it creates an organizational problem. Without structure, a 500-person organization can quickly accumulate 2,000 flows built by people who do not know about each other’s work, who use different authentication patterns, who log into different cloud environments, and who have no shared understanding of which flows are business-critical versus experimental prototypes. When a flow breaks at 2 a.m. on a Saturday, no one knows why, because the person who built it is no longer with the company. When your automation bill spikes 40% month over month, you cannot explain why, because no one is tracking flow execution patterns.

A CoE provides visibility, standardization, and accountability without becoming an approval bottleneck. It articulates the expectations around flow design, security, data governance, and cost management so that developers can move quickly and IT can sleep at night.

Organizational Structure: Three Patterns That Work

The most effective CoE structures share a common shape: a small central team responsible for standards, enablement, and governance; a distributed network of power users embedded within business units; and clear escalation paths from edge to center.

The central team should be small, typically two to four people, depending on organization size. Its role is not to build flows for every department, but to establish patterns, mentor citizen developers, and make the hard calls when conflicts arise. The team member should come from IT but ideally have business acumen—someone who understands both technical architecture and why the business cares about a given workflow. This role often seats best as a product manager rather than a pure engineer, since the job is as much about communication and change management as it is about technical decisions.

Distributed power users are the actual force multiplier. These are individuals in Finance, Operations, Sales, or HR who have invested time learning Power Automate deeply and can build flows, mentor peers, and serve as the first line of triage when flows behave unexpectedly. Organizations often resist this approach because it seems to decentralize control, but experience shows the opposite. When power users exist within their own departments, flows get built faster, are maintained more reliably, and align better with business context because the builder is embedded in the problem domain. The CoE provides training, sets standards, and holds power users accountable to those standards, but does not make them beg for permission.

Escalation paths matter. If a power user wants to build a flow that touches sensitive financial data, or that orchestrates changes across multiple critical systems, the CoE should have a clear, lightweight process to evaluate the design and approve the build. This is not a veto gate; it is a collaborative design review. Most escalations resolve quickly because the CoE can flag real risks (poor error handling, missing audit trails, data loss exposure) and guide the builder toward a more robust solution. The business gets its flow, and IT maintains reasonable confidence in the architecture.

Governance Framework: Standards Without Bureaucracy

Power Automate governance typically fails in one of two directions: it is either too loose (anything goes, leading to chaos), or too tight (everything requires approval, leading to workarounds). A functional governance framework sits between these poles.

Start with flow taxonomy. Define three categories: production flows (business-critical, require naming conventions and documentation), standard flows (departmental automations that follow company patterns but do not require escalation), and experimental flows (one-off tests and prototypes, deleted after 90 days if not promoted to production). This simple taxonomy lets developers understand expectations immediately and lets IT focus oversight where it matters most.

Establish naming and documentation standards. This sounds bureaucratic but solves real problems. A flow named “P001” tells you nothing. A flow named “Sales-QuoteApproval-VP” immediately tells you the business domain, the function, and the approval level. When a developer checks the existing flows, they can find related work and avoid duplication. When you need to disable a set of flows for maintenance, you can identify all related ones quickly. Documentation templates (one sentence describing what the flow does, the owner contact, the systems it touches) take five minutes to complete and dramatically reduce the knowledge burden when the builder leaves the company.

Data governance rules must be specific to your risk profile. Most organizations should establish: flows that touch Dynamics 365 Finance or HR systems must use managed identities and log all operations to an audit table; flows that create, update, or delete records in any production environment must include error handling and notification to the flow owner on failure; flows that move data between systems must encrypt data in transit and log the data movement event; flows that exceed 50 executions per day should be reviewed quarterly to confirm they still provide business value. These rules are not arbitrary IT gatekeeping; they reflect the business’s real exposure to data loss, compliance violations, and cost overruns.

Funding and Stakeholder Alignment

A CoE that must justify its existence through a departmental budget burns out quickly. Instead, embed the cost in the automation project’s business case. When Finance proposes an automation that will save a manual process, the total cost of ownership includes the CoE’s contribution: the design review, the mentoring, the platform licensing, the monitoring and ongoing optimization. This aligns incentives. If the CoE is too restrictive or slow, the business unit pushes back and the executive sponsor hears about it. If the CoE is too permissive and allows bad automations to proliferate, the operations team sees costs rise and demands better governance.

Create a steering committee that meets quarterly, including representatives from major business units, IT leadership, finance, and compliance. This committee reviews CoE performance (how many flows, what categories, cost per automation), approves new platform features or tool purchases, and arbitrates any major policy changes. This keeps the CoE accountable and prevents it from becoming an insular IT function that loses touch with business needs.

Measuring Success

Set metrics that matter. Track the number of production flows, the average time to build a flow once it is approved, the ratio of successful executions to failures, and the cost per automation. More importantly, survey power users and business unit leaders annually on whether Power Automate is enabling them or creating friction.

A CoE that has reduced flow-creation cycle time from eight weeks (under an old IT process) to three days and has achieved 99.5% execution reliability is delivering value even if it has not eliminated every risk. The point is not perfection; it is enabled business agility coupled with acceptable risk.

Common Pitfalls

Organizations often stumble on a few predictable mistakes. The first is creating a CoE without giving it authority. If the central team cannot enforce naming standards or require design reviews, it becomes an advisory body that developers ignore, and you have gained nothing except an extra cost center. The second is over-investing in tooling before you have clarity on the actual problem. Buy governance software only after you understand what you are trying to govern; often a simple spreadsheet and a SharePoint site suffice. The third is confusing CoE with “IT approval committee.” Governance should be about patterns and risk management, not about gating every creative idea because IT wants to be in control. If a power user’s approach is sound but unconventional, approve it and monitor it; do not reject it because it does not match a template.

Finally, do not neglect the change management dimension. If your organization has relied on Shadow IT for years, a CoE that suddenly requires visibility into all flows will face resistance. Plan for a communication campaign, early wins that demonstrate the value of transparency, and meaningful involvement of power users in CoE decisions from the start.

Moving Forward

Building a Center of Excellence for Power Automate is not a one-time project; it is an organizational capability that evolves as the platform matures. Start by identifying your central team and your first set of power users. Define basic standards around flow naming, documentation, and data handling. Establish your escalation path for production flows. Monitor adoption, cost, and execution reliability. Adjust based on what you learn.

Organizations that take this approach typically report that Power Automate adoption accelerates within six months, not because governance is loose, but because developers know the expectations and can move with confidence. Costs become predictable because you understand what is running and why. And the platform becomes a genuine strategic asset rather than a shadow IT liability.

Routeget Technologies has implemented Power Automate Centers of Excellence for financial services, healthcare, and manufacturing clients, and the patterns that work remain consistent: clear governance that focuses on risk and enablement rather than control; distributed power users who are vested in the business outcome; and a small central team that removes obstacles and sets standards rather than approving every decision. The structure is less important than the commitment to treat Power Automate as a managed platform rather than a free-for-all tool.

#PowerAutomateCOE #FlowGovernance #LowCodeGovernance #ProcessAutomation #AutomationStrategy #EnterpriseAutomation

Implementing Predictive Lead Scoring in Dynamics 365 Sales: Technical Architecture and Model Training

Sales organizations face a persistent challenge: most leads that enter the pipeline lack sufficient qualification signals, forcing sales teams to invest time and resources pursuing prospects with poor conversion odds. Rule-based lead scoring—manual point assignments for job title, company size, or email opens—falls apart at scale, especially when customer engagement patterns across multiple touchpoints remain isolated in separate systems. The result is wasted effort and extended sales cycles.

Dynamics 365 Sales offers native integration with AI Builder, which enables development teams to build predictive lead scoring models trained on historical customer engagement data within the platform. Unlike black-box SaaS solutions that require data export and integration overhead, this approach keeps customer data within your Dynamics 365 boundary, maintains compliance with data governance policies, and surfaces predictions directly in the sales interface where they influence deal qualification and prioritization decisions. Building and deploying a production predictive model requires understanding how to structure training data, configure model parameters, evaluate model performance, and integrate scoring results back into the sales workflow.

Structuring Data for Predictive Model Training

Predictive lead scoring models rely on historical examples of leads that converted versus those that did not. AI Builder requires a minimum of 100 historical examples in your training dataset, though 500 to 1,000 examples typically produce more stable, generalizable models. You must first decide which entity will serve as your training target. Most implementations use the Lead entity itself (marking leads as qualified or disqualified) or the Opportunity entity (marking won versus lost deals). The decision hinges on your business process: if you qualify and convert leads to opportunities separately, train on the Opportunity entity to capture conversion likelihood; if you operate a lead-only model, train on the Lead entity with a binary outcome field (for example, “Lead Status” with values “Qualified” or “Disqualified”).

Once you select your training target, identify the feature columns (predictive variables) that your model will use. These typically include demographic attributes (company industry, company size, lead source), behavioral signals (number of emails opened from marketing campaigns, days since last engagement, number of form submissions), and engagement frequency metrics (contact attempts, phone call outcomes). The model works best when features represent actual customer interactions or attributes that vary meaningfully between converted and unconverted leads. Avoid including target-correlated features (for example, do not include “Deal Closed” as a feature when trying to predict deal closure, since this creates circular reasoning).

Preparing and Configuring the Prediction Model

Within Dynamics 365 Sales, navigate to AI Builder and select “Binary Prediction” (a classification model that predicts one of two outcomes, such as “will convert” or “will not convert”). Upload your training dataset by pointing AI Builder to the entity containing your historical lead or opportunity records. The system automatically detects columns, infers data types, and suggests features. You must then map the target column (the outcome you want to predict) and select which additional columns should be used as features. AI Builder’s interface allows you to include or exclude specific columns; exclude highly correlated columns, columns with sparse data (more than 50 percent missing values), and columns that lack predictive power (for example, internal notes fields that contain unstructured text).

Configure model parameters by specifying the threshold at which the model will classify a lead as “high likelihood to convert.” By default, AI Builder uses 0.5 (50 percent) as the decision boundary, meaning the model must predict a probability of at least 0.5 for the lead to be marked as high-scoring. In practice, you may want to lower this threshold to catch more potential deals (increasing recall at the cost of some false positives) or raise it to be more conservative (increasing precision at the cost of missing some opportunities). Your choice depends on your sales process: if your team has capacity to follow up on all leads, a lower threshold catches more opportunities; if your team is constrained, a higher threshold focuses effort on the most promising leads.

Evaluating Model Quality and Performance

Before deploying a model to production, evaluate its performance using standard classification metrics. AI Builder provides precision, recall, F1 score, and AUC (area under the receiver operating characteristic curve) after training. Precision measures the proportion of predicted high-scoring leads that actually convert; recall measures the proportion of actual converts that the model correctly identified as high-scoring. Aim for a balanced combination: a model with high precision but low recall catches few opportunities, while a model with high recall but low precision floods your team with low-probability leads. The F1 score (harmonic mean of precision and recall) offers a single metric summarizing this balance. An AUC above 0.7 generally indicates useful discrimination; above 0.8 indicates strong model quality.

Importantly, evaluate your model on held-out test data (records not used during training), not on the training set itself. AI Builder automatically splits your dataset for this purpose. If your model performs well on training data but poorly on test data, your model may be overfitting to noise in the training set; in this case, simplify the model by removing non-predictive features or retraining with more diverse historical examples.

Integrating Scoring Results into Sales Workflows

Once your model passes quality checks and you publish it to production, integrate the scoring results into your sales process. AI Builder allows you to invoke the model on demand via a Power Automate cloud flow or as a plug-in on the Lead or Opportunity form. The most common pattern is a Power Automate cloud flow triggered when a lead is created, which calls the prediction model, captures the predicted probability and classification, and updates a custom “Predicted Score” column on the lead record. This score then becomes available in lead views, pipeline analytics, and mobile applications.

From a user experience perspective, surface the predicted score prominently on the sales dashboard and lead detail form so sales reps see the qualification confidence at a glance. Many organizations color-code leads based on predicted score (green for high probability, yellow for medium, red for low) to guide qualification decisions. Some teams implement a business rule that automatically assigns high-scoring leads to senior reps and routes low-scoring leads to junior reps for initial outreach, thereby optimizing resource allocation based on deal likelihood.

Monitoring Model Drift and Retraining

Predictive models do not remain accurate indefinitely. As your sales process evolves, customer behavior changes, or market conditions shift, the patterns your model learned during training may no longer reflect current conditions (a phenomenon called model drift). Set a quarterly or semi-annual schedule to assess model performance on recent data. If accuracy metrics decline by more than 5 to 10 percent compared to the original test results, retrain the model on a fresh dataset that includes recent leads and opportunities. AI Builder enables retraining as a straightforward operation: select the published model, update the training dataset to include new records, and republish.

Document your model’s feature importance (which inputs the model weights most heavily) so your organization understands what drives scoring decisions. AI Builder provides a feature importance report showing which columns contribute most to the model’s predictions. If your model places high importance on a feature that represents potential data quality issues (for example, “Days Since Last Email” if email tracking is inconsistent), address the data quality problem to improve future model iterations.

Common Pitfalls and Practical Guidance

A frequent mistake is training a model on imbalanced data, where one outcome (for example, “converted”) is much rarer than the other. If 80 percent of your historical leads did not convert, the model may learn to simply predict “no conversion” for all leads, achieving high accuracy but zero business value. To address this, explicitly configure class weights in your training setup (telling the model that conversions should be weighted more heavily) or oversample the minority class during data preparation.

Another pitfall is treating the model as a black box. Sales leaders sometimes interpret predicted scores as absolute probabilities rather than relative rankings. Communicate clearly that a predicted score of 0.8 does not mean “this lead has an 80 percent chance to close”; it means the model ranks this lead among the highest-probability prospects relative to others in your pipeline. The model’s value lies in comparative ranking and resource allocation, not in absolute probability estimation.

Finally, involve your sales leadership and operations team in model design and interpretation. If your organization has complex sales processes (for example, different qualification rules for enterprise deals versus mid-market deals), consider building separate models for each segment rather than a single global model. Similarly, if significant changes occur (a major product launch, a shift in target customer, an acquisition), retrain your model on data that reflects these new conditions.

Conclusion

Predictive lead scoring powered by AI Builder and native Dynamics 365 integration transforms how sales teams allocate effort and prioritize opportunities. By systematically capturing historical conversion patterns and translating them into forward-looking probability estimates, your organization gains visibility into which prospects justify investment and which may be better pursued later. The technical implementation is straightforward for most organizations: structure historical lead and opportunity data, configure an AI Builder classification model, evaluate performance on test data, and integrate results through Power Automate and the sales interface. Retraining quarterly and involving sales leadership in model governance ensures your scoring system remains effective as market conditions and customer behavior evolve. Routeget Technologies has deployed predictive lead scoring across dozens of Dynamics 365 Sales implementations, helping organizations increase pipeline accuracy and accelerate sales velocity through data-driven qualification.

#PredictiveLeadScoring #AIBuilderDynamics365 #SalesIntelligence #DynamicsSalesAI #CustomerInsights #PredictiveAnalytics #SalesEnablement #DynamicsImplementation #EnterpriseAI #SalesDataStrategy

Implementing Predictive Lead Scoring in Dynamics 365 Sales: Technical Architecture and Model Training

Sales organizations face a persistent challenge: most leads that enter the pipeline lack sufficient qualification signals, forcing sales teams to invest time and resources pursuing prospects with poor conversion odds. Rule-based lead scoring—manual point assignments for job title, company size, or email opens—falls apart at scale, especially when customer engagement patterns across multiple touchpoints remain isolated in separate systems. The result is wasted effort and extended sales cycles.

Dynamics 365 Sales offers native integration with AI Builder, which enables development teams to build predictive lead scoring models trained on historical customer engagement data within the platform. Unlike black-box SaaS solutions that require data export and integration overhead, this approach keeps customer data within your Dynamics 365 boundary, maintains compliance with data governance policies, and surfaces predictions directly in the sales interface where they influence deal qualification and prioritization decisions. Building and deploying a production predictive model requires understanding how to structure training data, configure model parameters, evaluate model performance, and integrate scoring results back into the sales workflow.

**Structuring Data for Predictive Model Training**

Predictive lead scoring models rely on historical examples of leads that converted versus those that did not. AI Builder requires a minimum of 100 historical examples in your training dataset, though 500 to 1,000 examples typically produce more stable, generalizable models. You must first decide which entity will serve as your training target. Most implementations use the Lead entity itself (marking leads as qualified or disqualified) or the Opportunity entity (marking won versus lost deals). The decision hinges on your business process: if you qualify and convert leads to opportunities separately, train on the Opportunity entity to capture conversion likelihood; if you operate a lead-only model, train on the Lead entity with a binary outcome field (for example, “Lead Status” with values “Qualified” or “Disqualified”).

Once you select your training target, identify the feature columns (predictive variables) that your model will use. These typically include demographic attributes (company industry, company size, lead source), behavioral signals (number of emails opened from marketing campaigns, days since last engagement, number of form submissions), and engagement frequency metrics (contact attempts, phone call outcomes). The model works best when features represent actual customer interactions or attributes that vary meaningfully between converted and unconverted leads. Avoid including target-correlated features (for example, do not include “Deal Closed” as a feature when trying to predict deal closure, since this creates circular reasoning).

**Preparing and Configuring the Prediction Model**

Within Dynamics 365 Sales, navigate to AI Builder and select “Binary Prediction” (a classification model that predicts one of two outcomes, such as “will convert” or “will not convert”). Upload your training dataset by pointing AI Builder to the entity containing your historical lead or opportunity records. The system automatically detects columns, infers data types, and suggests features. You must then map the target column (the outcome you want to predict) and select which additional columns should be used as features. AI Builder’s interface allows you to include or exclude specific columns; exclude highly correlated columns, columns with sparse data (more than 50 percent missing values), and columns that lack predictive power (for example, internal notes fields that contain unstructured text).

Configure model parameters by specifying the threshold at which the model will classify a lead as “high likelihood to convert.” By default, AI Builder uses 0.5 (50 percent) as the decision boundary, meaning the model must predict a probability of at least 0.5 for the lead to be marked as high-scoring. In practice, you may want to lower this threshold to catch more potential deals (increasing recall at the cost of some false positives) or raise it to be more conservative (increasing precision at the cost of missing some opportunities). Your choice depends on your sales process: if your team has capacity to follow up on all leads, a lower threshold catches more opportunities; if your team is constrained, a higher threshold focuses effort on the most promising leads.

**Evaluating Model Quality and Performance**

Before deploying a model to production, evaluate its performance using standard classification metrics. AI Builder provides precision, recall, F1 score, and AUC (area under the receiver operating characteristic curve) after training. Precision measures the proportion of predicted high-scoring leads that actually convert; recall measures the proportion of actual converts that the model correctly identified as high-scoring. Aim for a balanced combination: a model with high precision but low recall catches few opportunities, while a model with high recall but low precision floods your team with low-probability leads. The F1 score (harmonic mean of precision and recall) offers a single metric summarizing this balance. An AUC above 0.7 generally indicates useful discrimination; above 0.8 indicates strong model quality.

Importantly, evaluate your model on held-out test data (records not used during training), not on the training set itself. AI Builder automatically splits your dataset for this purpose. If your model performs well on training data but poorly on test data, your model may be overfitting to noise in the training set; in this case, simplify the model by removing non-predictive features or retraining with more diverse historical examples.

**Integrating Scoring Results into Sales Workflows**

Once your model passes quality checks and you publish it to production, integrate the scoring results into your sales process. AI Builder allows you to invoke the model on demand via a Power Automate cloud flow or as a plug-in on the Lead or Opportunity form. The most common pattern is a Power Automate cloud flow triggered when a lead is created, which calls the prediction model, captures the predicted probability and classification, and updates a custom “Predicted Score” column on the lead record. This score then becomes available in lead views, pipeline analytics, and mobile applications.

From a user experience perspective, surface the predicted score prominently on the sales dashboard and lead detail form so sales reps see the qualification confidence at a glance. Many organizations color-code leads based on predicted score (green for high probability, yellow for medium, red for low) to guide qualification decisions. Some teams implement a business rule that automatically assigns high-scoring leads to senior reps and routes low-scoring leads to junior reps for initial outreach, thereby optimizing resource allocation based on deal likelihood.

**Monitoring Model Drift and Retraining**

Predictive models do not remain accurate indefinitely. As your sales process evolves, customer behavior changes, or market conditions shift, the patterns your model learned during training may no longer reflect current conditions (a phenomenon called model drift). Set a quarterly or semi-annual schedule to assess model performance on recent data. If accuracy metrics decline by more than 5 to 10 percent compared to the original test results, retrain the model on a fresh dataset that includes recent leads and opportunities. AI Builder enables retraining as a straightforward operation: select the published model, update the training dataset to include new records, and republish.

Document your model’s feature importance (which inputs the model weights most heavily) so your organization understands what drives scoring decisions. AI Builder provides a feature importance report showing which columns contribute most to the model’s predictions. If your model places high importance on a feature that represents potential data quality issues (for example, “Days Since Last Email” if email tracking is inconsistent), address the data quality problem to improve future model iterations.

**Common Pitfalls and Practical Guidance**

A frequent mistake is training a model on imbalanced data, where one outcome (for example, “converted”) is much rarer than the other. If 80 percent of your historical leads did not convert, the model may learn to simply predict “no conversion” for all leads, achieving high accuracy but zero business value. To address this, explicitly configure class weights in your training setup (telling the model that conversions should be weighted more heavily) or oversample the minority class during data preparation.

Another pitfall is treating the model as a black box. Sales leaders sometimes interpret predicted scores as absolute probabilities rather than relative rankings. Communicate clearly that a predicted score of 0.8 does not mean “this lead has an 80 percent chance to close”; it means the model ranks this lead among the highest-probability prospects relative to others in your pipeline. The model’s value lies in comparative ranking and resource allocation, not in absolute probability estimation.

Finally, involve your sales leadership and operations team in model design and interpretation. If your organization has complex sales processes (for example, different qualification rules for enterprise deals versus mid-market deals), consider building separate models for each segment rather than a single global model. Similarly, if significant changes occur (a major product launch, a shift in target customer, an acquisition), retrain your model on data that reflects these new conditions.

**Conclusion**

Predictive lead scoring powered by AI Builder and native Dynamics 365 integration transforms how sales teams allocate effort and prioritize opportunities. By systematically capturing historical conversion patterns and translating them into forward-looking probability estimates, your organization gains visibility into which prospects justify investment and which may be better pursued later. The technical implementation is straightforward for most organizations: structure historical lead and opportunity data, configure an AI Builder classification model, evaluate performance on test data, and integrate results through Power Automate and the sales interface. Retraining quarterly and involving sales leadership in model governance ensures your scoring system remains effective as market conditions and customer behavior evolve. Routeget Technologies has deployed predictive lead scoring across dozens of Dynamics 365 Sales implementations, helping organizations increase pipeline accuracy and accelerate sales velocity through data-driven qualification.

#PredictiveLeadScoring #AIBuilderDynamics365 #SalesIntelligence #DynamicsSalesAI #CustomerInsights #PredictiveAnalytics #SalesEnablement #DynamicsImplementation #EnterpriseAI #SalesDataStrategy

Data Loss Prevention Policy Implementation in the Microsoft Cloud: Balancing Security and Business Agility

Enterprise data governance dashboard showing Data Loss Prevention policies and security classifications

Data Loss Prevention Policy Implementation in the Microsoft Cloud: Balancing Security and Business Agility

Most IT leaders inherit DLP implementations that operate as expensive friction generators—slow approval workflows, frustrated business units, widespread policy exceptions—rather than effective data protection. The challenge isn’t building DLP capability; it’s building DLP that actually works in practice without crippling business operations.

Dynamics 365, Power Platform, and the broader Microsoft cloud stack move data at volume and velocity that traditional perimeter security cannot monitor. Spreadsheets with customer data flow through Power Automate workflows. Finance teams share GL account details via Teams. Sales consultants upload competitor files to Power Apps. Without intentional DLP governance, sensitive information leaks become statistical inevitability. Yet overly rigid DLP policies drive shadow IT and workarounds that are far less controlled.

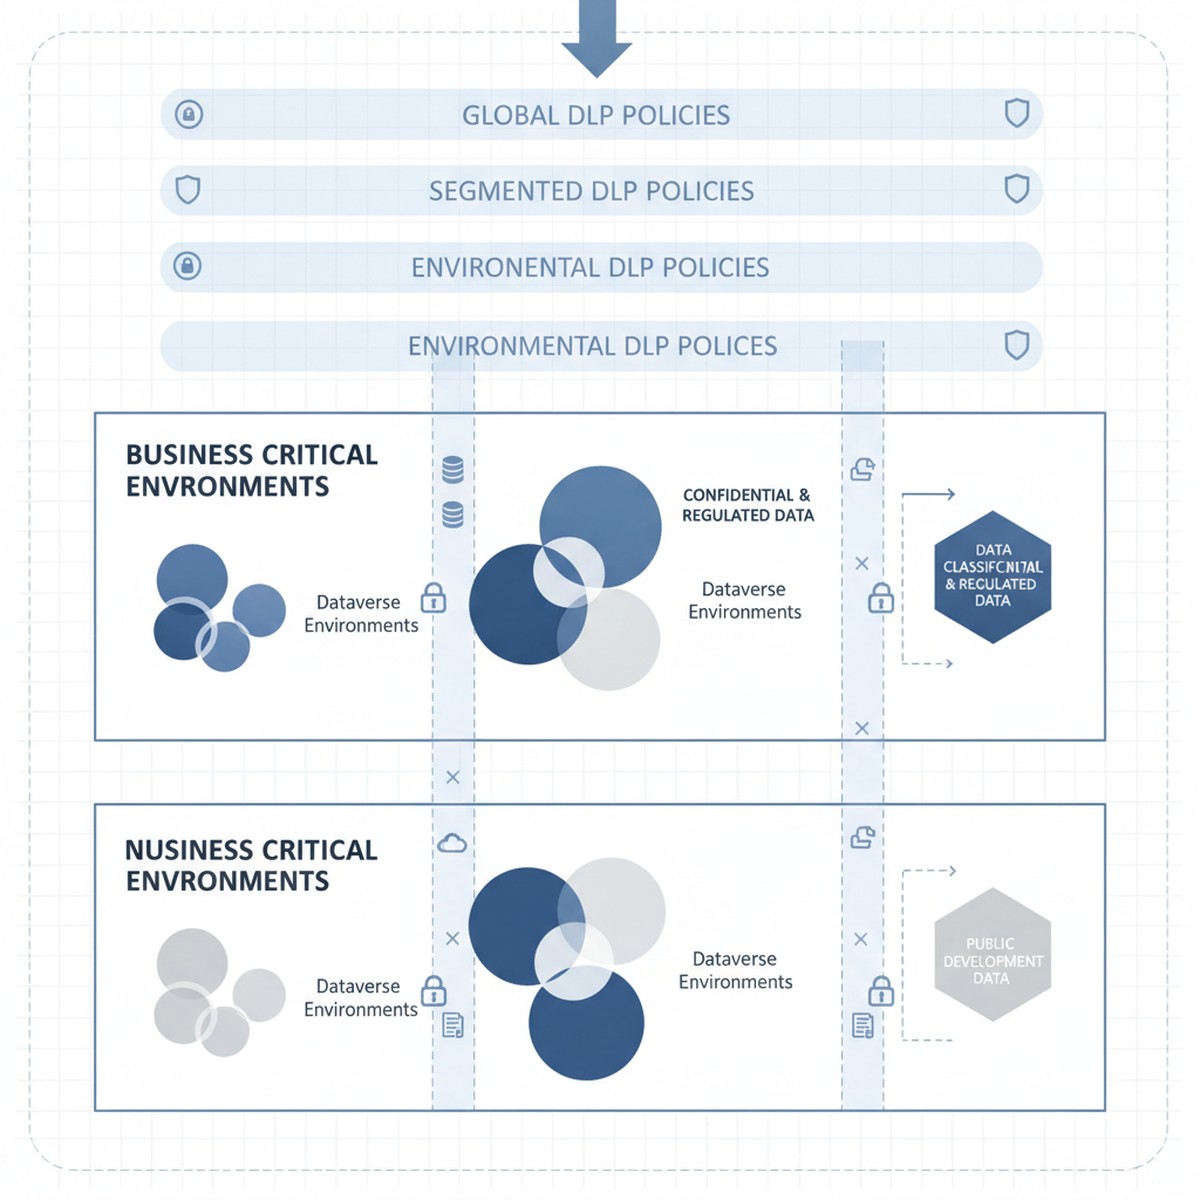
Microsoft cloud security architecture showing Dataverse environments with DLP policy layers and data classification zones

The tension is real: organizations need DLP policies that reduce breach risk and meet compliance requirements without triggering business user revolt. That balance comes from a three-layer approach starting with clear data classification, moving to segmented policy enforcement by workload, and ending with monitoring and exception workflows that catch real breaches without generating approval fatigue.

Understanding Microsoft Dataverse and Power Platform Data Classification

DLP in Microsoft Power Platform starts with a deceptively simple question: what data sensitivity level is stored in this Dataverse environment, and what external services should or should not have access to it?

Every Dataverse environment has an assigned DLP classification set by administrators. Out of the box, the options are “Business” (default), “Non-Business,” and “Unclassified,” each restricting which connectors can be used. An environment marked “Business” cannot call consumer-grade cloud services or public APIs by default. This classification system is the foundation of Power Platform DLP, and many organizations accept it unchanged. That is a mistake.

The actual tension surfaces immediately: a “Business” environment using default DLP classification prevents organizations from using essential connectors. A finance team might need to integrate Power Apps with Stripe for payment processing. A supply chain team needs logistics APIs to track shipments. A sales team needs to send customer records to third-party analytics services. These connectors fall outside default Business classification rules, but blocking them outright prevents legitimate business operations. Conversely, loosening policies to allow these services introduces real data exposure risk—customer payment details flowing to external processors without oversight.

Solving this tension requires abandoning the one-size-fits-all “Business” classification and instead segmenting Dataverse environments by actual data sensitivity and connector requirements. This segmentation becomes the policy framework that supports DLP without strangling innovation.

Segmenting Dataverse Environments by Sensitivity and Connector Requirement

Organizations that manage DLP effectively typically operate multiple Dataverse environments, each with a distinct DLP classification matched to the data sensitivity and connector requirements it actually holds.

Consider a typical enterprise structure: one environment holds Dynamics 365 Finance and Operations data (accounting records, GL accounts, intercompany transactions, supplier information). This is genuinely sensitive data subject to audit requirements and regulatory controls. This environment should be classified as “Business” under a restrictive DLP policy that prevents connectors to external consumer services, cloud file storage, or public APIs. Finance teams access this data through specifically designed Power Apps and Power Automate workflows within DLP constraints.

A second environment holds Power Apps and Power Automate flows that integrate Power Platform with external partner systems—logistics APIs, payment processors, analytics services, and public cloud connectors. This environment accepts connectors to these external services because data sensitivity and use case require it. However, no direct connection to the sensitive Finance and Operations environment is allowed. This environment operates under less restrictive DLP classification because data flowing through it is either lower sensitivity (customer feedback, survey responses, transaction history) or appropriately scoped to external partners.

A third environment is explicitly designated for proof-of-concept work and rapid prototyping. DLP is minimal here because solutions graduate to production environments with full governance only after validation and security review.

This segmentation approach solves the core tension: business users get connector freedom they need, but that freedom is appropriately scoped to environments holding data at the sensitivity level those connectors can safely access. A payment processor connector in the production environment holding Finance data would be irresponsible. The same connector in an e-commerce environment is reasonable.

Implementing Segmented DLP Without Over-provisioning

Segmentation only works when combined with clear governance over which data moves between environments and under what conditions. An organization running multiple Dataverse environments without data movement controls creates the worst outcome: complex DLP policies that block internal workflows and fail to prevent the very data exposure they were meant to restrict.

Governance begins with explicit data classification at the Dataverse table level. Every table in Finance and Operations environments should be tagged as “Highly Sensitive” (GL accounts, supplier data, payroll), “Internal” (historical transactions, internal metadata), or “Public” (product catalogs, customer-facing data). That classification becomes enforceable through data loss prevention rules: a table tagged “Highly Sensitive” cannot be queried by Power Automate flows in non-Business environments. This discipline prevents accidental sensitive data exposure through incorrectly scoped flows.

Second, organizations need exception workflows that actually work. Some business processes require sensitive data to flow to external systems. A customer requesting data export needs records to move outside the enterprise. A third-party audit requires financial table access. Building manual exception workflows—where business stakeholders request exceptions and security reviews them—turns DLP into a shared responsibility. Exception tracking also provides visibility into actual risk: organizations seeing hundreds of requests for sensitive data access learn something valuable about their risk profile.

Monitoring, Alerts, and Real-Time Response

DLP policy design matters, but enforcement and monitoring matter more. An organization with well-designed DLP policies but no monitoring ends up with policies that are either unenforced or inconsistently applied.

Microsoft Dataverse and Power Platform generate audit logs of DLP violations, but by default those logs are difficult to access in real time. Organizations that manage DLP effectively set up automated monitoring through Azure Monitor or Microsoft Sentinel, translating Dataverse audit logs into actionable alerts. A spike in violations from a specific user, a flow attempting repeated queries of sensitive tables, or patterns suggesting data exfiltration should generate alerts that security teams investigate within hours.

Real-time response capability is the difference between DLP as theoretical control and actual protection. When monitoring detects suspicious patterns, the ability to immediately disable Power Automate flows, revoke access to specific environments, or restrict Dataverse tables can interrupt a breach in progress. Without response capability, DLP monitoring is largely forensic—useful for understanding what happened after detection, not for preventing breaches.

Moving Forward: From DLP Compliance Theater to Actual Data Protection

DLP policy implementation is not a one-time project. Organizations that maintain effective data protection continuously adjust policies based on new business processes, security incidents that expose gaps, and platform evolution.

The organizations that manage this effectively treat DLP policy design as a shared responsibility across security, compliance, and business leadership. Policies are transparent—business stakeholders understand constraints and when exceptions can be requested. Exceptions are tracked regularly, signaling whether policies are appropriately calibrated. Monitoring is continuous and actionable, giving security teams real-time visibility into whether DLP policies actually protect data or just generate friction.

When these elements align, DLP stops being a security checkbox and becomes a capability that genuinely reduces sensitive data exposure risk without strangling business operations that depend on data movement and integration.

At Routeget Technologies, we have implemented data loss prevention governance across Dynamics 365 and Power Platform deployments in organizations ranging from mid-market to enterprise. Our approach begins with your current data sensitivity landscape and connector requirements, then builds segmented DLP policies and monitoring infrastructure that protect what matters most while enabling the business agility your teams need.

#DLPGovernance #DataLossPrevention #CloudSecurity #DynamicsCloudArchitecture #PowerPlatformGovernance #DataProtection #ComplianceAutomation #Dynamics365Security #MicrosoftDataverse #EnterpriseCloudGovernance

Building a Center of Excellence for Microsoft Cloud Governance: Establishing Control Without Stalling Innovation

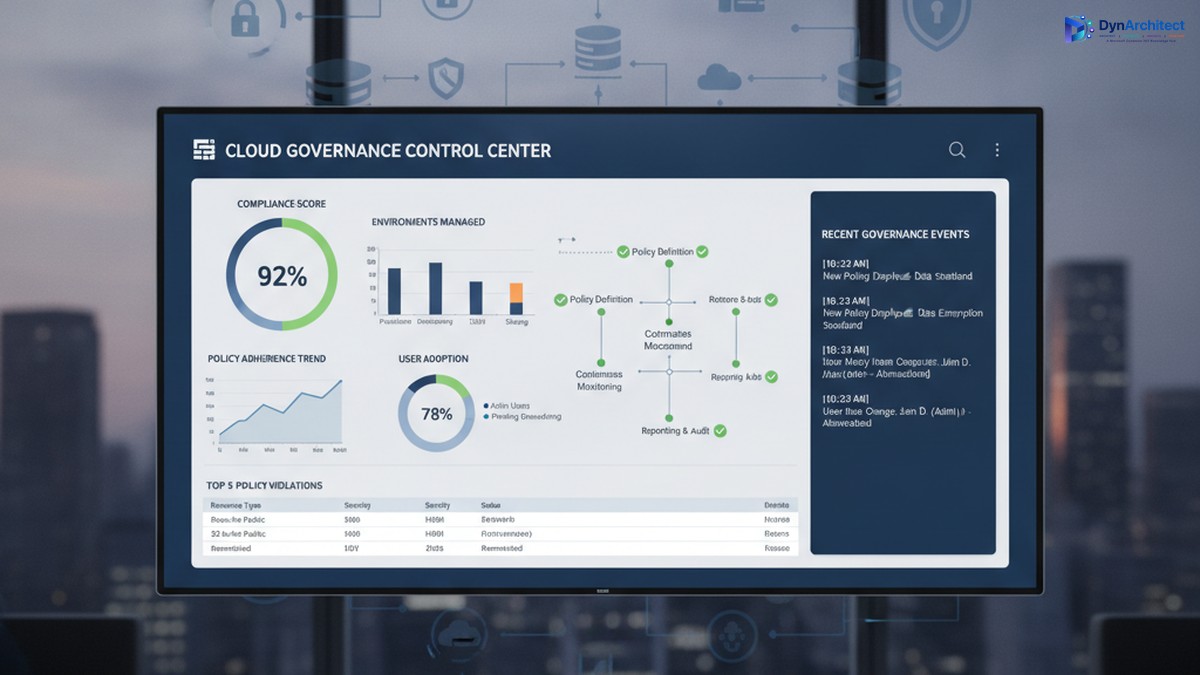
Enterprise cloud governance dashboard showing compliance metrics and governance control center

Building a Center of Excellence for Microsoft Cloud Governance: Establishing Control Without Stalling Innovation

The gap between Microsoft cloud adoption and cloud governance is widening. A CIO with three Power Platform environments deployed across finance, sales, and operations discovers, too late, that each environment has evolved its own authentication rules, data retention policies, and integration patterns. Consolidating them would disrupt active projects. Adding governance now feels like putting handcuffs on people who finally have the tools they need to move fast.

This tension is real, and it is solvable, but it requires a deliberate governance structure: a Center of Excellence (CoE). The purpose of a CoE is not to slow adoption or enforce rigid rules; it is to embed governance into the adoption process itself so that teams can move fast, safely, and with full visibility to leadership.

The Cost of Ungoverned Adoption

When organizations begin adopting Microsoft cloud services, Power Platform, Dynamics 365, Azure, Dataverse, adoption typically starts in one department or use case. A finance team builds a Power App to automate invoice processing. A field service team creates automations to dispatch technicians. Marketing builds a model-driven app to track campaigns. Each team solves a real problem immediately, with minimal delay.

Enterprise cloud governance dashboard showing compliance metrics and governance control center

The problem emerges months later, when three separate environments exist, each configured differently, each with its own data security settings, its own API connectors, and its own integration patterns. A security incident in one triggers questions about the others. A new compliance requirement (data residency, audit logging, export restrictions) means reconfiguring three environments instead of one. A developer leaves, and no one knows what custom logic lives inside automations in that environment. A connector expires, breaking integrations that no one is monitoring centrally.

The cost is not just technical debt. It includes regulatory risk (audit readiness, compliance violations), security risk (data exposure, unauthorized access), operational risk (outages affecting dependent business processes), and financial risk (unused licenses, redundant infrastructure, uncontrolled connector costs). For a mid-market organization, this hidden cost often runs to hundreds of thousands of dollars annually.

Governance after deployment is expensive and disruptive. Retrofitting compliance into three mature environments forces teams to rebuild their solutions or abandon them. Governance before deployment is far cheaper, but it requires structure and clarity on day one.

What a Center of Excellence Is (and Is Not)

A Center of Excellence is a team, function, or governance body responsible for establishing standards, providing guidance, and enforcing policies that keep cloud adoption secure, compliant, and architecturally sound. In the context of Microsoft cloud, a CoE typically has five core responsibilities:

IT leaders and cloud architects collaborating on governance and compliance framework planning

First, it establishes platform standards: which cloud services are approved for use, which are pilot-only, and which are off-limits; which authentication methods are mandatory; how data classification and sensitivity levels map to environments; where connectors can and cannot be used; which compliance frameworks apply (HIPAA, SOC2, PCI DSS, local data residency rules); and how disaster recovery and backup policies are configured.

Second, it onboards new teams and projects by providing reference architectures, reusable templates, and guidance so that new adopters do not have to invent their own governance solutions. A template might be a pre-configured Power Apps environment with the correct security role structure, DLP policies in place, and example connectors already approved and tested.

Third, it monitors ongoing usage and health. This includes license optimization (identifying unused environments and consolidating them), connector audits (catching deprecated or unapproved integrations), security scanning (checking for data exposure and overpermissioned roles), and performance monitoring (identifying resource-intensive automations that need optimization).

Fourth, it provides a feedback loop and governance review process. Teams that encounter a genuine need for a capability that current governance prohibits should be able to propose an exception, and the CoE should evaluate it against risk and organizational goals rather than simply saying no.

Fifth, it acts as an internal consulting function, helping teams plan migrations, optimize environments, troubleshoot problems, and adopt new capabilities safely.

What a CoE is not: it is not a gate that delays innovation. It is not a compliance police force that exists only to say no. It is not a one-person function managed as a side project by someone already stretched thin. These are common failure modes.

Establishing a Governance Foundation

A successful CoE begins with three foundational decisions.

First, secure executive sponsorship and clear governance scope. The CoE needs budget, staffing, and decision-making authority that comes from leadership. Without it, the CoE is a suggestion, not a standard. The scope should define: which Microsoft services the CoE governs (Power Platform, Dynamics 365, Dataverse, Azure, or all of the above); which organizational units must comply (divisions, departments, teams); and what governance decisions the CoE makes directly versus decisions it escalates.

Second, define governance principles that balance control with velocity. A principle might be: “Low-risk, read-only integrations can be self-service and pre-approved; integrations that modify business data require architecture review and security sign-off, but should be approved within two business days, not two weeks.” This principle gives teams clarity on what they can do immediately and what requires review, and it commits the CoE to a review timeline so governance does not become an indefinite bottleneck.

Third, build the governance infrastructure: identify which tools provide visibility and enforcement. This typically includes the Power Platform admin center (for environment management, DLP policies, and connector audits), Azure AD (for identity and access management), Microsoft Purview (for compliance and data governance), and possibly a custom CoE tracker (a Power Apps or Power BI dashboard that centralizes governance data across these tools and makes it visible to team leads and IT leadership).

Staffing and Operating a CoE

A CoE typically starts with a lead (dedicated, not a side project), supported by domain specialists: a Power Platform architect, a Dynamics 365 architect if applicable, a security engineer, and a compliance or risk specialist. For a mid-market organization, this might be three to five people. The CoE lead reports to the CIO or Chief Technology Officer and has direct access to business unit leaders.

The CoE should operate with a clear calendar: environment governance reviews happen monthly, new environment requests are triaged weekly, exception requests are evaluated within two business days, and a quarterly governance review presents data to leadership on usage, compliance status, security incidents, and license optimization opportunities.

Communication is essential. The CoE should publish governance policies in writing (not passed down verbally), maintain a knowledge base with FAQ and troubleshooting guidance, hold a monthly town hall for team leads to learn about new capabilities and governance changes, and send monthly status reports to IT leadership so adoption and governance metrics are visible.

Moving Forward: Quick Wins and Sustained Governance

A CoE need not be perfect from day one. An effective starting point is: document the current state of all cloud environments, establish a data classification standard and assign environments to classification levels, implement DLP policies in Power Platform to prevent data exfiltration, establish environment naming conventions and assign owners, and conduct a security audit to identify and remediate any immediate risks.

Longer-term, invest in automation: automated provisioning of new environments with governance policies pre-applied, automated security scanning and compliance audits, and automated license optimization recommendations. These investments pay off quickly through reduced manual work and faster compliance cycles.

The goal is not perfection. The goal is control: knowing what is deployed, who owns it, what data it contains, and whether it complies with organizational standards. Teams that have this clarity can innovate faster and with less risk, not slower.

Conclusion

A Center of Excellence is how organizations scale cloud adoption from experimental to strategic. It is not governance for governance’s sake; it is governance that removes risk so teams can move confidently. Building one requires executive commitment, clear principles, and sustained staffing, but the return comes quickly in reduced security incidents, faster compliance cycles, and more predictable project outcomes.

At Routeget Technologies, we have built and operated CoE functions for dozens of mid-market and enterprise organizations. We know what works: clear policies, strong automation, and leadership that understands that governance and innovation are not in conflict, they are prerequisites for each other.


#CenterOfExcellence #CloudGovernance #MicrosoftCloud #PowerPlatform #DLP #DataGovernance #ComplianceAutomation #CloudArchitecture #EnterpriseGovernance #DigitalTransformation

Hashtags: #CenterOfExcellence #CloudGovernance #MicrosoftCloud #PowerPlatform #DataGovernance #ComplianceAutomation #CloudArchitecture #EnterpriseGovernance #DigitalTransformation

Building Agentic AI Systems with Copilot Studio: Model Context Protocol Server Integration

Enterprise organizations building AI agents face a fundamental challenge: enabling large language models to perform meaningful work within existing systems while maintaining security, auditability, and control. Copilot Studio provides the interface layer for conversational agents, but traditional API integrations create fragility. Each new action requires endpoint configuration, error handling, and tight coupling to specific business logic. Model Context Protocol (MCP) servers offer a structured alternative. They allow agents to discover, request, and invoke actions across distributed systems through a standardized interface. For development teams architecting production-grade agentic systems, understanding how to design and integrate MCP servers into Copilot Studio workflows separates proof-of-concept prototypes from systems that scale across departments and organizational boundaries.

Understanding MCP as an Agent Capability Layer

The Model Context Protocol is a lightweight, JSON-RPC based standard defining how AI models interact with external tools and data sources. Rather than embedding specific tool definitions directly into an agent’s configuration, MCP creates a server layer that exposes capabilities in a way agents can discover and invoke independently. An MCP server implements two core patterns: resource exposure (providing read access to data or context) and tool definition (declaring executable actions with input schemas and return formats).

In Copilot Studio terms, an MCP server acts as a capability broker between the agent and backend systems. When a user interacts with a Copilot, the agent receives the request, determines which capabilities it needs, and queries the MCP server for available tools. The server responds with a catalog of action definitions; the agent selects appropriate tools, constructs parameters according to the schema, and requests execution. The server performs the action against the underlying system, returns structured results, and the agent synthesizes those results back to the user.

This architecture decouples the agent from specific implementation details. If business processes change or you need to add new backend systems, you extend the MCP server without rewriting agent logic. Teams building multiple agents needing access to the same core systems can reuse the same MCP server across different Copilots, reducing duplication and maintenance overhead.

Designing MCP Servers for Enterprise Dynamics 365 Scenarios

Most MCP server use cases in enterprise environments involve exposing Dynamics 365 and Microsoft Power Platform capabilities through standardized interfaces. Common patterns include MCP servers that expose Dataverse operations (create, read, update, delete with role-based access control), Power Automate flow invocation (triggering automated workflows from agent requests), or custom business logic endpoints (order fulfillment checks, inventory queries, approval workflows).

The design process begins with identifying which actions agents need to perform and who should be authorized. An MCP server accepting arbitrary Dataverse record creation is a security liability; an MCP server that only creates records in a specific table with predefined field values, within the scope of the user’s Dataverse security role, is architecturally sound. Define input parameters explicitly, validate data types and constraints before passing to backend systems, and handle errors gracefully by returning structured error messages the agent can interpret.

Consider a scenario where multiple Copilots need to query customer records, trigger approval workflows, and update lead status based on user interactions. Rather than hardcoding these capabilities into each Copilot, you build an MCP server exposing three tools: GetCustomerInfo, TriggerApproval, and UpdateLeadStatus. Each tool includes access control checks, parameter validation, and error handling. That server becomes the single source of truth for those capabilities; updating the underlying business logic happens once and applies across all agents that use it.

Implementation Considerations and Integration Patterns

Integrating an MCP server with Copilot Studio requires understanding the data flow and potential failure points. The Copilot Studio SDK provides mechanisms for discovering and invoking MCP servers. Configuration points to the server’s network location and credentials. At runtime, when a user interacts with a Copilot, the agent constructs a request to the MCP server’s tool discovery endpoint, which returns available actions. The agent processes the user’s natural language request, determines which tools apply, formats parameters, and invokes the tool via the MCP server. The server responds with execution results (success, failure, or partial success) that the agent interprets.

Resilience matters in this chain. What happens if the MCP server is temporarily unavailable? A well-designed agent might inform the user that a capability is temporarily offline or queue the request for retry. What if the user’s security role doesn’t allow the requested action? The MCP server should reject clearly, rather than attempting the action and failing silently. What if the underlying system returns unexpected data? The MCP server should normalize responses into the schema the agent expects.

Monitoring and observability are equally important. Log which tools were invoked, by which user, with which parameters, and what the outcome was. Structured logging (JSON format, clear event types) makes it easier to analyze patterns and identify when tools start failing unexpectedly.

Building Custom Tools Within the MCP Server Framework

Custom tools are where the MCP server delivers business value. Instead of asking users to navigate a system directly, an agent can expose a conversational interface that guides users through actions and invokes appropriate tools. An example: an expense approval workflow. The underlying Dynamics 365 workflow requires expense data (employee ID, category, amount, justification) in specific fields, routed to appropriate managers. An agent with access to an MCP-exposed tool can accept the conversational description (“I need to submit a client dinner expense of $500 for Tuesday”), parse relevant details, validate them against business rules (Is the user authorized? Is the amount within policy?), and invoke the approval tool, all without asking the user to navigate a form.

Building these tools requires clarity about inputs, validation, and return values. Tool definitions in MCP include a name, description (used by the agent to understand when to invoke), input schema (JSON schema specifying required and optional parameters), and implementation code. The implementation typically retrieves information from Dynamics 365 or Power Platform, applies business logic (checking approval authority, order fulfillment status, next process steps), and returns structured results. If implementation requires multiple backend calls (query Dynamics 365 customer data, check Power Automate status, verify external inventory), the MCP server orchestrates those calls and returns unified responses.

Error handling at this layer is critical. If a tool invocation fails (customer record not found, workflow error, API timeout), return error information the agent can act on. A generic “something went wrong” response is not useful; “Customer record with ID X not found in Dynamics 365” gives the agent actionable context.

Scaling and Common Pitfalls

As organizations mature their agentic AI adoption, a single MCP server often serves multiple Copilots across departments. A sales Copilot needs customer and opportunity records; an operations Copilot needs inventory and order fulfillment data; a finance Copilot needs expense and budget information. A centralized MCP server exposes core capabilities in a standardized way, and each Copilot calls the same server but requests only the tools it needs, avoiding duplication and inconsistent business logic.

Scaling also means handling load. An MCP server might receive tool requests from dozens of agents simultaneously, each serving multiple concurrent users. The server should queue requests appropriately, implement rate limiting if necessary, and fail gracefully if backend systems become unavailable. Caching helps. If the same customer record is requested repeatedly, the MCP server can cache it briefly rather than querying Dynamics 365 every time.

Teams new to MCP often make predictable mistakes. One: defining tool inputs too loosely. A tool that accepts “any Dataverse table name” is a security risk. Constrain tool inputs to specific, well-defined options. Two: insufficient error handling. Wrap backend calls in try-catch blocks, validate responses against expected schemas, and return clear error messages. Three: lack of monitoring. Implement structured logging, alert on tool invocation failures, and track response times so you identify performance regressions.

Moving Forward

If your organization is building agentic AI systems with Copilot Studio, the decision to use MCP servers should be driven by scope and complexity. A single Copilot performing a handful of simple lookups might not need the structure MCP provides. A multi-Copilot environment where agents need access to shared capabilities benefits significantly from MCP’s decoupling and standardization.

Start by inventorying the capabilities your agents need to perform. Group them by system (Dynamics 365 capabilities, Power Automate invocations, external APIs). Design an MCP server that exposes those capabilities through well-defined tools, with input validation, access control, and error handling. Build incrementally. Launch with the core capabilities your first Copilot needs, then extend it as additional Copilots come online. Monitor usage and iterate on tool definitions based on agent feedback.

The result is a more maintainable, scalable, auditable system where agents focus on conversational understanding and reasoning, while MCP servers handle the complex work of integrating with enterprise systems reliably and securely.

—

Routeget Technologies brings deep expertise in designing and deploying agentic AI systems within Microsoft Dynamics 365 and Power Platform environments, from MCP server architecture to multi-Copilot deployment strategies.

Tags: #AgenticAI #CopilotStudio #ModelContextProtocol #AIAgents #DynamicsIntegration #PowerPlatform #AIDevelopment #CloudArchitecture #Dynamics365 #EnterpriseSoftware

Multi-Currency Operations and Exchange Rate Management in Business Central: Navigating Global Transactions with Confidence

Business Central multi-currency operations interface

Multi-Currency Operations and Exchange Rate Management in Business Central: Navigating Global Transactions with Confidence

Organizations operating across multiple geographies face a persistent challenge: managing transactions in foreign currencies while maintaining accurate financial reporting in their home currency. For midmarket companies expanding internationally, this challenge intensifies as foreign sales and sourcing become central to revenue and profitability. The cost of financial inaccuracy compounds across months of trading, creating either unexpected write-downs or inflated asset values that misrepresent organizational health to stakeholders and auditors alike.

Business Central addresses this directly through a built-in multi-currency framework that automates both conversions and accounting treatment of exchange rate fluctuations. Unlike manual spreadsheet-based approaches or systems that force workarounds, Business Central integrates currency management with general ledger posting, bank reconciliation, and financial reporting. This keeps your books accurate without requiring manual intervention after each transaction closes or demanding error-prone spreadsheet work during month-end.

Business Central multi-currency operations interface

The Problem With Currency Conversion At Scale

Most organizations begin handling foreign currency informally: receiving invoices in EUR or GBP, converting at the spot rate of the transaction day, and recording the home-currency amount manually. As transaction volume grows, this approach breaks down. Spot rates move daily. Which rate should you use for a purchase order placed Monday but invoiced Friday? When payment occurs three weeks later, the rate has shifted again. By year-end reconciliation, you have multiple rates applied to transactions in the same account with no clear audit trail of which rate was used when or why.

The financial statement impact is equally murky. Unpaid invoices in foreign currency represent unrealized gains or losses as rates fluctuate between transaction date and payment date. Without systematic adjustment, these gains and losses either go unrecorded until payment occurs or are manually estimated in spreadsheets, creating reconciliation risks and audit complications. For auditors and stakeholders reviewing financial statements, the inability to explain the currency position reliably signals weak financial controls over a core operational area.

Finance professional reviewing global transactions

Business Central solves this by enforcing a structured approach: every transaction in a foreign currency is recorded using a defined exchange rate, gains and losses are calculated algorithmically and posted to designated accounts in real time, and the entire history remains queryable and auditable.

How Business Central Structures Multi-Currency Operations

At its foundation, Business Central maintains a currency master file where each foreign currency you transact in is defined with an ISO code and associated exchange rates. You can enter rates manually through its Currency Exchange Rates interface, or configure external feeds to push rates automatically on a schedule you define. This choice affects both the frequency with which rates are updated and the operational overhead involved in maintaining current rates.

When you create a purchase or sales transaction in a foreign currency, Business Central records it using the exchange rate valid on the posting date. The system maintains this rate on the transaction itself, creating an immutable record of which rate was used for which transaction. This becomes critical when adjustments happen, because you can trace every change back to the posting date and its associated rate.

The exchange rate adjustment process, which Business Central runs via a batch job you schedule periodically (monthly is standard practice, though you can run it weekly or more frequently), is where the real financial control emerges. When exchange rates fluctuate between the posting date and payment date (or between posting date and month-end), Business Central calculates the unrealized gain or loss and posts it automatically. These adjustments hit designated accounts in your chart of accounts, which means they flow into financial reporting without manual journal entry and without the risk of being omitted.

For example, consider a 1,000 EUR invoice posted on January 1 at a rate of 1.12, creating a 1,120 home-currency liability. By month-end, the EUR strengthens to 1.125, and you run exchange rate adjustment. Business Central recalculates the liability to 1,125 and posts the 5-unit unrealized gain to your unrealized gains account. Three weeks later, when you actually pay the invoice and the rate is 1.12, the system reverses the unrealized gain and posts the realized loss, so your final cash outflow and gain/loss reflect the actual payment rate. This automation eliminates the reconciliation headache of manual currency adjustments and reduces the risk that period-end close occurs with outdated FX positions still in the books.

Implementation Considerations and Configuration Choices

Implementing multi-currency in Business Central requires deliberate choices about how rates are sourced and how gains and losses are distributed across your organization. The first decision is rate maintenance: will you update exchange rates manually through Business Central’s interface, or will you connect an external service to push rates automatically? For organizations with active trading in more than three or four currencies, automatic feeds significantly reduce operational overhead and eliminate the risk of a forgotten rate update that invalidates weeks of transactions. Business Central supports integration with common data services, and many organizations use this as part of a broader data automation strategy.

The second decision concerns the treatment of exchange rate adjustments across your chart of accounts. Business Central allows you to designate separate accounts for unrealized gains versus realized gains, and to choose whether those accounts roll up by currency, by customer/vendor group, or at the enterprise level. This choice affects how granular your FX reporting can be and what insights finance leaders can extract from the system.

A third consideration is the frequency of adjustment runs. Running exchange rate adjustment monthly is standard and aligns with close cycles, but some organizations run weekly, particularly if they have significant open positions in high-volatility currencies. Each adjustment run is reversible and can be previewed before posting, so running it more frequently carries minimal risk but does create more ledger entries.

For organizations with multiple legal entities, Business Central’s dimension functionality lets you attach currency exposure to any dimensional breakout you define. This means your FX reporting can follow your organizational structure.

Practical Benefits and Financial Outcomes

The operational benefit of Business Central’s multi-currency system is straightforward: it reduces the time and error risk in period-end close. Instead of manually identifying open foreign-currency items, looking up rates, calculating adjustments, and posting them as journal entries, the system does this automatically. For most organizations, this saves 2-5 hours of close time per month and eliminates one of the most error-prone manual steps.

The financial control benefit is more significant. Because all currency gains and losses are posted to the general ledger automatically, they cannot be overlooked. Every financial statement shows currency impacts accurately. For organizations evaluating Business Central against legacy systems, this multi-currency functionality is often a deciding factor, removing a category of financial risk that many organizations accept begrudgingly under their current systems.

Moving Forward

Organizations realizing the most value treat multi-currency not as compliance requirement, but as strategic capability. By maintaining clear system-based visibility into currency impacts, your finance team makes better decisions about hedging, payment timing, and currency-specific pricing strategies. This shifts currency management from necessary accounting chore to competitive tool.

Routeget Technologies helps organizations configure and optimize multi-currency operations in Business Central during ERP implementations and upgrades. If your finance team manages exposures through disconnected tools, or if you’re evaluating Business Central for your specific currency scenarios, we can walk through your environment and demonstrate how the system simplifies this complex area of financial operations.

#BusinessCentral #MultiCurrencyERP #ExchangeRateManagement #FinanceOperations #ERPImplementation #GlobalFinance

Power Apps Governance and Scaling: Building Enterprise Applications Without Creating Technical Debt

Enterprise Power Apps governance dashboard with application portfolio metrics and CoE framework

Problem Statement (Opening Hook)

Six months after launching your Power Apps initiative, you have 47 applications built across the organization. You’re congratulating yourself on driving digital velocity when IT discovers that 23 of those apps are querying the production Dataverse directly without connection audits, three apps are storing passwords in Power Automate flows, and nine apps were built with Dataverse tables that now conflict with the enterprise data model you’re implementing for Dynamics 365. You also cannot tell which apps are critical, which are experimental, and which are duplicates of work already done by other teams. This is not a Power Apps problem. This is a governance problem, and the cost of fixing it later vastly exceeds the cost of defining it now.

Why Power Apps Governance Matters at Scale

Power Apps succeeds because it is low-code. Business teams move faster. IT provisioning cycles shrink from months to days. Without governance, organizations end up managing application sprawl rather than portfolio. They face compliance risks when applications store regulated data without proper encryption. They accumulate technical debt through duplicate apps and integration spaghetti. Most critically, they lose the ability to retire old applications because no one remembers dependencies.

Governance does not mean blocking innovation. It means setting up boundaries so innovation happens inside a framework that scales. Done well, governance feels like enabling guardrails rather than restrictive rules.

The Three Pillars of Effective Power Apps Governance

Governance across Power Platform breaks into three interdependent areas: application lifecycle management (ALM), data governance, and access control. Each addresses a different aspect of operational risk, and each requires clarity before you have hundreds of applications in production.

ALM defines how applications move from development to test to production, who approves releases, and how rollback works. Without ALM discipline, applications get updated without testing and deployments happen without documentation. Microsoft Power Platform’s ALM tooling (solution containers, source control integration, deployment pipelines) is mature. Using it from the first application, rather than retrofitting later, saves significant effort.

Data governance specifies which Dataverse tables are available to which applications, which fields those applications can read and write, whether applications have direct table access or go through a custom API layer for auditing, and how data synchronization happens when multiple applications share tables. Organizations that skip data governance often discover halfway through Dynamics 365 F&O implementation that Power Apps developers were extending the General Ledger table directly, bypassing the compliance logic built into the F&O ledger posting engine. Starting with a canonical data model and enforcing read-write boundaries prevents those conflicts.

Access control governs who can create applications, what permissions they have, whether they can publish to production, and what user-level permissions applications inherit. Many organizations default to giving all users “create” permissions in Power Platform, then react with panic when app sprawl becomes visible. Instead, defining roles and mapping them to permission levels creates scalability. Skilled developers need broad creation rights. Business power users need constrained environments where they can build applications without affecting production infrastructure.

Enterprise Power Apps governance dashboard with application portfolio metrics and CoE framework

Common Governance Failures

Most organizations make one of three mistakes. The first is defining governance so rigorously it kills velocity. Requiring sign-off from multiple committees before publishing an app causes teams to work around the process in unsanctioned environments. The second mistake is defining no governance at all. Teams build freely until compliance audits arrive. Retrofitting governance then requires temporarily shutting down production applications to audit and repair them. The third mistake is defining governance on paper without technical enforcement. Policies exist but the actual permissions and Dataverse configurations never match. Effective enforcement requires embedding governance into administration, not just culture.

Effective governance finds the middle ground. It sets clear, enforceable boundaries while leaving room for teams to innovate within those boundaries. It is documented not in slides but in the actual configuration of your Dataverse, your solution containers, and your deployment pipelines.

Building a Practical Governance Framework

Start with application classification. Tier applications by criticality: mission-critical (runs the business and cannot fail), important (supports major business process and needs monitoring), and experimental (proof-of-concept or exploratory work). Mission-critical and important applications get the most scrutiny. Experimental applications get looser controls. This prevents governance overhead from killing innovation while ensuring critical work gets appropriate rigor.

Next, establish your Dataverse data architecture before widespread application development begins. Define which tables are canonical and which are read-only views or replicas. Specify who owns each table. Set up row-level security policies and field-level permissions. If applications bypass the model, audit logs show it. This enforces a single version of truth and prevents applications from accidentally conflicting.

Implement solution containers and source control integration. Every application goes into a solution container, not deployed loose to the environment. Solutions are version-controlled in Git. Deployments go through a clear pipeline: development environment, test environment, staging, production, with manual gates between stages. Automate testing at each stage where possible. This creates an audit trail of every change and makes rollback possible.

Enterprise development team collaborating with ALM workflows and CI/CD pipelines on display monitors

Set up a governance review board (often called a CoE governance committee) that meets monthly to review application portfolio health, approve new high-risk applications, and identify applications for retirement. The board includes IT architecture, security, compliance, and business process representatives. This is not a blocking committee. It is an enabling committee that helps teams navigate governance boundaries and flags risks early.

Finally, communicate governance as infrastructure, not as restriction. Frame governance conversations around what it enables: faster time to production for compliant applications, easier integration with enterprise systems, reduced security risk, and the ability to retire old applications without cascading failures. Teams that understand the rationale behind governance adopt it voluntarily.

Technical Debt and Long-Term Maintenance

Technical debt in Power Apps manifests quietly. An application built against a local Dataverse table works fine for six months until the enterprise decides to synchronize that table with Dynamics 365. The app breaks because its queries now hit a different data source. Another application stores customer IDs in a text field. When customer ID standards change, updating that field breaks any app that relied on the old format. A third application has hard-coded access credentials buried in flows. When those credentials rotate, the application goes dark.

These failures happen because applications were not architected for change. Avoiding technical debt requires discipline upfront: use API layers instead of direct table access, parameterize configuration values, separate data schemas from application logic, build retry logic into integrations, and document dependencies. It also requires governance processes that periodically review applications for architectural drift.

Balancing Speed and Control

The tension between moving fast and maintaining governance is real. The resolution is not to choose one or the other, but to acknowledge that different applications need different levels of control. A dashboard for business analytics needs different governance than an application that writes to the General Ledger. A proof-of-concept application needs different processes than a mission-critical customer portal. Tailoring governance to the application’s role allows you to move fast where speed matters and deliberate where risk is highest.

Organizations that execute this balance well report that governance, once established, does not slow velocity. If anything, it accelerates it. Teams know the boundaries. Deployments are predictable. Integration is straightforward. Failures do not cascade. Applications retire cleanly. The cost of operating the Power Platform ecosystem decreases even as the number of applications grows.

Building for Sustainable Scale

Power Apps’ promise is that business teams can build applications without IT intermediaries. Realizing that promise at scale requires intentional governance, not despite that governance, but because of it. The organizations building the most applications fastest are the ones with the clearest governance frameworks. They have defined what good looks like. They enforce it technically. They review it regularly. They adjust it based on what they learn.

If your organization is still in the early stages of Power Apps adoption, spending time now on governance infrastructure saves vastly more time later. If you are already in growth mode with sprawling applications, implementing governance means making deliberate choices about which applications to migrate to ALM pipelines first and which to retire. Either way, the question is not whether to govern Power Apps at scale. The question is how quickly you can build governance that enables scale rather than constrains it.

Routeget Technologies works with organizations across this journey, from establishing governance frameworks and Center of Excellence operations to implementing ALM pipelines and data architecture for large-scale Power Platform deployments. The difference between organizations that scale Power Apps sustainably and those that end up in technical debt rework usually comes down to governance discipline established early and reinforced consistently.

#PowerAppsGovernance #PowerPlatformCoE #ApplicationLifecycleManagement #LowCodeGovernance #EnterpriseArchitecture #DataverseGovernance #PowerAppsDevelopment #DigitalTransformation